. 2018 Jul;5(3):034502.
doi: 10.1117/1.JMI.5.3.034502. Epub 2018 Sep 6.

Classification of suspicious lesions on prostate multiparametric MRI using machine learning

Affiliations

Classification of suspicious lesions on prostate multiparametric MRI using machine learning

Deukwoo Kwon et al. J Med Imaging (Bellingham). 2018 Jul.

Abstract

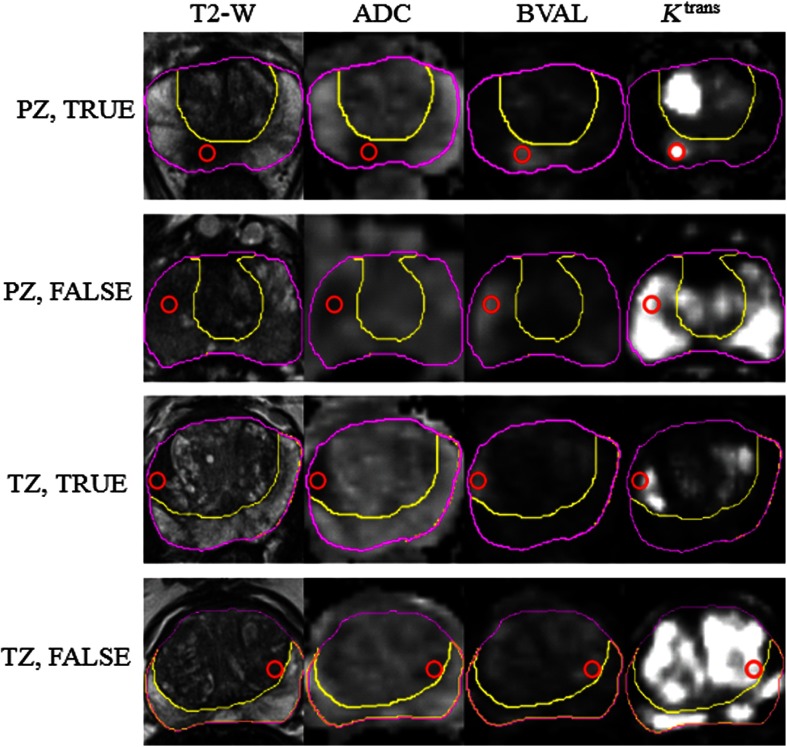
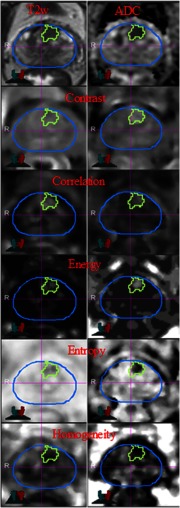
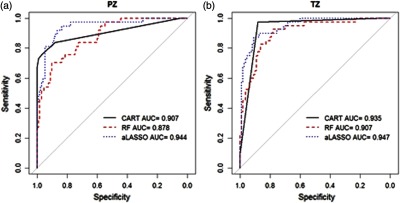
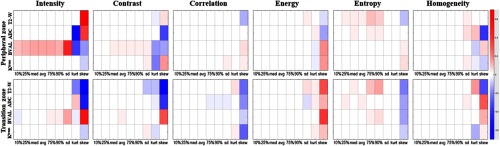
We present a radiomics-based approach developed for the SPIE-AAPM-NCI PROSTATEx challenge. The task was to classify clinically significant prostate cancer in multiparametric (mp) MRI. Data consisted of a "training dataset" (330 suspected lesions from 204 patients) and a "test dataset" (208 lesions/140 patients). All studies included T2-weighted (T2-W), proton density-weighted, dynamic contrast enhanced, and diffusion-weighted imaging. Analysis of the images was performed using the MIM imaging platform (MIM Software, Cleveland, Ohio). Prostate and peripheral zone contours were manually outlined on the T2-W images. A workflow for rigid fusion of the aforementioned images to T2-W was created in MIM. The suspicious lesion was outlined using the high b-value image. Intensity and texture features were extracted on four imaging modalities and characterized using nine histogram descriptors: 10%, 25%, 50%, 75%, 90%, mean, standard deviation, kurtosis, and skewness (216 features). Three classification methods were used: classification and regression trees (CART), random forests, and adaptive least absolute shrinkage and selection operator (LASSO). In the held out by the organizers test dataset, the areas under the curve (AUCs) were: 0.82 (random forests), 0.76 (CART), and 0.76 (adaptive LASSO). AUC of 0.82 was the fourth-highest score of 71 entries (32 teams) and the highest for feature-based methods.

Keywords: machine learning; multiparametric MRI; prostate cancer.


Figures

Fig. 1
Fig. 1
Examples of images from the analyzed dataset. The following sequences from the multiparametric (mp)MRI were analyzed: T2-weighted MRI (T2-W), ADC, high B-value (BVAL), and Ktrans. The prostate and PZ volumes were manually contoured on T2-W. Four lesions, marked with True and False in the PZ and TZ, are illustrated. The red circle marks the centroid of the lesion. Note that the “true” lesions are characterized by hypointensity on T2-W and ADC and high signal on BVAL and Ktrans. The hypointensity on T2-W and high Ktrans is less specific on the “false” lesions.
Fig. 2
Fig. 2
Texture features in lesion contour on T2-weighted (T2-W) MRI and ADC maps.
Fig. 3
Fig. 3
ROC curves and AUCs in the training dataset by three classification methods in (a) PZ and (b) TZ. Abbreviations: CART, classification and regression trees; RF, random forest; and LASSO, least absolute shrinkage and selection operator.
Fig. 4
Fig. 4
Univariable analysis for association of imaging variables with lesions aggressiveness in the training dataset: the regression coefficients from univariate logistic regression are displayed as a heat-map in shades of blue (negative associations) to red (positive associations). Each imaging feature (intensity, contrast, correlation, energy, entropy, and homogeneity) is characterized by nine attributes (10%, 25%, med, avr, 75%, 90%, sd, kurt, and skew) displayed in the x axis. The imaging variables in each row are associated with particular sequence (T2-W, ADC, BVAL, and Ktrans). The imaging variables for the PZ are displayed in the top panel and for the transition zone–bottom panel.

References

    1. Siegel R. L., Miller K. D., Jemal A., “Cancer statistics, 2018,” CA Cancer J. Clin. 68(1), 7–30 (2018).CAMCAM10.3322/caac.v68.1 - DOI - PubMed
    1. Isebaert S., et al. , “Multiparametric MRI for prostate cancer localization in correlation to whole-mount histopathology,” J. Magn. Reson. Imaging 37(6), 1392–1401 (2013).10.1002/jmri.23938 - DOI - PubMed
    1. Futterer J. J., et al. , “Can clinically significant prostate cancer be detected with multiparametric magnetic resonance imaging? A systematic review of the literature,” Eur. Urol. 68(6), 1045–1053 (2015).EUURAV10.1016/j.eururo.2015.01.013 - DOI - PubMed
    1. Barentsz J. O., et al. , “ESUR prostate MR guidelines 2012,” Eur. Radiol. 22(4), 746–757 (2012).10.1007/s00330-011-2377-y - DOI - PMC - PubMed
    1. Mclean R. A., Sanders W. L., Stroup W. W., “A unified approach to mixed linear-models,” Am. Stat. 45(1), 54–64 (1991).10.2307/2685241 - DOI