. 2019 Mar 5;26(10):2704-2719.e6.
doi: 10.1016/j.celrep.2019.02.019.

Fasting-Mimicking Diet Modulates Microbiota and Promotes Intestinal Regeneration to Reduce Inflammatory Bowel Disease Pathology

Affiliations

Fasting-Mimicking Diet Modulates Microbiota and Promotes Intestinal Regeneration to Reduce Inflammatory Bowel Disease Pathology

Priya Rangan et al. Cell Rep. .

Abstract

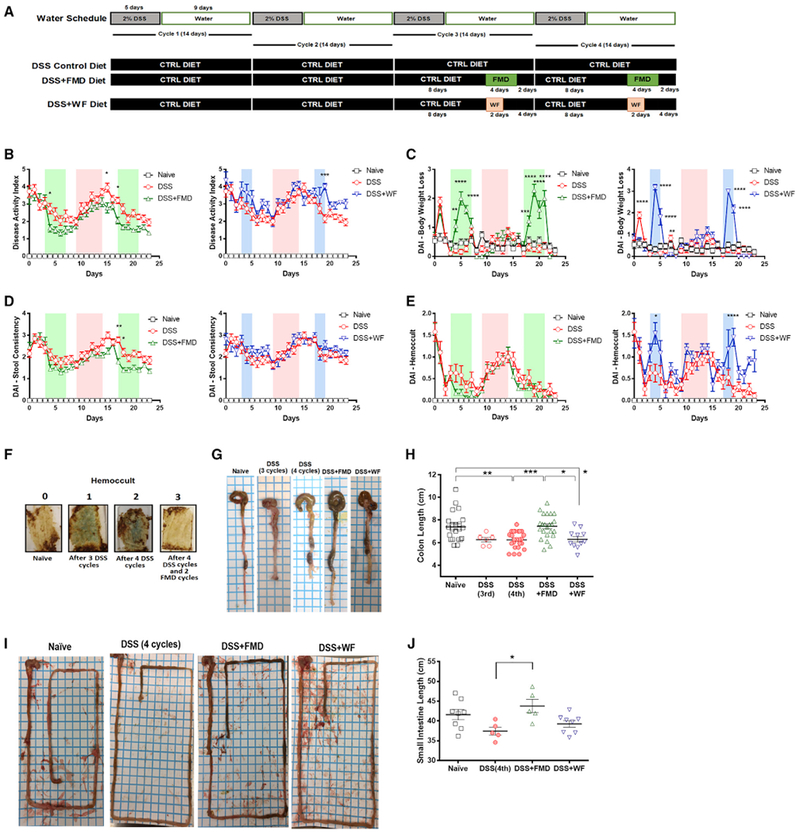
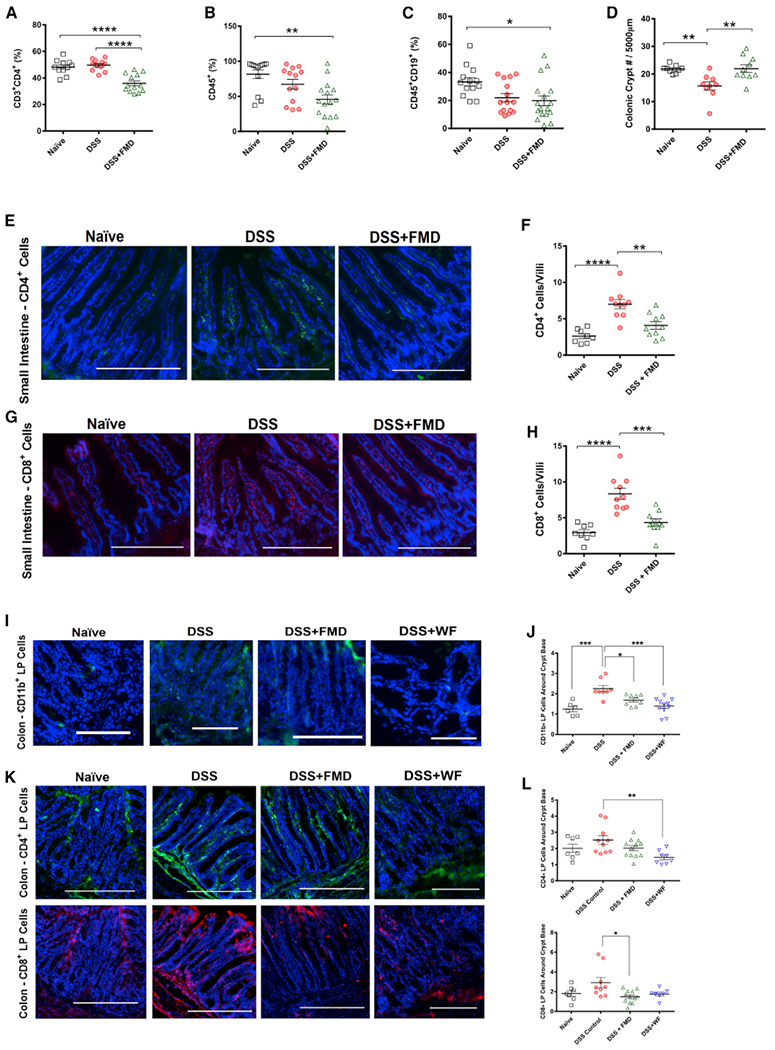
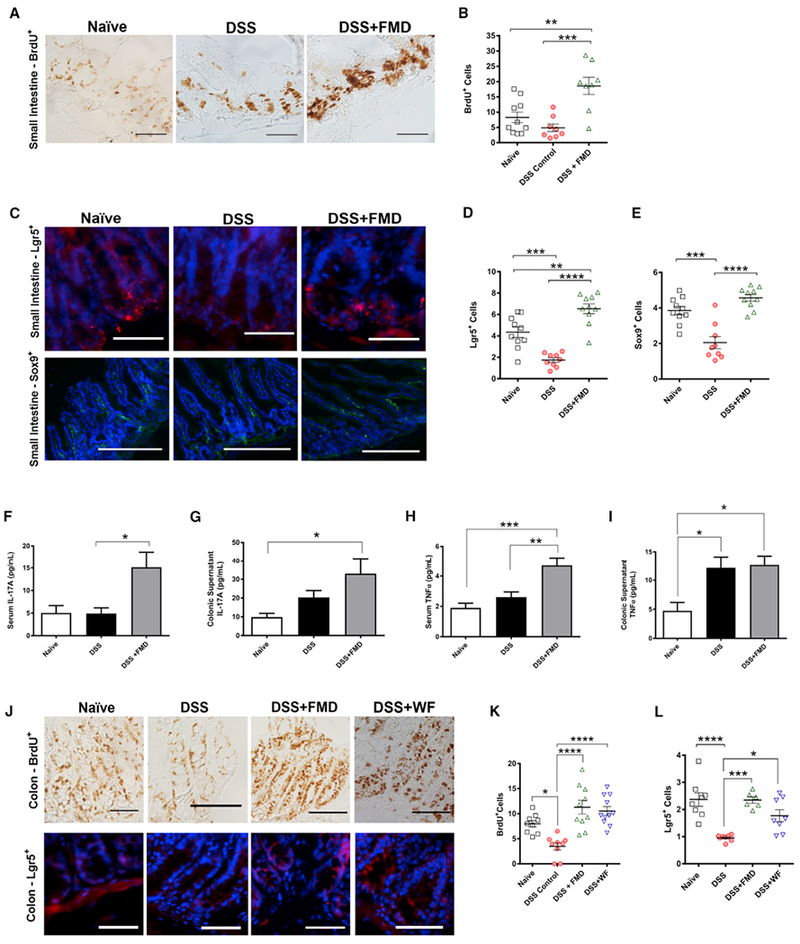
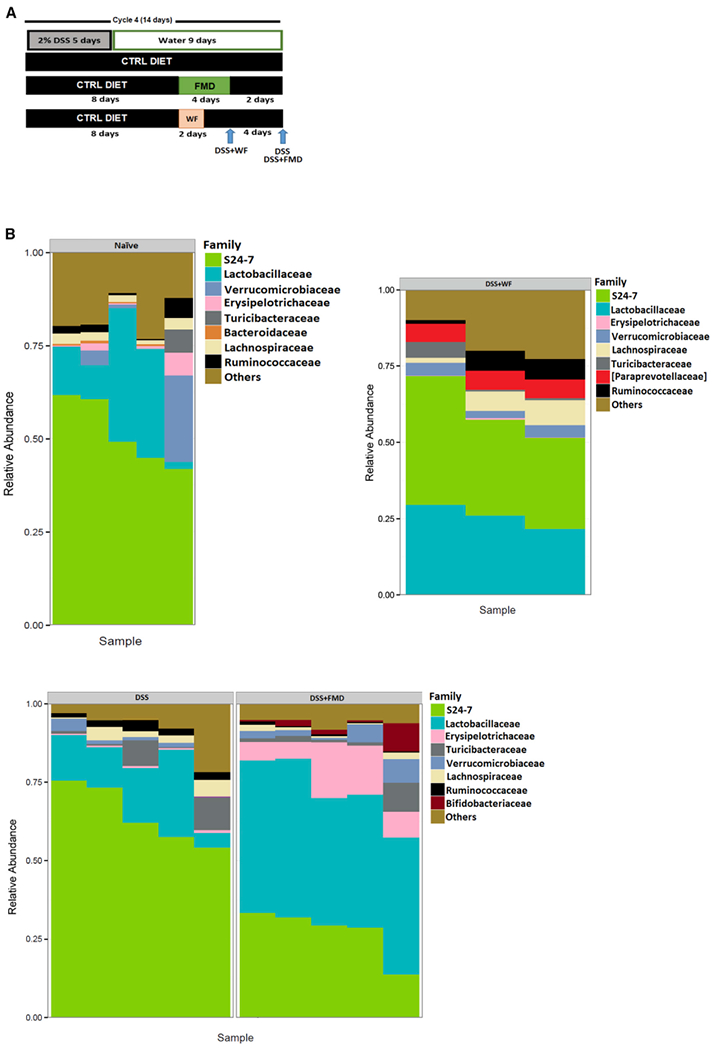
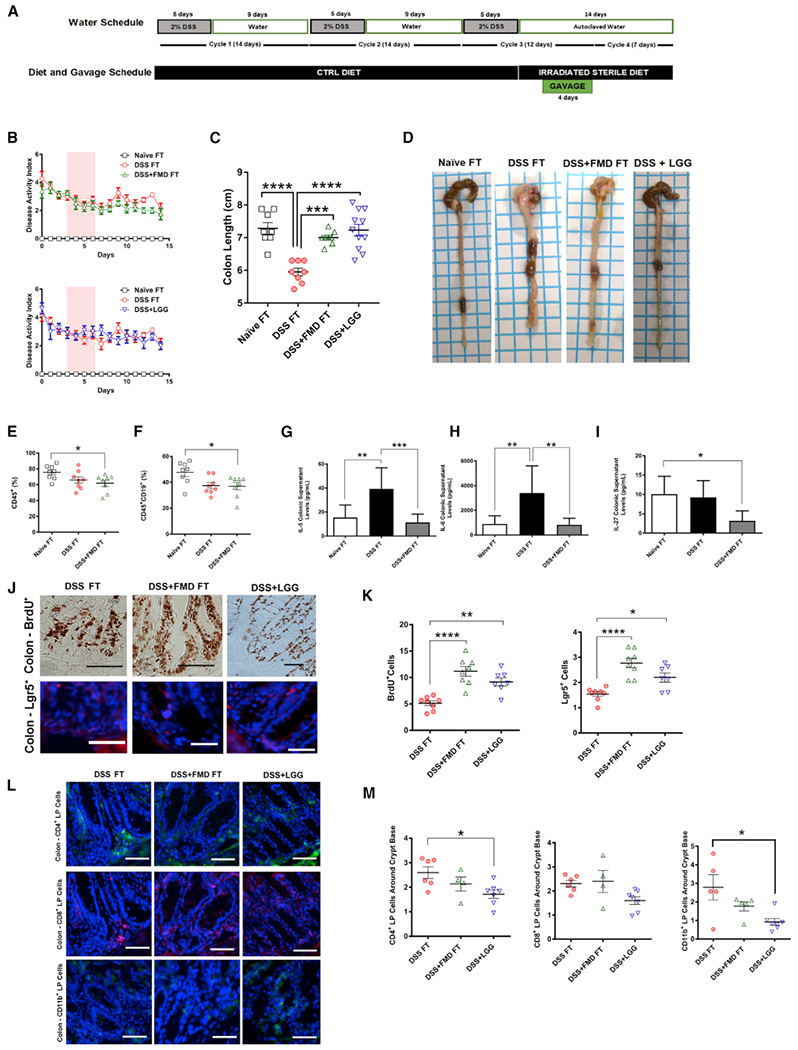
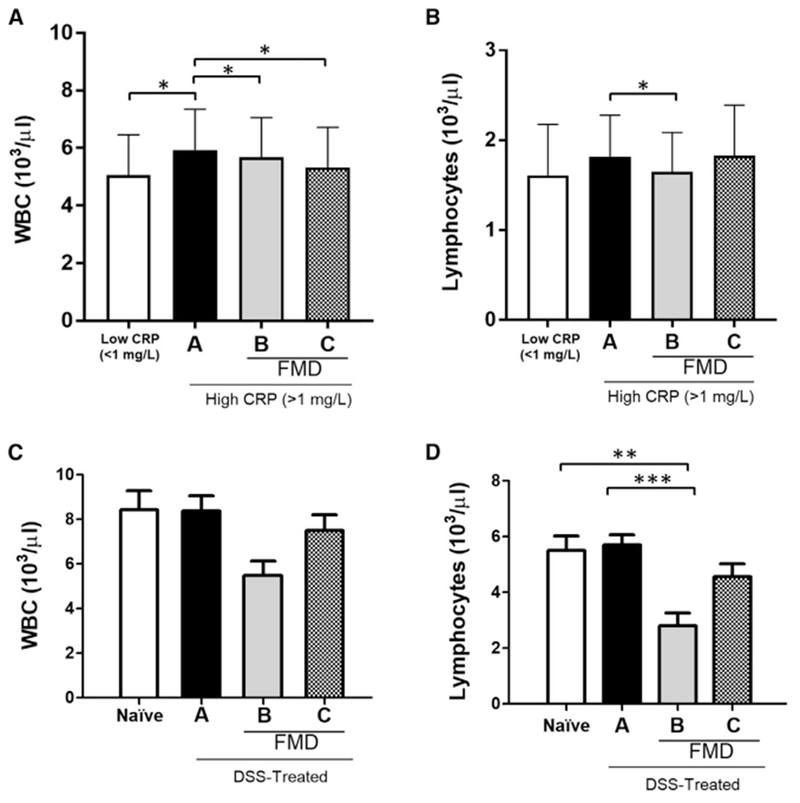
Dietary interventions are potentially effective therapies for inflammatory bowel diseases (IBDs). We tested the effect of 4-day fasting-mimicking diet (FMD) cycles on a chronic dextran sodium sulfate (DSS)-induced murine model resulting in symptoms and pathology associated with IBD. These FMD cycles reduced intestinal inflammation, increased stem cell number, stimulated protective gut microbiota, and reversed intestinal pathology caused by DSS, whereas water-only fasting increased regenerative and reduced inflammatory markers without reversing pathology. Transplants of Lactobacillus or fecal microbiota from DSS- and FMD-treated mice reversed DSS-induced colon shortening, reduced inflammation, and increased colonic stem cells. In a clinical trial, three FMD cycles reduced markers associated with systemic inflammation. The effect of FMD cycles on microbiota composition, immune cell profile, intestinal stem cell levels and the reversal of pathology associated with IBD in mice, and the anti-inflammatory effects demonstrated in a clinical trial show promise for FMD cycles to ameliorate IBD-associated inflammation in humans.

Keywords: Crohn’s disease; fasting; fasting-mimicking diet; gut microbiota; inflammation; inflammatory bowel disease; intermittent fasting; microbiome; ulcerative colitis.


Conflict of interest statement

DECLARATION OF INTERESTS

V.D.L. has equity interest in L-Nutra, which develops and sells medical food for the prevention and treatment of diseases. V.D.L. has committed all his equity in the company to charitable organizations. V.D.L., P.R., and I.Y.C. have filed a patent related to this study at the University of Southern California (USC).

Figures

Figure 1.
Figure 1.. FMD Cycles Ameliorate IBD-Associated Disease Phenotypes and Increase Colon and Small Intestine Lengths
(A)Experimental scheme outlining the water schedule and duration of DSS, DSS+FMD, and DSS+WF diets. (B) The modified disease activity index (DAI) scores (with body weight loss removed) of the Naive (n = 15), DSS control diet (DSS; n = 19), DSS control diet plus 2 cycles of FMD (DSS+FMD; n = 18), and DSS control diet plus 2 cycles of water-only fasting (DSS+WF; n = 11) groups starting after the third DSS cycle. (C) The body weight loss variable of the DAI scores of the Naive (n = 15), DSS (n = 19), DSS+FMD (n = 18), and (DSS+WF; n = 11) groups starting after the third DSS cycle. (D)The stool consistency variable of the DAI scores of the Naive (n = 15), DSS (n = 19), DSS+FMD (n = 18), and DSS+WF (n = 11)groups starting after the third DSS cycle. (E) The Hemoccult test variable of the DAI scores of the Naive (n = 15), DSS (n = 19), DSS+FMD (n = 18), and DSS+WF (n = 11) groups starting after the third DSS cycle. (F) Visual representation of Hemoccult test results for Naive group (0), after 3 cycles of DSS (1), after 4 cycles of DSS (2), and after 4 cycles of DSS and 2 cycles of FMD (3). Blue color indicates presence of blood in stool. (G) Visual representation of colon length from Naive, DSS control diet after 3 cycles (DSS 3 cycles), DSS control diet after four cycles (DSS 4 cycles), DSS control diet after 4 cycles of DSS plus 2 cycles of FMD (DSS+FMD) and DSS control diet plus 2 cycles of water-only fasting (DSS+WF) groups. (H) Colon lengths of the Naive (n = 22), DSS 3 cycles (n = 6), DSS 4 cycles (n = 24), DSS+FMD (n = 23), and DSS+WF (n = 11) groups. (I) Visual representation of small intestine from Naive, DSS 3 cycles, DSS 4 cycles, DSS+FMD, and DSS+WF groups. (J) Small intestine lengths of the Naive (n = 8), DSS (n = 5), DSS+FMD (n = 5), and DSS+WF (n = 8) groups. Data are presented as mean ± SEM; *p < 0.05, **p < 0.01, and ***p < 0.001, one-way or two-way ANOVA, and Bonferroni post test. Related to Figure S1.
Figure 2.
Figure 2.. FMD Cycles Alter Immune Cell Profile to Reduce Intestinal Inflammation
(A) CD4+ T cells (CD3+CD4+) in splenocytes of Naive (n = 11), DSS (n = 11), and DSS+FMD (n = 13) groups. (B) CD45+ leukocytes in splenocytes of Naive (n = 13), DSS (n = 13), and DSS+FMD (n = 15) groups. (C) B Cells (CD45+CD19+) in splenocytes of Naive (n = 13), DSS (n = 15), and DSS+FMD (n = 17) groups. (D) Colonic crypt number changes in Naive (n = 8), DSS (n = 9), and DSS+FMD (n = 10) groups. (E) CD4+ immunofluorescent (IF) staining in the small intestine of Naive, DSS, and DSS+FMD groups. (F) CD4+ cells per small intestinal villi in Naive (n = 8), DSS (n = 10), and DSS+FMD (n = 10) groups. (G) CD8+ IF staining in the small intestine of Naive, DSS, and DSS+FMD groups. (H) CD8+ cells per small intestinal villi in Naive (n = 8), DSS (n = 10), and DSS+FMD (n = 10) groups. (I) CD11b+ IF staining in the colon lamina propria of Naive, DSS, DSS+FMD, and DSS plus 2 cycles of water-only fasting (DSS+WF) groups. (J) Colon lamina propria CD11b+ cells around the crypt base of Naive (n = 6), DSS (n = 8), DSS+FMD (n = 8), and DSS+WF (n = 11) groups. (K) CD4+ and CD8+ IF staining in the colon lamina propria of Naive, DSS, DSS+FMD, and DSS+WF groups. (L) Colon lamina propria CD4+ and CD8+ cells around the crypt base of Naive (n = 7), DSS (CD4+, n = 10; CD8+, n = 9), DSS+FMD (n = 12), and DSS+WF (CD4+, n =8; CD8+, n = 7) groups. Data are presented as mean ± SEM *p < 0.05, **p < 0.01, ***p < 0.001, and ****p < 0.0001, one-way ANOVA, and Bonferroni post test. IF images were taken at 203 magnification. Scale bar represents (E, G, and K) 200 μm and (I) 100 μm. Related to Figure S2.
Figure 3.
Figure 3.. FMD Promotes Intestinal Regeneration
(A) Immunohistochemistry (IHC) for BrdU+ cells in small intestine crypts of Naive, DSS, and DSS+FMD groups. (B) BrdU+ cells per small intestinal crypts in Naive (n = 10), DSS (n = 8), and DSS+FMD (n = 8) groups. (C) Immunofluorescent (IF) staining for Lgr5+ and Sox9+ cells in the small intestine of Naive, DSS, and DSS+FMD groups. (D) Lgr5+ cells per small intestinal crypt in Naive (n = 10), DSS (n = 9), and DSS+FMD (n = 10) groups. (E) Sox9+ cells per small intestinal crypt-villi region in Naive (n = 10), DSS (n = 9), and DSS+FMD (n = 10) groups. (F) Serum IL-17A levels (pg/ml) in Naive (n = 9), DSS (n = 14), and DSS+FMD (n = 16) groups. (G) Colonic supernatant IL-17A levels (pg/ml) in Naive (n = 11), DSS (n = 17), and DSS+FMD (n = 18) groups. (H) Serum TNFα levels (pg/ml) in Naive (n = 13), DSS (n = 20), and DSS+FMD (n = 27) groups. (I) Colonic supernatant TNFα levels (pg/ml) in Naive (n = 12), DSS (n = 24), and DSS+FMD (n = 27) groups. (J) IHC for BrdU+ cells and IF staining for Lgr5+ cells in colonic crypts of Naive, DSS, DSS+FMD, and DSS+WF groups. (K) BrdU+ cells per colonic crypt in Naive (n = 9), DSS (n = 9), DSS+FMD (n = 10), and DSS+WF (n = 11) groups. (L) Lgr5+ cells per colonic crypt in Naive (n = 8), DSS (n = 8), DSS+FMD (n = 6), and DSS+WF (n = 8) groups. Data are presented as mean ± SEM; *p < 0.05, **p < 0.01, ***p < 0.001, and ****p < 0.0001 one-way ANOVA, and Bonferroni post test. IF images were taken at 203 (403 for BrdU+ cells of small intestine) magnification. Scale bar represents (A, C [Lgr5+], and J) 100 μm and (C) 200 μm (Sox9+). Related to Figure S2.
Figure 4.
Figure 4.. FMD Stimulates an Increase in Microbial Strains Known to be Associated with T Cell Regulation and Gut Regeneration
(A) Fecal samples were collected from the Naive, DSS, DSS+FMD, and DSS+WF groups after 4 cycles of DSS and 2 cycles of FMD or 2 cycles of water-only fasting. (B) Plot summarizing the composition of most abundant microbial families in fecal samples from the Naive (n = 5), DSS (n = 5), DSS+FMD (n = 5), and DSS+WF (n = 3) groups. Data were compiled by Second Genome Solutions using the 16S V4 rRNA gene sequencing on the Illumina MiSeq platform. Related to Figures S3 and S7 and Tables S1–S4 and S6.
Figure 5.
Figure 5.. Fecal Transplant from FMD-Treated Mice Improves IBD-Associated Phenotypes, Alters Immune Cell Profile, Stimulates Regeneration in the Colon, and Reduces Levels of Cytokines Associated with IBD Pathogenesis
(A) Experimental scheme outlining the water schedule, duration of diet, and transplant gavage. (B) The modified DAI scores (with body weight loss removed) of the mice that received a control PBS-glycerol solution (Naive FT), mice that received 3 DSS cycles and a cecum-derived solution from mice in the DSS group (DSS FT), 3 that received three DSS cycles and a cecum-derived solution from mice in the DSS+FMD group (DSS+FMD FT), and mice that received three DSS cycles and a gavage treatment of the Lactobacillus strain Lactobacillus rhamanosus (DSS+LGG) groups starting after the third DSS cycle through the 4-day gavage treatment. Pink background represents period of gavage treatment. (C) Colon lengths of the Naive FT, DSS FT, DSS+FMD FT, and DSS+LGG groups. (D) Visual representation of colon length from the Naive FT, DSS FT, DSS+FMD FT, and DSS+LGG groups after 3 cycles of DSS, 4 days of transplant gavage, and a 1-week respite period. (E) CD45+ leukocytes in splenocytes of Naive FT, DSS FT, and DSS+FMD FT groups. (F) B Cells (CD45+CD19+) in splenocytes of Naive FT, DSS FT, and DSS+FMD FT groups. (G) Colonic supernatant IL-5 levels (pg/ml) in Naive FT (n = 7), DSS FT (n = 7), and DSS+FMD FT groups. (H) Colonic supernatant IL-6 levels (pg/ml) in Naive FT (n = 7), DSS FT, and DSS+FMD FT groups. (I) Colonic supernatant IL-27 levels (pg/ml) in Naive FT, DSS FT (n = 7), and DSS+FMD FT (n = 4) groups. (J) IHC for BrdU+ cells and IF staining for Lgr5+ cells in colonic crypts of the DSS FT, DSS+FMD FT, and DSS+LGG groups. (K) BrdU+ and Lgr5+ cells in colonic crypts of the DSS FT, DSS+FMD FT, and DSS+LGG (BrdU+ and Lgr5+, n = 7) groups. (L) IF staining for CD4+, CD8+, and CD11b+ colon lamina propria cells of the DSS FT, DSS+FMD FT, and DSS+LGG groups. (M) Colon lamina propria CD4+, CD8+, and CD11b+ around the colonic crypt base of the DSS FT (CD4+, n = 6; CD8+, n = 6; CD11b+, n = 5), DSS+FMD FT (CD4+,n = 4; CD8+, n = 4; CD11b+, n = 5), and DSS+LGG (n = 7) groups. Data are presented as mean ± SEM; *p < 0.05, **p < 0.01, ***p < 0.001, and ****p < 0.0001, one-way ANOVA, and Bonferroni post test. n = 8/group unless otherwise noted. Scale bar represents (J) 100 μm (BrdU+) and (J [Lgr5+] and L) 50 μm. Related to Figures S4 and S5.
Figure 6.
Figure 6.. White Blood Cell (WBC) and Lymphocyte Counts in Humans and Mice with Systemic Inflammation
(A) WBC count (103/ml) from patients with low CRP (< 1 mg/L; n = 36) or higher CRP (>1 mg/L) prior to dietary intervention (a) (n = 25), at the end of an initial 5-day FMD cycle before resuming normal food intake (b) (n = 25), and approximately 5 days after completing 3 FMD cycles and refeeding (c) (n = 25). (B) Circulating lymphocyte count (103/ml) from patients with low CRP (<1 mg/L; n = 36) or high CRP (>1 mg/L) prior to dietary intervention (a) (n = 25), at the end of an initial 5-day FMD cycle before resuming normal food intake (b) (n = 25), and approximately 5 days after completing 3 FMD cycles and refeeding (c) (n = 25). (C) WBC counts (103/ml) in untreated, naive mice (n = 14) or mice that received 4 cycles of DSS (a) (n = 19), on the last day of 1 cycle of a 4-day FMD between the 3rd and last DSS cycles (b) (n=9), and two days after 4 DSS cycles and 2 FMD cycles (c) (n = 18). (D) Circulating lymphocyte counts (103/ml) in untreated, naive mice (n = 14) or mice that received 4 cycles of DSS (a) (n = 19), on the last day of 1 cycle of a 4-day FMD between the 3rd and last DSS cycles (b) (n = 9), and two days after 4 DSS cycles and 2 FMD cycles (c) (n = 18). Data are presented as mean ± SEM; *p < 0.05, **p < 0.01, and ***p < 0.001, one-way ANOVA, and Bonferroni post test.

Similar articles

Cited by

References

    1. Amcheslavsky A, Song W, Li Q, Nie Y, Bragatto I, Ferrandon D, Perrimon N, and Ip YT (2014). Enteroendocrine cells support intestinal stem-cell-mediated homeostasis in Drosophila. Cell Rep. 9, 32–39. - PMC - PubMed
    1. Andrews C, McLean MH, and Durum SK (2016). Interleukin-27 as a novel therapy for inflammatory bowel disease. Inflamm. Bowel Dis. 22, 2255–2264. - PMC - PubMed
    1. Barker N (2014). Adult intestinal stem cells: critical drivers of epithelial homeostasis and regeneration. Nat. Rev. Mol. Cell Biol. 15, 19–33. - PubMed
    1. Belkaid Y, and Hand TW (2014). Role of the microbiota in immunity and inflammation. Cell 157, 121–141. - PMC - PubMed
    1. Boschetti G, Nancey S, Moussata D, Cotte E, Francois Y, Flourie B, and Kaiserlian D (2016). Enrichment of circulating and mucosal cytotoxic CD8+ T cells is associated with postoperative endoscopic recurrence in patients with Crohn’s disease. J. Crohn’s Colitis 10, 338–345. - PMC - PubMed

Publication types