. 2019 Mar 5;26(10):2805-2817.e9.
doi: 10.1016/j.celrep.2019.02.022.

Trio Haploinsufficiency Causes Neurodevelopmental Disease-Associated Deficits

Affiliations

Trio Haploinsufficiency Causes Neurodevelopmental Disease-Associated Deficits

Sara Marie Katrancha et al. Cell Rep. .

Abstract

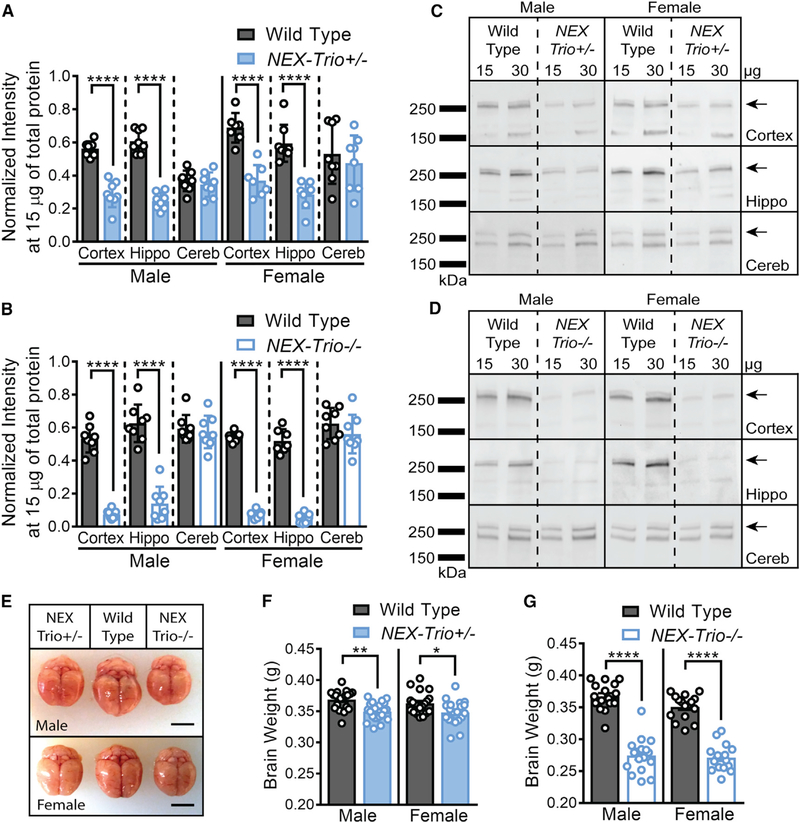
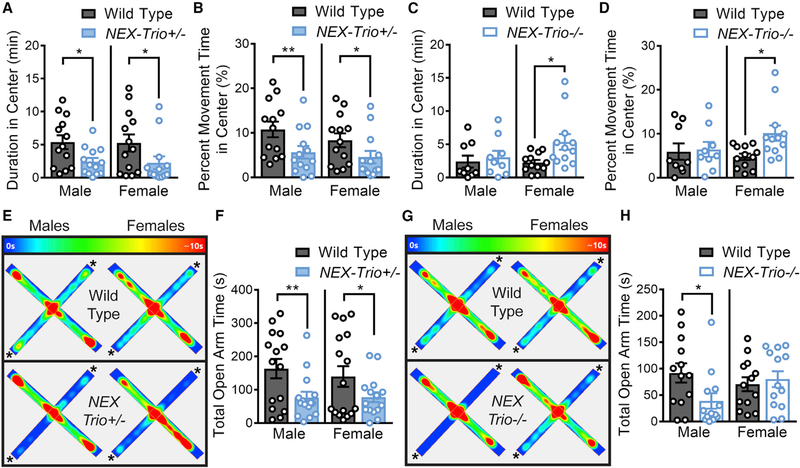
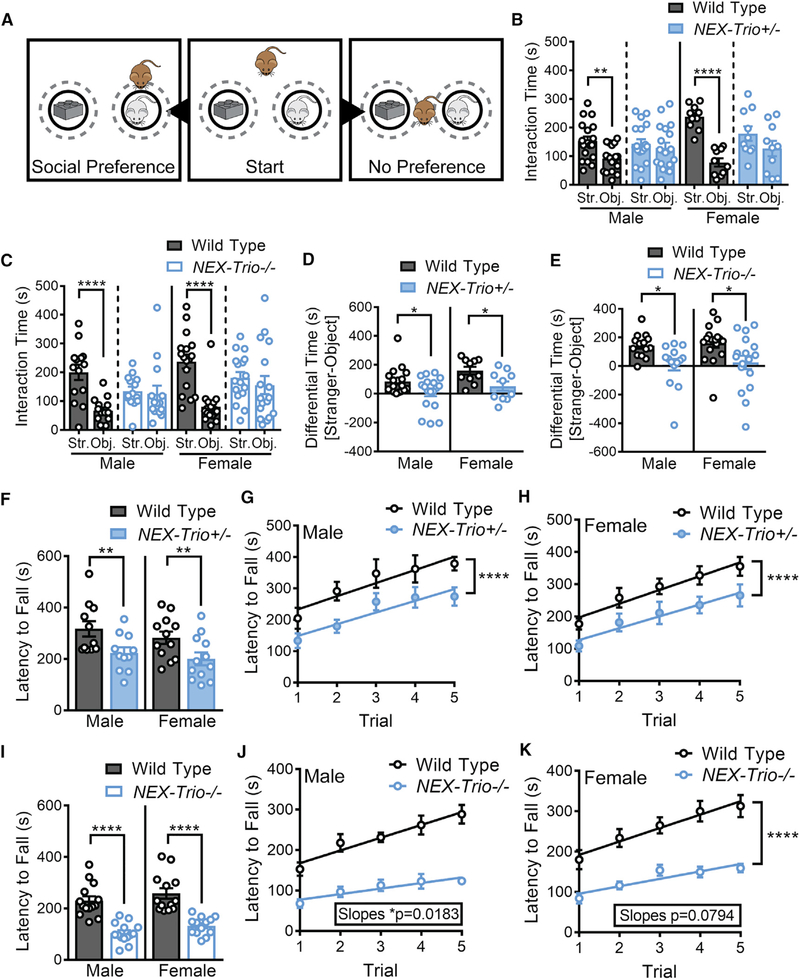
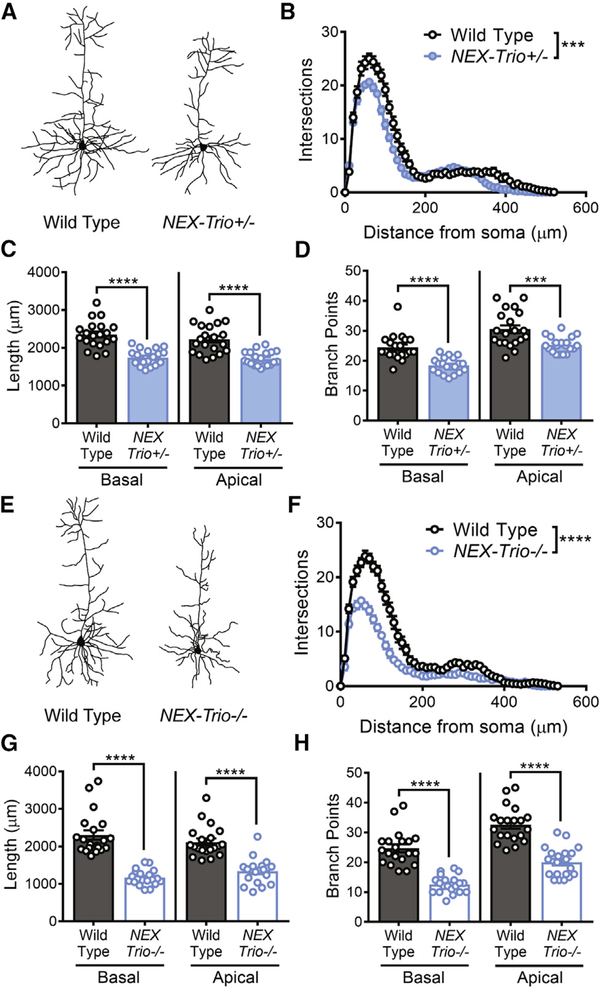
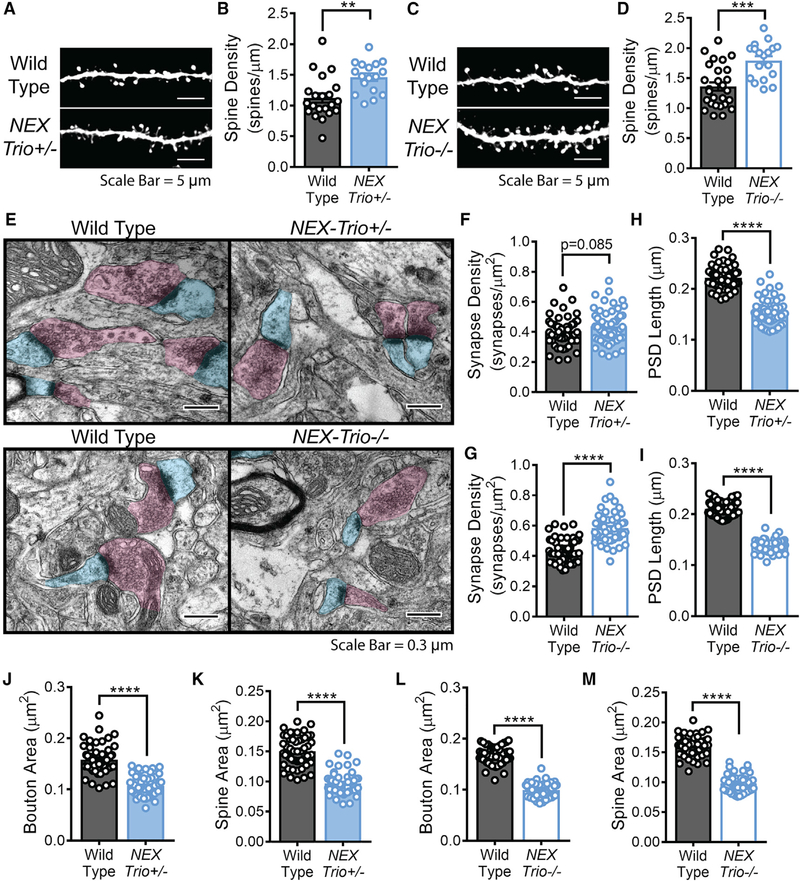
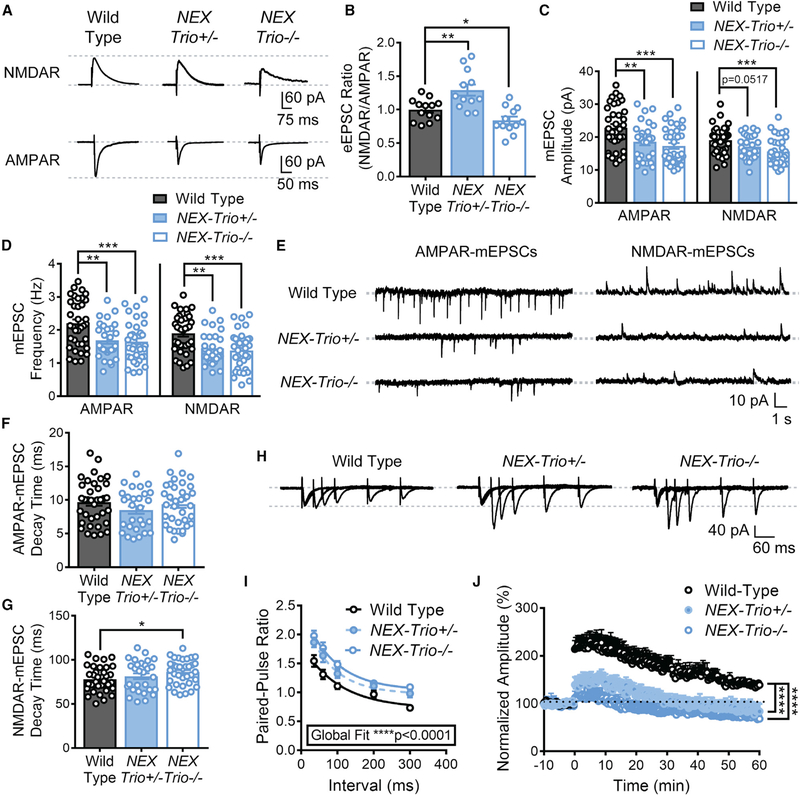
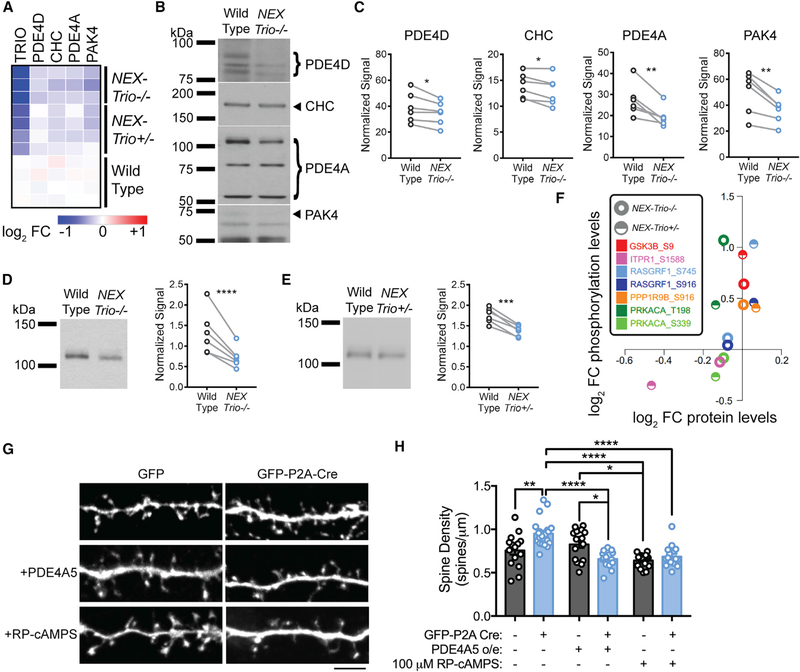
Heterozygous coding mutations in TRIO are associated with neurodevelopmental disorders, including autism, schizophrenia, bipolar disorder, and epilepsy, and impair TRIO's biochemical activities. To model mutant alleles, we ablated one or both Trio alleles from excitatory neurons in the cortex and hippocampus of mice. Trio haploinsufficiency increases anxiety and impairs social preference and motor coordination. Trio loss reduces forebrain size and dendritic arborization but increases dendritic spine densities. Cortical synapses in Trio haploinsufficient mice are small, exhibit pre- and postsynaptic deficits, and cannot undergo long-term potentiation. Similar phenotypes are observed in Trio knockout mice. Overall, Trio haploinsufficiency causes severe disease-relevant deficits in behavior and neuronal structure and function. Interestingly, phosphodiesterase 4A5 (PDE4A5) levels are reduced and protein kinase A (PKA) signaling is increased when TRIO levels are reduced. Elevation of PDE4A5 and drug-based attenuation of PKA signaling rescue Trio haploinsufficiency-related dendritic spine defects, suggesting an avenue for therapeutic intervention for TRIO-related neurodevelopmental disorders.

Keywords: TRIO; anxiety; dendritic spine; haploinsufficiency; long-term potentiation; motor cortex; neurodevelopmental disorder; phosphodiesterase 4A5; social preference; triple functional domain protein.


Conflict of interest statement

DECLARATION OF INTERESTS

The authors declare no competing interests.

Figures

Figure 1.
Figure 1.. NEX–Trio+/− and NEX–Trio−/− Mice Have Smaller Brains and Reduced TRIO Levels in the Cortex and Hippocampus at P42
(A and B) TRIO levels were reduced in the cortex and hippocampus (Hippo) of NEX–Trio+/− (A) and NEX–Trio−/− (B) mice of both sexes at P42. No change was observed in the cerebellum (Cereb). Repeated–measures (RM) two–way ANOVA of genotype and brain region with post hoc Bonferroni multiple comparisons (Bonf MC) test identified differences for each group (n = 7–8 littermate pairs). (C and D) Representative immunoblots are shown for male and female NEX–Trio+/− (C) and NEX–Trio−/− (D) mice in the cortex, hippocampus, and cerebellum. The overlapping 268– and 289–kDa bands, representing TRIO9S/L, were quantified (arrows). Other bands represent nonspecific antibody interactions or other isoforms (Katrancha et al., 2017). (E–G) Total brain weight (E; scale bars represent 0.5 cm) was reduced in NEX–Trio+/− (F) and NEX–Trio−/− (G) mice compared to WT mice of the same sex at P42. RM two–way ANOVA with post hoc Bonf MC test identified differences (n = 16–21 mice per genotype). See also Figure S1. Data are represented as mean ± SEM (*p < 0.05; **p < 0.01; ****p < 0.0001).
Figure 2.
Figure 2.. NEX–Trio+/− Mice Show Increased Anxiety–like Behavior
(A and B) NEX–Trio+/− mice of both sexes spent less time in the center of the open field at an absolute level (A) and when controlling for differences in motility (B) in the open field test (OFT). (C and D) Male NEX–Trio−/− mice showed no change in anxiety, and female NEX–Trio−/− mice showed decreased anxiety relative to WT littermates at an absolute level (C) and when controlling for differences in motility (D) in the OFT. (E and G) Representative heatmaps show the time (0 s in purple; >10 s in red) that the mouse spent in each location in the elevated plus maze for NEX–Trio+/− (E) and NEX–Trio−/− (G) mice compared to WT littermates. The asterisks (*) indicate the open arms. (F and H) Male and female NEX–Trio+/− (F) and male NEX–Trio−/− (H) mice spent less time in the open arms of the elevated plus maze than WT littermates. Female NEX–Trio−/− mice (H) showed no change in open arm time. RM two–way ANOVA with post hoc Bonf MC test identified differences (n = 8–16 littermate pairs). See also Figures S2, S3, S4, and S5. Data are represented as mean ± SEM (*p < 0.05; **p < 0.01).
Figure 3.
Figure 3.. NEX–Trio+/− and NEX–Trio−/− Mice Do Not Show a Preference for Social Interaction and Show Decreased Motor Coordination
(A) (Middle) In the social preference task, a test mouse (brown) is placed in an open field with a male stranger mouse (gray) and an object (Duplo blocks, similar color and size as the stranger mouse). (Left) Test mice that display social preference spend more time with the stranger mouse relative to the object. (Right) Test mice that display no preference spend equal time with the stranger mouse and object. Target zones are designated by the gray dotted circles. (B and C) NEX–Trio+/− (B) and NEX–Trio−/− (C) mice did not show preference for the stranger mouse (Str.) relative to the object (Obj.), whereas WT mice displayed normal social preference. A linear regression with post hoc Bonf MC test identified differences (n = 10–18 littermate pairs). (D and E) The difference in occupancy time between the social and nonsocial zones showed that NEX–Trio+/− (D) and NEX–Trio−/− (E) mice had reduced preference for the social zone compared to sex–matched WT littermates. RM two–way ANOVA with post hoc Bonf MC test identified differences (n = 10–18 littermate pairs). (F and I) NEX–Trio+/− (F) and NEX–Trio−/− (I) mice of both sexes had a shorter latency to fall off of the accelerating rotarod than WT littermates. RM two–way ANOVA with post hoc Bonf MC test identified differences (n = 11–14 littermate pairs). (G and H) Male (G) and female (H) NEX–Trio+/− mice had a shorter latency to fall off of the accelerating rotarod than WT littermates in every trial (difference in intercepts), but all groups learned at a rate of 40 s per trial (no difference in slopes). (J and K) Male (J) and female (K) NEX–Trio−/− mice showed impaired motor learning (significant or suggestive difference in slopes) compared to WT littermates. Male and female WT mice learned at a rate of 32 and 33 s per trial, respectively; male and female NEX–Trio−/− mice learned at a rate of 14 and 18 s per trial, respectively. Linear regressions with post hoc test for differences between slopes and changes in intercepts identified differences (n = 11–14 littermate pairs). See also Figures S2, S3, S4, and S5. Data are represented as mean ± SEM (*p < 0.05; **p < 0.01; ****p < 0.0001).
Figure 4.
Figure 4.. Dendritic Arborization Is Reduced in the Motor Cortex of NEX–Trio+/− and NEX–Trio−/− Mice
(A and E) Representative dendritic arbor reconstructions are shown for layer 5 pyramidal neurons (L5 PNs) in NEX–Trio+/− (A) and NEX–Trio−/− (E) mice. (B and F) Sholl analysis revealed decreased dendritic arborization on L5 PNs in NEX–Trio+/− (B) and NEX–Trio−/− (F) mice relative to WT controls; the phenotype was more severe in NEX–Trio−/− mice (F). RM two–way ANOVA with post hoc Bonf MC test identified differences (n = 20 neurons from 4 mice per genotype). (C and G) Apical and basal dendrite length were reduced on L5 PNs in NEX–Trio+/− (C) and NEX–Trio−/− (G) mice relative to WT controls. (D and H) The numbers of apical and basal branch points were reduced on L5 PNs in NEX–Trio+/− (D) and NEX–Trio−/− (H) mice relative to WT controls. Unpaired t tests identified differences between groups (n = 20 neurons from 4 mice per genotype). See also Figure S6. Data are represented as mean ± SEM (***p < 0.001; ****p < 0.0001).
Figure 5.
Figure 5.. NEX–Trio+/− and NEX–Trio−/− Mice Have Increased Dendritic Spine Density and Smaller Synapses in the Motor Cortex
(A and C) Representative basal dendrite segments from L5 PNs in the motor cortex of NEX–Trio+/− (A) and NEX–Trio−/− (C) mice with WT controls. Scale bars represent 5 mm. (B and D) Dendritic spine density was increased on L5 PNs in the motor cortex of NEX–Trio+/− (B) and NEX–Trio−/− (D) mice relative to WT controls. A linear regression with post hoc Bonf MC test identified differences (n = 17–27 dendrite segments from R3 mice per group). (E) Representative electron micrographs from L5 motor cortex of NEX–Trio+/−, NEX–Trio−/−, and WT mice. Scale bars represent 0.3 μm. (F and G) Cortical synapse density (synapses per mm ) trended (p = 0.085) toward an increase in NEX–Trio+/− mice (F) and was increased in NEX–Trio−/− mice (G). (H and I) PSD length was decreased in L5 motor cortex of both NEX–Trio+/− (H) and NEX–Trio−/− (I) mice. (J and L) Presynaptic bouton area was decreased in L5 motor cortex of both NEX–Trio+/− (J) and NEX–Trio−/− (L) mice. (K and M) Dendritic spine area was decreased in both NEX–Trio+/− (K) and NEX–Trio−/− (M) mice. For (F)–(M), a linear regression with post hoc Bonf MC test identified differences (n = 54 fields of view [55 μm2 each] from 3 mice per group). See also Figure S6. Data are represented as mean ± SEM (**p < 0.01; ***p < 0.001; ****p < 0.0001).
Figure 6.
Figure 6.. NEX–Trio+/− and NEX–Trio−/− Mice Exhibit Deficits in Pre– and Postsynaptic Function and Synaptic Plasticity
(A) Representative traces of NMDAR– and AMPAR–eEPSCs from NEX–Trio+/−, NEX–Trio−/−, and WT L5 PNs in the motor cortex (M1). (B) The NMDAR/AMPAR eEPSC ratio was increased in NEX–Trio+/− mice and decreased in NEX–Trio−/− mice relative to WT controls. Unpaired t tests identified differences between groups (n = 12–14 neurons from 4 mice per group). (C and D) NEX–Trio+/− and NEX–Trio−/− mice had decreased AMPAR–mEPSC amplitude (C, left) and frequency (D, left). NEX–Trio−/− mice also had decreased NMDAR–mEPSC amplitude (C, right) and frequency (D, right). NEX–Trio+/− mice trended toward decreased NMDAR–mEPSC amplitude (C, right) and had decreased NMDAR–mEPSC frequency (D, right). (E) Representative traces of AMPAR– and NMDAR–mEPSCs from WT, NEX–Trio+/−, and NEX–Trio−/− L5 PNs in the motor cortex (M1). (F and G) NEX–Trio+/− mice showed no difference in AMPAR– (F) or NMDAR–mEPSC (G) decay time. NEX–Trio−/− mice showed no difference in AMPAR–mEPSC decay time (F) but increased NMDAR–mEPSC decay time (G). To consistently analyze NEX–Trio+/− and NEX–Trio−/− mice independently, unpaired t tests identified differences between groups (n = 28–36 neurons from 5–7 mice per group). (H) Representative traces of eEPSCs from WT, NEX–Trio+/, and NEX–Trio−/− L5 PNs in the motor cortex (M1) evoked by paired–pulse stimulation of M1 layer 2/3. (I) An increase in the paired–pulse ratio was observed in NEX–Trio+/− and NEX–Trio−/− mice, suggesting a deficit in presynaptic release probability. A one–phase decay global fit analysis identified differences between groups. Post hoc Bonf MC test indicated that NEX–Trio+/− was significantly different from WT at35* and 60** ms (p = 0.07 at 300 ms), and NEX–Trio+/− was significantly different from WT at 35****, 60****, 100***, and 300** ms (p = 0.18 at 200 ms; n = 20–26 neurons from 5–7 mice per group). (J) NEX–Trio+/− and NEX–Trio−/− mice had impaired LTP in the motor cortex, showing only slight induction and no potentiation compared to WT controls. LTP was induced at 0 min. RM two–way ANOVA with post hoc Bonf MC test identified differences (n = 9–11 neurons from ≥6 mice per group). See also Figures S6 and S7. Data are represented as mean ± SEM (*p < 0.05; **p < 0.01; ***p < 0.001; ****p < 0.0001).
Figure 7.
Figure 7.. NEX–Trio+/− and NEX–Trio−/− Mice Have Decreased PDE4A5 Levels and Increased PKA Signaling, and PDE4A5 Overexpression and Drug–Based Attenuation of PKA Signaling Rescue Trio–Induced Increases in Dendritic Spine Density
(A) Heatmap illustrating the log2 fold change (FC) of select proteins compared to WT quantified by mass–spectrometry–based proteomics. All selected proteins were reduced in the motor cortex of NEX–Trio−/− and NEX–Trio+/− mice compared to WT. (B) Representative immunoblots for selected proteins in the cortex are shown for male NEX–Trio−/− and WT mice (P42); bands of interest are marketed by arrows (single band) or brackets (multiple bands). (C) PDE4D, CHC, PDE4A, and PAK4 protein levels were reduced in the cortex of NEX–Trio−/− mice relative to WT littermates. (D and E) PDE4A5 protein levels were reduced in the cortex of NEX–Trio−/− (D) and NEX–Trio+/− (E) mice. Representative immunoblots are shown. Ratio paired t test identified differences (n = 6 littermate pairs). (F) Scatterplot representing the average log2 FC compared to WT for PKA substrates detected in the kinase–substrate pair enrichment analysis. The log2 FCs at phosphorylation sites are plotted against the log2 FCs of the respective protein levels. Each color represents a distinct PKA substrate phosphorylation site; half circles represent NEX–Trio+/− data, and open circles represent NEX–Trio−/− data. (G) Representative immunofluorescence images of Trio+/flox neurons transfected with just GFP (WT) or GFP–P2A–Cre (Cre–Trio+/−; top) for 6 days. A subset of neurons was treated with PDE4A5 overexpression (middle) or 100 μM Rp–cAMPS (bottom). Scale bar represents 5 mm. (H) Dendritic spine density was increased in Cre–positive Trio+/flox neurons, and this was rescued with overexpression (o/e) of PDE4A5 for 6 days or treatment with 100 mM Rp–cAMPS for 3 days. Unpaired t tests identified differences between groups (n = 15–21 dendrite segments from R3 cells per group). See also Figure S7. Data are represented as mean ± SEM (*p < 0.05; **p < 0.01; ***p < 0.001; ****p < 0.0001).

References

    1. Angoa–Pérez M, Kane MJ, Briggs DI, Francescutti DM, and Kuhn DM (2013). Marble burying and nestlet shredding as tests of repetitive, compulsive–like behaviors in mice. J. Vis. Exp, 50978. - PMC - PubMed
    1. Awasaki T, Saito M, Sone M, Suzuki E, Sakai R, Ito K, and Hama C (2000). The Drosophila Trio plays an essential role in patterning of axons by regulating their directional extension. Neuron 26, 119–131. - PubMed
    1. Ba W, Yan Y, Reijnders MRF, Schuurs–Hoeijmakers JHM, Feenstra I, Bongers EMHF, Bosch DGM, De Leeuw N, Pfundt R, Gilissen C, et al. (2016). TRIO loss of function is associated with mild intellectual disability and affects dendritic branching and synapse function. Hum. Mol. Genet 25, 892–902. - PMC - PubMed
    1. Baldan Ramsey LC, Xu M, Wood N, and Pittenger C (2011). Lesions of the dorsomedial striatum disrupt prepulse inhibition. Neuroscience 180, 222–228. - PMC - PubMed
    1. Ball RW, Warren–Paquin M, Tsurudome K, Liao EH, Elazzouzi F, Cavanagh C, An BS, Wang TT, White JH, and Haghighi AP (2010). Retrograde BMP signaling controls synaptic growth at the NMJ by regulating Trio expression in motor neurons. Neuron 66, 536–549. - PubMed

Publication types

Substances

LinkOut - more resources