. 2019 Mar 5;26(10):2833-2846.e3.
doi: 10.1016/j.celrep.2019.02.020.

Spatial and Spectral Mapping and Decomposition of Neural Dynamics and Organization of the Mouse Brain with Multispectral Optoacoustic Tomography

Affiliations

Spatial and Spectral Mapping and Decomposition of Neural Dynamics and Organization of the Mouse Brain with Multispectral Optoacoustic Tomography

Ivan Olefir et al. Cell Rep. .

Abstract

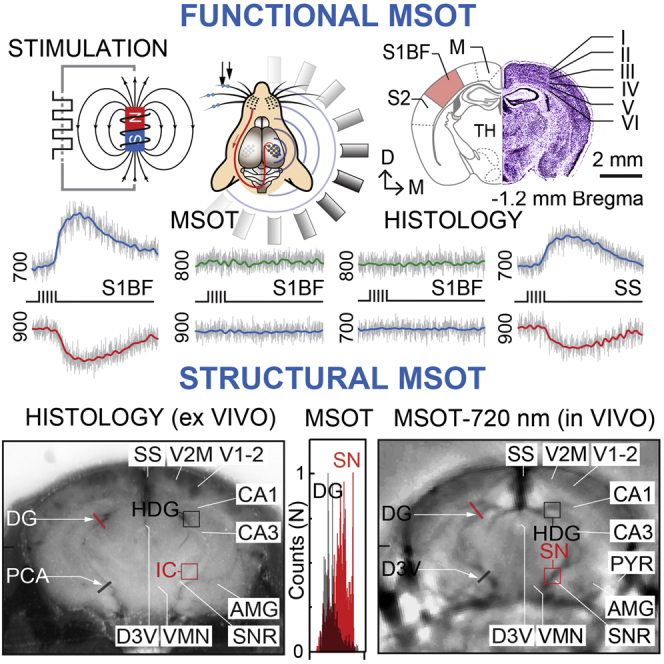
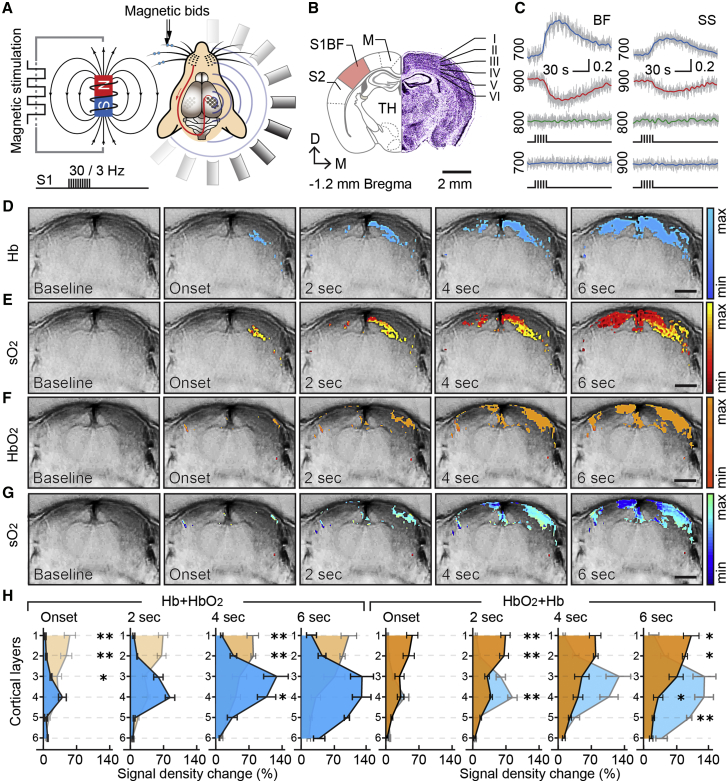
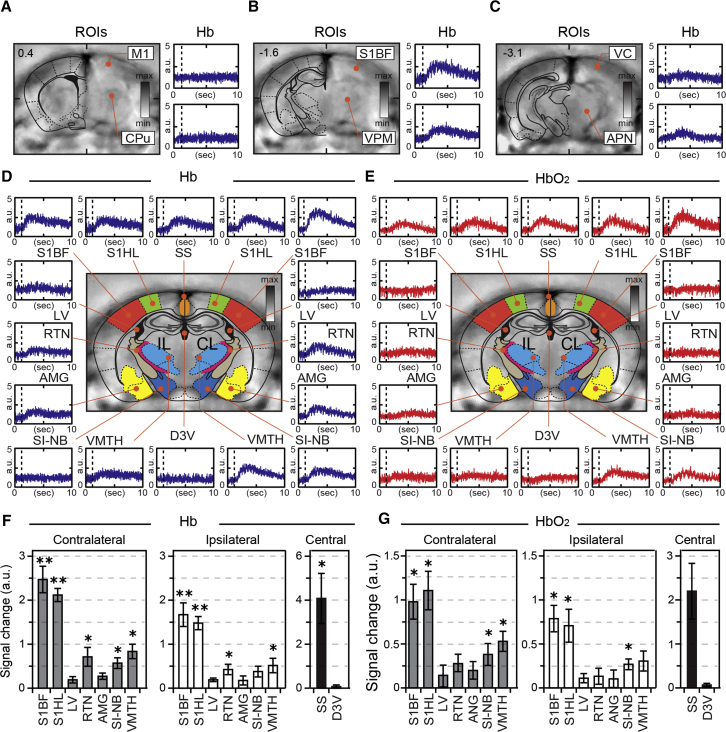
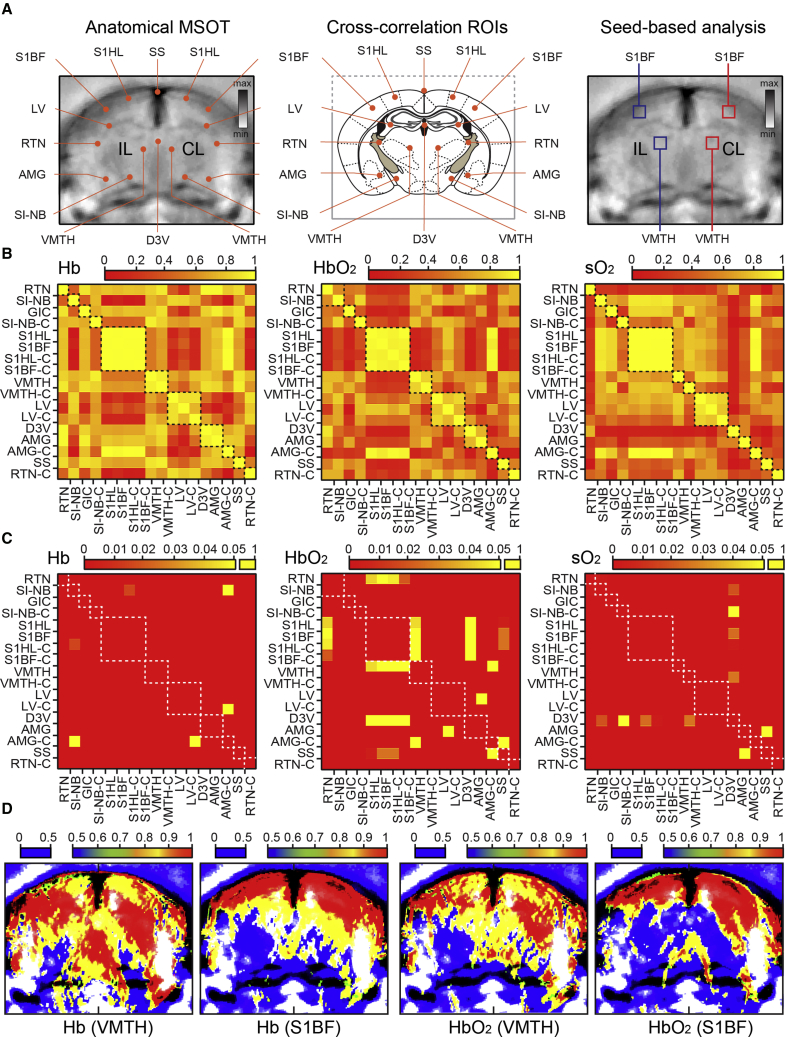
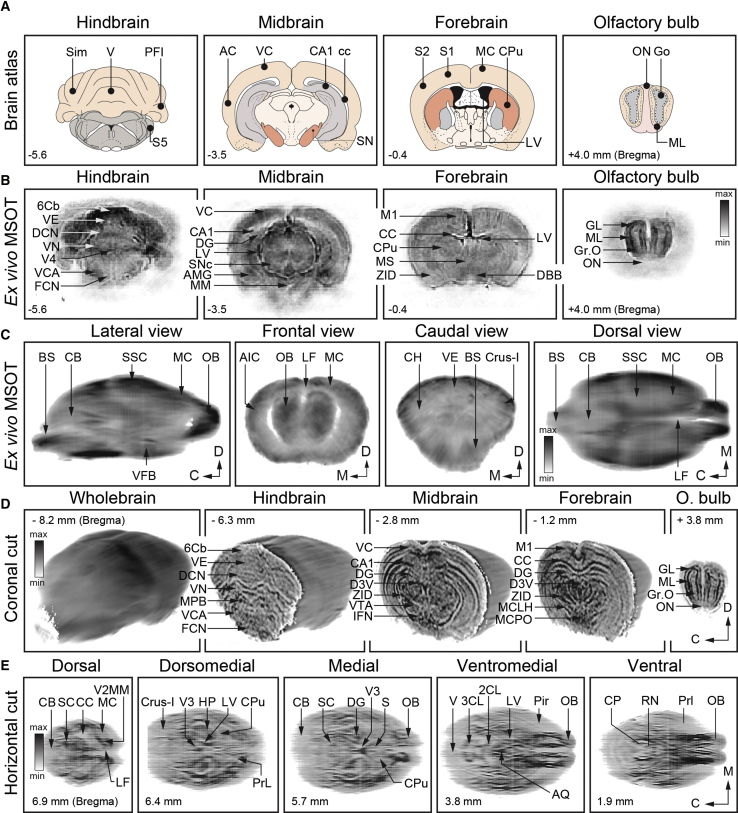
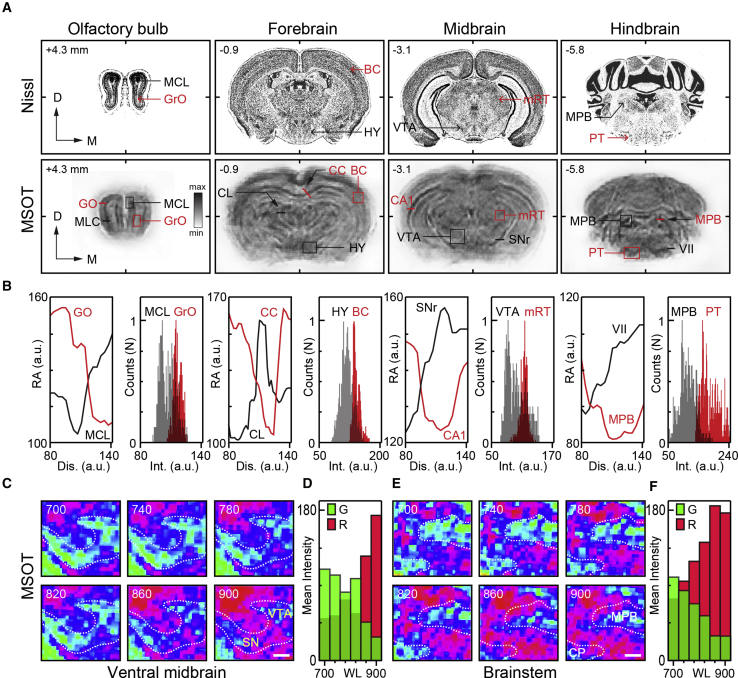
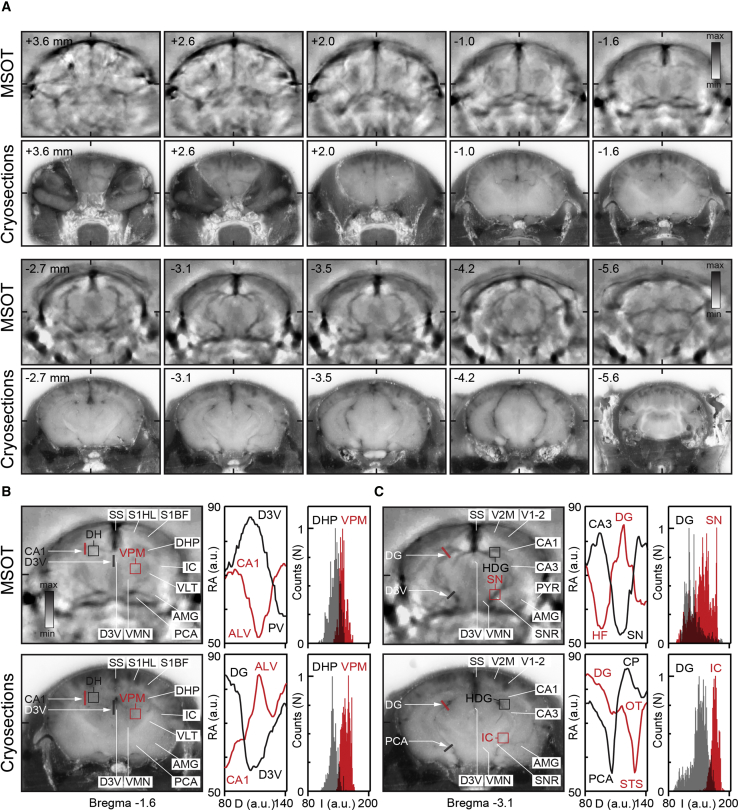
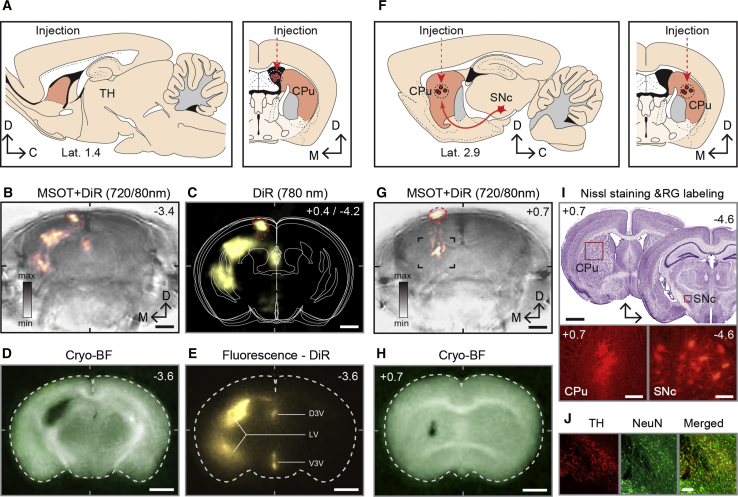
In traditional optical imaging, limited light penetration constrains high-resolution interrogation to tissue surfaces. Optoacoustic imaging combines the superb contrast of optical imaging with deep penetration of ultrasound, enabling a range of new applications. We used multispectral optoacoustic tomography (MSOT) for functional and structural neuroimaging in mice at resolution, depth, and specificity unattainable by other neuroimaging modalities. Based on multispectral readouts, we computed hemoglobin gradient and oxygen saturation changes related to processing of somatosensory signals in different structures along the entire subcortical-cortical axis. Using temporal correlation analysis and seed-based maps, we reveal the connectivity between cortical, thalamic, and sub-thalamic formations. With the same modality, high-resolution structural tomography of intact mouse brain was achieved based on endogenous contrasts, demonstrating near-perfect matches with anatomical features revealed by histology. These results extend the limits of noninvasive observations beyond the reach of standard high-resolution neuroimaging, verifying the suitability of MSOT for small-animal studies.

Keywords: hemodynamic response; label-free interrogation; near-infrared neuroimaging; photoacoustic imaging; temporal coherence; whole-brain tomography.


Figures

None
Graphical abstract
Figure 1
Figure 1
Functional MSOT of Whisker-Induced Response in the Somatosensory Barrel Cortex (A) Schematic of the experimental design of whisker stimulation with pull-push magnet and brain imaging with MSOT. (B) Representation of mouse brain cross-section containing anatomical references such as somatosensory barrel cortex (S1BF), S2 somatosensory field (S2), and motor cortex (M) (left), with Nissl-stained brain slice of corresponding plane showing cortical layers of the S1BF (right). (C) Typical traces of HbO2 (900 nm), Hb (700 nm), and isosbestic (800 nm) signal from experimental group (top), and HbO2 and Hb signals from negative control group verifying that changes in Hb and HbO2 signals are specific to activation of whisker inputs. (D–G) Consecutive time series of anatomical brain images overlaid with Hb (D), HbO2 (F), and SO2 (E and G) maps before (baseline) and after (2-s increments) whisker stimulation. Activation maps presented in different colors show pixel-wise changes in the intensity of MSOT signal related to the stimulation of whisker inputs, with signal intensity changes presented in arbitrary units. (H) Distribution and dynamics of the whisker evoked Hb, HbO2, and SO2 signal density across different layers of S1BF of the somatosensory cortex. Graphs present means and SEM of signal density changes in different cortical layers from six independent trials with their comparison (p < 0.05; ∗∗p < 0.005; unpaired t test).
Figure 2
Figure 2
Location Specificity of Hemodynamic Changes across Mouse Brains Induced by Whisker Inputs (A–C) Consecutive anatomical MSOT images of mouse brain overlaid with schematic maps of corresponding planes (A, B, and C; left part) with representative recordings of Hb signal from marked regions of interest (ROIs) (A, B, and C; right). Anatomical references: M1, motor cortex; CPu, caudate putamen; S1BF, somatosensory cortex barrel field; VPM, ventral posterior nucleus; VC, visual cortex; APN, anterior pretectal nucleus. Note that Hb changes are specific to the anatomical plane containing S1BF. (D and E) Typical recordings of Hb (D) and HbO2 (E) signal from selected ROIs of the mouse brain. IL and CL, ipsilateral and contralateral to the stimulation side. RTN, reticular thalamic nucleus; SI-NB, substantia innominate nucleus basalis; S1HL, primary somatosensory, hindlimb; S1BF, primary somatosensory, barrel field; VMTH, ventromedial thalamic nucleus; LV, lateral ventricle; D3V, third dorsal ventricle; AMG, amygdala; SS, sagittal sinus; AMG, amygdala. For illustration purposes, all functional readouts have been inverted to represent more clearly the relative change. (F and G) Summary graphs illustrating the mean values with SEM of Hb (F) and HbO2 (G) signal changes (i.e., peak amplitude) in different brain compartments pulled from six independent trials with their comparison (p < 0.05; ∗∗p < 0.005; unpaired t test).
Figure 3
Figure 3
Temporal Coherence of Hemodynamic Changes Induced by Stimulation of Whisker Inputs in Mouse Brain (A) Structural MSOT images (left and right panels) with marked ROIs used in cross-correlation analysis (left) and in seed-based correlation mapping the functional connectome (right), along with schematized map of corresponding brain plane with anatomical references (middle). For abbreviations, see Figure 2 legend. (B and C) Correlation matrix of Hb, HbO2, and SO2 illustrating the degree of temporal coherence of hemodynamic response induced by whisker inputs (B) and corresponding graph of the distribution of p values of same ROIs (C). (D) Seed-based correlation maps of the same brain illustrating areas with temporally coherent changes in Hb and HbO2 signals (i.e., co-activation) in response to whisker inputs. Whisker input driven changes of the hemodynamic signals in the contralateral somatosensory cortex barrel field (S1BF) and contralateral ventro-medial thalamic nucleus (VMTH) have been used as seeds for current coherence maps, with the degree of correlation presented in the color bars.
Figure 4
Figure 4
Structural Brain Imaging with MSOT Ex Vivo (A and B) Schematized anatomy of a mouse brain at four different coronal planes (Bregma coordinates underneath) (A) with corresponding MSOT cross-sections of non-perfused ex vivo brain (B). Note exquisite structural details revealed at all planes and depths throughout entire brain cross-sections. ON, olfactory nerve; Go, granule cells of olfactory bulb; ML, mitral cell layer; S1 and S2, somatosensory cortex 1 and 2; MC, motor cortex; CPu, caudate putamen; LV, lateral ventricle; AC and VC, auditory and visual cortices; CA1, hippocampal CA1 area; cc, corpus callosum; SN, substantia nigra; Sim, simple lobule; V, vermis; PFI, para-floccules; S5, trigeminal nucleus; Gr.O, granule cells of olfactory bulb; GL, granule cell layer; MS, medal septum; DBB, diagonal band Broca; DG, dentate gyrus; LV, lateral ventricle; SNc, substantia nigra pars compacta; AMG amygdala; MM, medial mammillary nucleus; 6Cb, cerebellar lobule 6; VE, vermis; DCN, deep cerebellar nucleus; VN, vestibular nucleus; V4, fourth ventricle; VCN, ventral cochlear nucleus; FNC, facial nucleus. (C) Lateral, frontal, caudal, and dorsal views of reconstructed mouse brain, from left to right. Maximum intensity projections. C, caudal; D, dorsal; M, medial; BS, brainstem; CB, cerebellum; SSC, somatosensory cortex; MC, motor cortex; OB, olfactory bulb; AIC, agranular insular cortex; LF, longitudinal fissure; CH, cerebellar hemisphere; VE, vermis; Crus-1, cerebellar crus 1. (D) MSOT of the whole brain and series of cross-sections at four different planes. 6Cb, sixth cerebellar lobule; VE, vermis; DCN, deep cerebellar nucleus; VN, vestibular nuclear complex; MPB, medial parabrachial nucleus; VCA, ventral cochlear nucleus; FCN, facial nucleus; VC, visual cortex; CA1, CA1 area; DG, dentate gyrus; D3V, dorsal 3 ventricle; ZID, zona incerta dorsalis; VTA, ventral tegmental area; IFN, interfascicular nucleus; M1, motor cortex; CC, corpus callosum; MCLH, magnocellular lateral hypothalamus; MCPO, magnocellular preoptic nucleus; GL, glomerular layer; ML, mitral cell layer; Gr.O, granule cell layer; ON, olfactory nerve. (E) Horizontal MSOT sections of the mouse brain at five (D, dorsal; DM, dorso-medial; M, medial; MV, medio-ventral; and V, ventral) planes with reference to interaural plane (distance in millimeters). CB, cerebellum; SC, superior colliculus; CC, corpus callosum; MC, motor cortex; V2MM, secondary visual cortex; LF, longitudinal fissure; V3, ventricle 3; HP, hippocampus; LV, lateral ventricle; CPu, caudate putamen; PrL, pre-limbic cortex; DG, dentate gyrus; S, septum; OB, olfactory bulb; V, vermis; 3CL, 3 cerebellar lobule; 2CL, 2 cerebellar lobule; AQ, aqueduct cerebral; Pir, piriform cortex; CP, cerebellar peduncle; RN, reticular nucleus; Prl, prelimbic cortex.
Figure 5
Figure 5
Morphometry and Correlation of Anatomical Features Revealed by MSOT with Those of Histochemistry (A) Typical Nissl-stained mouse brain sections at consecutive planes (top) with corresponding MSOT images (bottom) (millimeters from bregma) (modified with permission from http://atlas.brain-map.org/atlas). Note close resemblance between major features of two sets of images. MCL, mitral cell layer; GrO, granule cell layer; BC, barrel cortex; HY, hypothalamus; VTA, ventral tegmental area; mRT, mesencephalic reticular thalamic nucleus; MPB, medial parabrachial nucleus; PT, pyramidal tract; CL, central thalamic nucleus; CC, corpus callosum; SN, substantia nigra; CA1, hippocampal CA1 region; VII, facial nucleus. (B) Intensity profile graphs and absorption density distribution histograms of selected structures marked in (A) verifying the feasibility of semiquantitative morphometry using MSOT scans of ex vivo mouse brain. (C and D) MSOT images of the VTA and SNc area of the midbrain taken at different wavelengths (C) with representation of spectral changes attributable to melanin-rich structures (blue) in the region (D). (C) Scale bar: 100 μm. (E and F) Spectral map of the MPB and cerebellar peduncle (CP) region of medulla (E) with representation of spectral changes (F) presumably due to presence of melanin in the region (between 700 and 900 nm). Scale bar: 100 μm. Note wavelength-dependent changes in the spectral content of MSOT images over the analyzed range (ratio of red and green pixels in C and E plotted in D and F).
Figure 6
Figure 6
Label-Free Anatomical MSOT of Intact Mouse Brain In Vivo (A) Series of consecutive MSOT cross-sections acquired in vivo (MSOT, average of 10 frames) and corresponding low-power images of the same frozen mouse brain captured on the cryo-slicer (cryosections). Note numerous exquisite structural details revealed by MSOT at all anatomical planes and depths throughout the entire brain cross-sections, with their nearly perfect correspondence with those captured using a high-resolution digital camera. (B and C) Anatomical images and intensity profile graphs with absorption density distribution analysis of selected anatomical structures (bregma –1.6 mm, B, and bregma –3.1 mm, C) (red and black lines and boxed areas) demonstrating the utility of label-free MSOT for semiquantitative morphometry and neuroanatomical measurements in vivo in intact mice. SS, sagittal sinus; S1HL, somatosensory cortex hindlimb area; S1BF, somatosensory cortex barrel field; DHP, dorsal hippocampus; CA1, hippocampal CA1 area; VPM, ventral posterior-medial thalamic nucleus; IC, internal capsule; VLT, ventrolateral thalamic nucleus; VMN, ventromedial thalamic nucleus; AMG, amygdala; D3V, third ventricle; PCA, posterior central artery; PV, periventricular nucleus; ALV, stratum alveus; SN, substantia nigra; CP, cerebral peduncle; OT, optical tract; HF, hippocampal fissure; STS, sagittal transverse sinus; DG, dentate gyrus. Scale bar: 100 μm.
Figure 7
Figure 7
Enhancing Structural Brain Imaging with MSOT Using Exogenous Contrasts (A–E) Visualizing mouse ventricular system with MSOT using NIR Di-R tracer. (A) A schematic of the sagittal and coronal brain sections showing the site of intraventricular injection of a tracer. Anatomical references: CPu, caudate putamen; TH, thalamus. (B and C) MSOT cross-section of the mouse brain overlaid with unmixed and reconstructed images of the cerebral ventricles (B) with corresponding simplified schematics of brain cross-sections between −2.6 and −4.0 mm of bregma (C). (D and E) Histological verification of the Di-R injection site (D) and ventricular labeling using cryo-slicing and fluorescence light microscopy (E). Anatomical references: D3V, dorsal 3 ventricle; LV, lateral ventricle; V3V ventral 3 ventricle. (F) A schematic of the sagittal and coronal brain sections with the site of NIR Di-R infusion revealed in dorsal striatum for retrograde labeling of SN dopaminergic projection neurons. (G and H) Anatomical MSOT cross-section of the mouse brain overlaid with unmixed and reconstructed images of tracer injection plane (G) with histological verification (H). (I) Validation of the injection sites and the location of SN shown in Nissl-stained brain sections and in fluorescence microscopic images of the injections site in CPu and retrogradely labeled neurons in the SNc. (J) Immunofluorescence verification of dopaminergic neurons using anti-tyrosinase antibody and neuron-specific marker NeuN.

Similar articles

Cited by

References

    1. Alonso B.d.C., Lowe A.S., Dear J.P., Lee K.C., Williams S.C., Finnerty G.T. Sensory inputs from whisking movements modify cortical whisker maps visualized with functional magnetic resonance imaging. Cereb. Cortex. 2008;18:1314–1325. - PMC - PubMed
    1. Barden H., Levine S. Histochemical observations on rodent brain melanin. Brain Res. Bull. 1983;10:847–851. - PubMed
    1. Beard P. Biomedical photoacoustic imaging. Interface Focus. 2011;1:602–631. - PMC - PubMed
    1. Berger T., Borgdorff A., Crochet S., Neubauer F.B., Lefort S., Fauvet B., Ferezou I., Carleton A., Lüscher H.R., Petersen C.C. Combined voltage and calcium epifluorescence imaging in vitro and in vivo reveals subthreshold and suprathreshold dynamics of mouse barrel cortex. J. Neurophysiol. 2007;97:3751–3762. - PubMed
    1. Boas D.A., Dale A.M., Franceschini M.A. Diffuse optical imaging of brain activation: approaches to optimizing image sensitivity, resolution, and accuracy. Neuroimage. 2004;23(Suppl 1):S275–S288. - PubMed

Publication types

Supplementary concepts

LinkOut - more resources