Multicenter Study
. 2019 May 1:191:537-548.
doi: 10.1016/j.neuroimage.2019.02.059. Epub 2019 Mar 3.

Big GABA II: Water-referenced edited MR spectroscopy at 25 research sites

Mark Mikkelsen  1 Daniel L Rimbault  2 Peter B Barker  3 Pallab K Bhattacharyya  4 Maiken K Brix  5 Pieter F Buur  6 Kim M Cecil  7 Kimberly L Chan  8 David Y-T Chen  9 Alexander R Craven  10 Koen Cuypers  11 Michael Dacko  12 Niall W Duncan  13 Ulrike Dydak  14 David A Edmondson  14 Gabriele Ende  15 Lars Ersland  16 Megan A Forbes  17 Fei Gao  18 Ian Greenhouse  19 Ashley D Harris  20 Naying He  21 Stefanie Heba  22 Nigel Hoggard  23 Tun-Wei Hsu  24 Jacobus F A Jansen  25 Alayar Kangarlu  26 Thomas Lange  12 R Marc Lebel  27 Yan Li  21 Chien-Yuan E Lin  28 Jy-Kang Liou  24 Jiing-Feng Lirng  24 Feng Liu  29 Joanna R Long  30 Ruoyun Ma  31 Celine Maes  32 Marta Moreno-Ortega  33 Scott O Murray  34 Sean Noah  35 Ralph Noeske  36 Michael D Noseworthy  37 Georg Oeltzschner  3 Eric C Porges  17 James J Prisciandaro  38 Nicolaas A J Puts  3 Timothy P L Roberts  39 Markus Sack  15 Napapon Sailasuta  40 Muhammad G Saleh  3 Michael-Paul Schallmo  41 Nicholas Simard  42 Diederick Stoffers  6 Stephan P Swinnen  43 Martin Tegenthoff  22 Peter Truong  44 Guangbin Wang  18 Iain D Wilkinson  23 Hans-Jörg Wittsack  45 Adam J Woods  17 Hongmin Xu  21 Fuhua Yan  21 Chencheng Zhang  46 Vadim Zipunnikov  47 Helge J Zöllner  48 Richard A E Edden  3
Affiliations
Multicenter Study

Big GABA II: Water-referenced edited MR spectroscopy at 25 research sites

Mark Mikkelsen et al. Neuroimage. .

Abstract

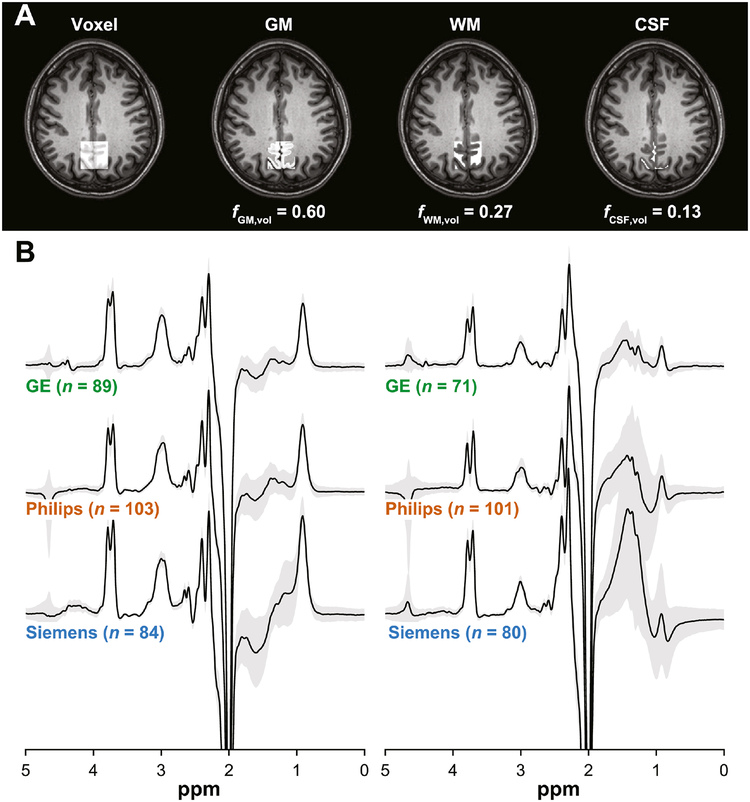
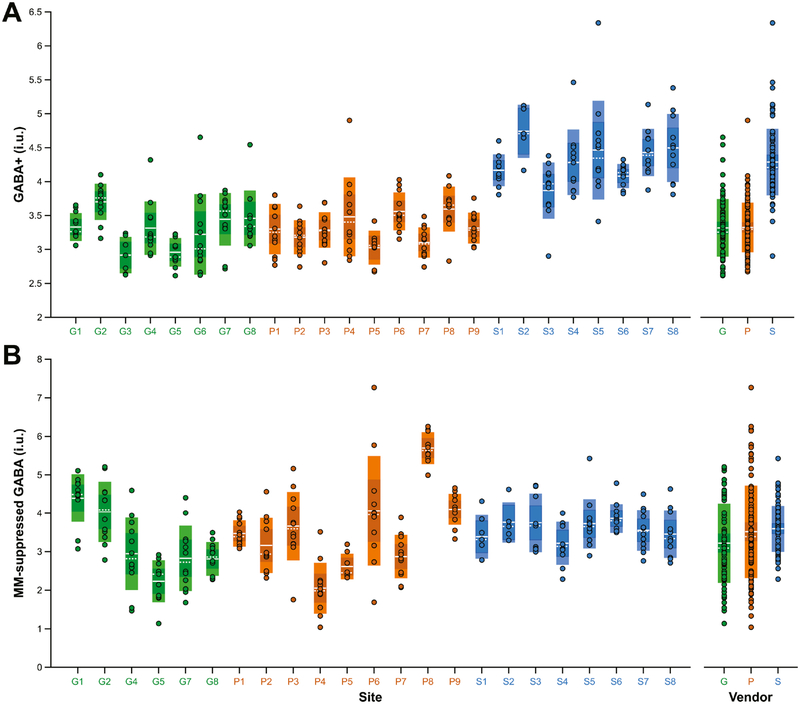
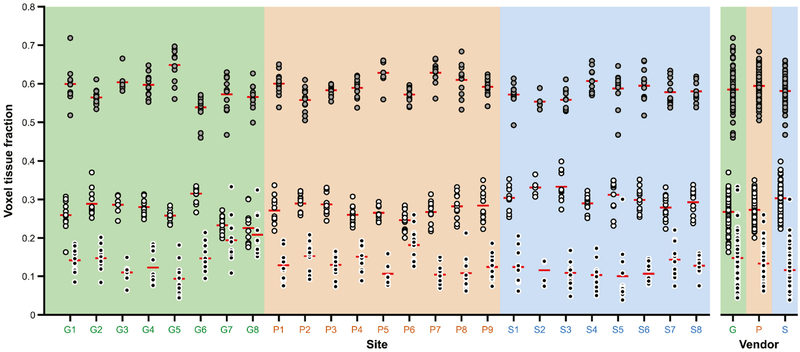
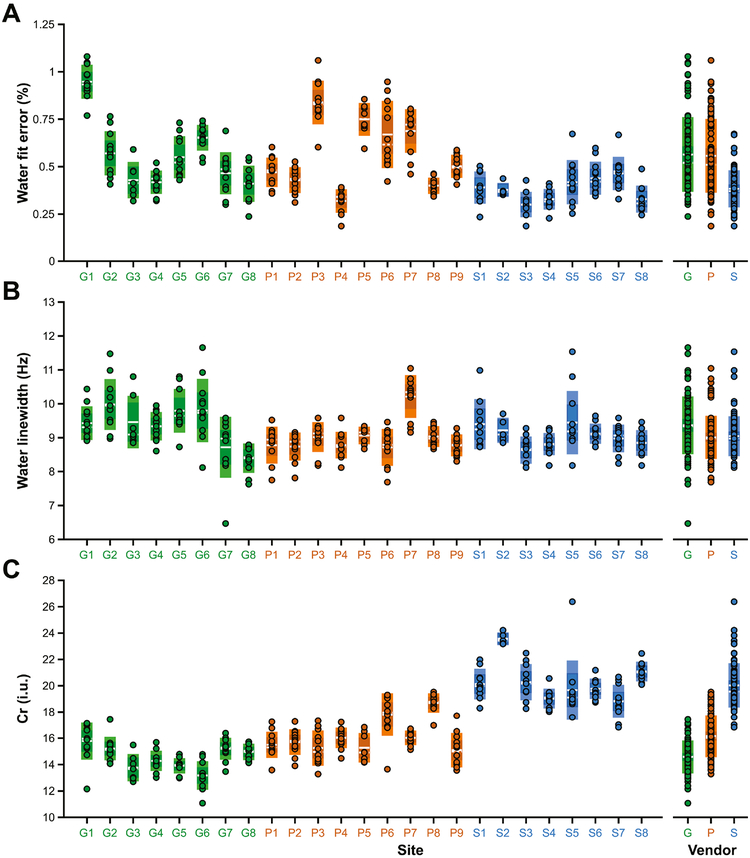
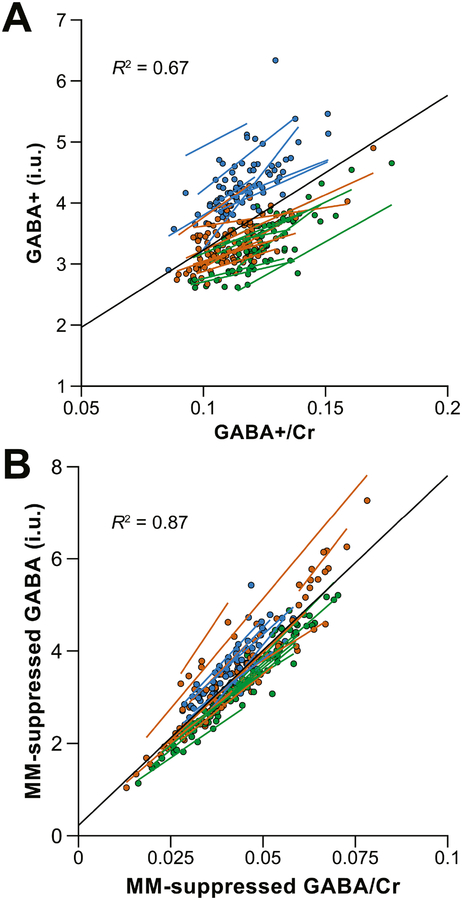
Accurate and reliable quantification of brain metabolites measured in vivo using 1H magnetic resonance spectroscopy (MRS) is a topic of continued interest. Aside from differences in the basic approach to quantification, the quantification of metabolite data acquired at different sites and on different platforms poses an additional methodological challenge. In this study, spectrally edited γ-aminobutyric acid (GABA) MRS data were analyzed and GABA levels were quantified relative to an internal tissue water reference. Data from 284 volunteers scanned across 25 research sites were collected using GABA+ (GABA + co-edited macromolecules (MM)) and MM-suppressed GABA editing. The unsuppressed water signal from the volume of interest was acquired for concentration referencing. Whole-brain T1-weighted structural images were acquired and segmented to determine gray matter, white matter and cerebrospinal fluid voxel tissue fractions. Water-referenced GABA measurements were fully corrected for tissue-dependent signal relaxation and water visibility effects. The cohort-wide coefficient of variation was 17% for the GABA + data and 29% for the MM-suppressed GABA data. The mean within-site coefficient of variation was 10% for the GABA + data and 19% for the MM-suppressed GABA data. Vendor differences contributed 53% to the total variance in the GABA + data, while the remaining variance was attributed to site- (11%) and participant-level (36%) effects. For the MM-suppressed data, 54% of the variance was attributed to site differences, while the remaining 46% was attributed to participant differences. Results from an exploratory analysis suggested that the vendor differences were related to the unsuppressed water signal acquisition. Discounting the observed vendor-specific effects, water-referenced GABA measurements exhibit similar levels of variance to creatine-referenced GABA measurements. It is concluded that quantification using internal tissue water referencing is a viable and reliable method for the quantification of in vivo GABA levels.

Keywords: Editing; GABA; MEGA-PRESS; MRS; Quantification; Tissue correction.


Figures

Fig. 1.
Fig. 1.
(A) Representative MRS voxel placement on a T1-weighted structural image and probabilistic partial volume voxel maps following tissue segmentation for one participant. Corresponding tissue fractions of gray matter (GM), white matter (WM) and cerebrospinal fluid (CSF) are shown. (B) Vendor-mean GABA-edited difference spectra acquired by GABA+ and MM-suppressed GABA editing. The gray patches represent ±1 standard deviation. The associated sample sizes are shown in parentheses.
Fig. 2.
Fig. 2.
(A) Water-referenced GABA+ and (B) MM-suppressed GABA measurements fully corrected for partial volume effects, displayed by site and by vendor. The boxes shaded with lighter colors represent ±1 standard deviation and the darker boxes represent the 95% confidence interval. The solid white lines denote the mean, while the dashed white lines denote the median. Sites are colored by vendor (GE sites in green, Philips sites in orange, Siemens sites in blue).
Fig. 3.
Fig. 3.
Gray matter (GM), white matter (WM) and cerebrospinal fluid (CSF) voxel tissue fractions, displayed by site and by vendor. GM = gray fill; WM = white fill; CSF = black fill. The red lines denote the mean. Sites are colored by vendor (GE sites with a green background, Philips sites with an orange background, Siemens sites with a blue background).
Fig. 4.
Fig. 4.
Quality metrics and water-referenced Cr measurements (from the TE = 68 ms data), displayed by site and by vendor. (A) water fit error; (B) water linewidth; (C) Cr measurements fully corrected for partial volume effects. The boxes shaded with lighter colors represent ±1 standard deviation and the darker boxes represent the 95% confidence interval. The solid white lines denote the mean, while the dashed white lines denote the median. Sites are colored by vendor (GE sites in green, Philips sites in orange, Siemens sites in blue).
Fig. 5.
Fig. 5.
Scatterplots illustrating the relationship between (A) water-referenced GABA+ measurements and GABA+/Cr ratios and (B) water-referenced MM-suppressed GABA measurements and MM-suppressed GABA/Cr ratios. Individual measurements are color-coded by vendor (GE in green, Philips in orange, Siemens in blue). The black regression line shows the relationship between GABA+/Cr and water-referenced GABA+ over the entire dataset. Additional color-coded regression lines are shown for each site. R2 values (i.e., the effect sizes) are also displayed.

Similar articles

  • Big GABA: Edited MR spectroscopy at 24 research sites.
    Mikkelsen M, Barker PB, Bhattacharyya PK, Brix MK, Buur PF, Cecil KM, Chan KL, Chen DY, Craven AR, Cuypers K, Dacko M, Duncan NW, Dydak U, Edmondson DA, Ende G, Ersland L, Gao F, Greenhouse I, Harris AD, He N, Heba S, Hoggard N, Hsu TW, Jansen JFA, Kangarlu A, Lange T, Lebel RM, Li Y, Lin CE, Liou JK, Lirng JF, Liu F, Ma R, Maes C, Moreno-Ortega M, Murray SO, Noah S, Noeske R, Noseworthy MD, Oeltzschner G, Prisciandaro JJ, Puts NAJ, Roberts TPL, Sack M, Sailasuta N, Saleh MG, Schallmo MP, Simard N, Swinnen SP, Tegenthoff M, Truong P, Wang G, Wilkinson ID, Wittsack HJ, Xu H, Yan F, Zhang C, Zipunnikov V, Zöllner HJ, Edden RAE. Mikkelsen M, et al. Neuroimage. 2017 Oct 1;159:32-45. doi: 10.1016/j.neuroimage.2017.07.021. Epub 2017 Jul 14. Neuroimage. 2017. PMID: 28716717 Free PMC article.
  • Reproducibility of prefrontal γ-aminobutyric acid measurements with J-edited spectroscopy.
    Geramita M, van der Veen JW, Barnett AS, Savostyanova AA, Shen J, Weinberger DR, Marenco S. Geramita M, et al. NMR Biomed. 2011 Nov;24(9):1089-98. doi: 10.1002/nbm.1662. Epub 2011 Feb 3. NMR Biomed. 2011. PMID: 21290458
  • Multi-vendor standardized sequence for edited magnetic resonance spectroscopy.
    Saleh MG, Rimbault D, Mikkelsen M, Oeltzschner G, Wang AM, Jiang D, Alhamud A, Near J, Schär M, Noeske R, Murdoch JB, Ersland L, Craven AR, Dwyer GE, Grüner ER, Pan L, Ahn S, Edden RAE. Saleh MG, et al. Neuroimage. 2019 Apr 1;189:425-431. doi: 10.1016/j.neuroimage.2019.01.056. Epub 2019 Jan 22. Neuroimage. 2019. PMID: 30682536 Free PMC article.
  • Current practice in the use of MEGA-PRESS spectroscopy for the detection of GABA.
    Mullins PG, McGonigle DJ, O'Gorman RL, Puts NA, Vidyasagar R, Evans CJ; Cardiff Symposium on MRS of GABA; Edden RA. Mullins PG, et al. Neuroimage. 2014 Feb 1;86:43-52. doi: 10.1016/j.neuroimage.2012.12.004. Epub 2012 Dec 13. Neuroimage. 2014. PMID: 23246994 Free PMC article. Review.
  • Sources of Variability and Improvements in the Measure of GABA using MEGA-PRESS at 3T.
    Harasym D, Nelson AJ, Noseworthy MD. Harasym D, et al. Crit Rev Biomed Eng. 2019;47(5):437-455. doi: 10.1615/CritRevBiomedEng.2020030321. Crit Rev Biomed Eng. 2019. PMID: 32422033 Review.

Cited by

References

    1. Alger JR, 2010. Quantitative Proton Magnetic Resonance Spectroscopy and Spectroscopic Imaging of the Brain. Top. Magn. Reson. Imaging 21, 115–128. doi:10.1097/RMR.0b013e31821e568f - DOI - PMC - PubMed
    1. Ashburner J, Friston KJ, 2005. Unified segmentation. Neuroimage 26, 839–851. doi:10.1016/j.neuroimage.2005.02.018 - DOI - PubMed
    1. Barantin L, Le Pape A, Akoka S, 1997. A new method for absolute quantitation MRS metabolites. Magn. Reson. Med 38, 179–182. doi:10.1002/mrm.1910380203 - DOI - PubMed
    1. Barker PB, Soher BJ, Blackband SJ, Chatham JC, Mathews VP, Bryan RN, 1993. Quantitation of proton NMR spectra of the human brain using tissue water as an internal concentration reference. NMR Biomed 6, 89–94. doi:10.1002/nbm.1940060114 - DOI - PubMed
    1. Bates D, Mächler M, Bolker BM, Walker SC, 2015. Fitting linear mixed-effects models using lme4. J. Stat. Softw 67. doi:10.18637/jss.v067.i01 - DOI

Publication types