. 2019 Mar 5;20(5):1129.
doi: 10.3390/ijms20051129.

Evolutionary Toxicogenomics of the Striped Killifish (Fundulus majalis) in the New Bedford Harbor (Massachusetts, USA)

Affiliations

Evolutionary Toxicogenomics of the Striped Killifish (Fundulus majalis) in the New Bedford Harbor (Massachusetts, USA)

Paolo Ruggeri et al. Int J Mol Sci. .

Abstract

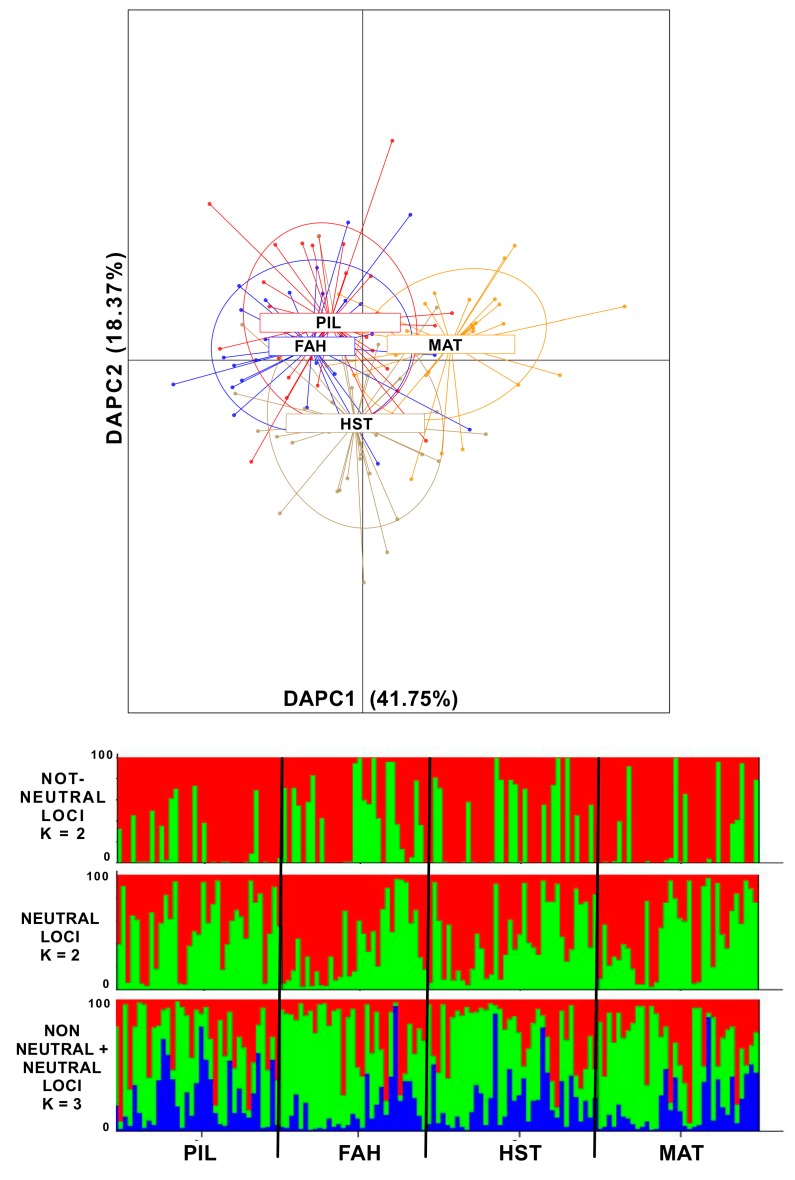
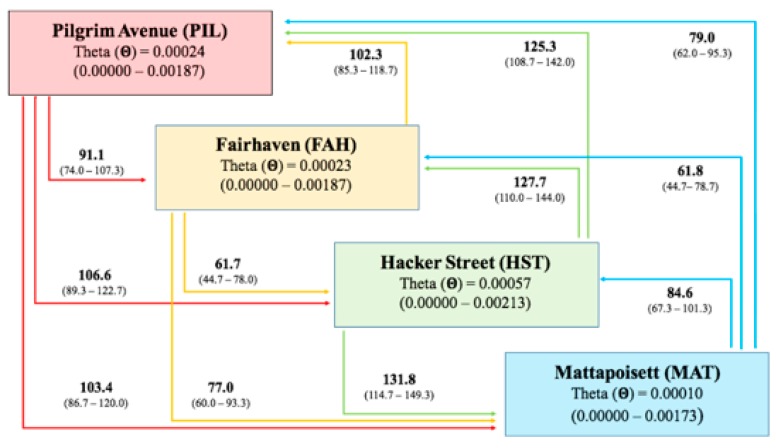
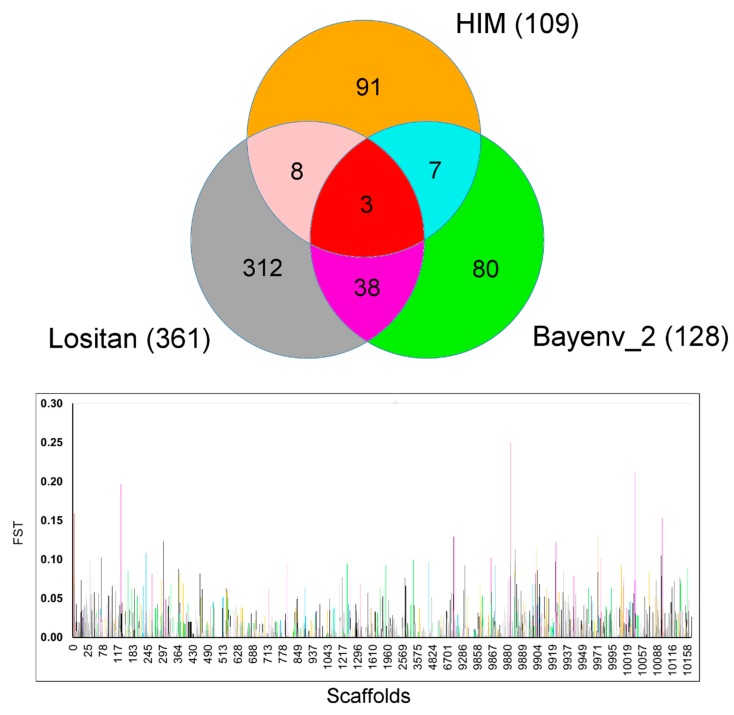
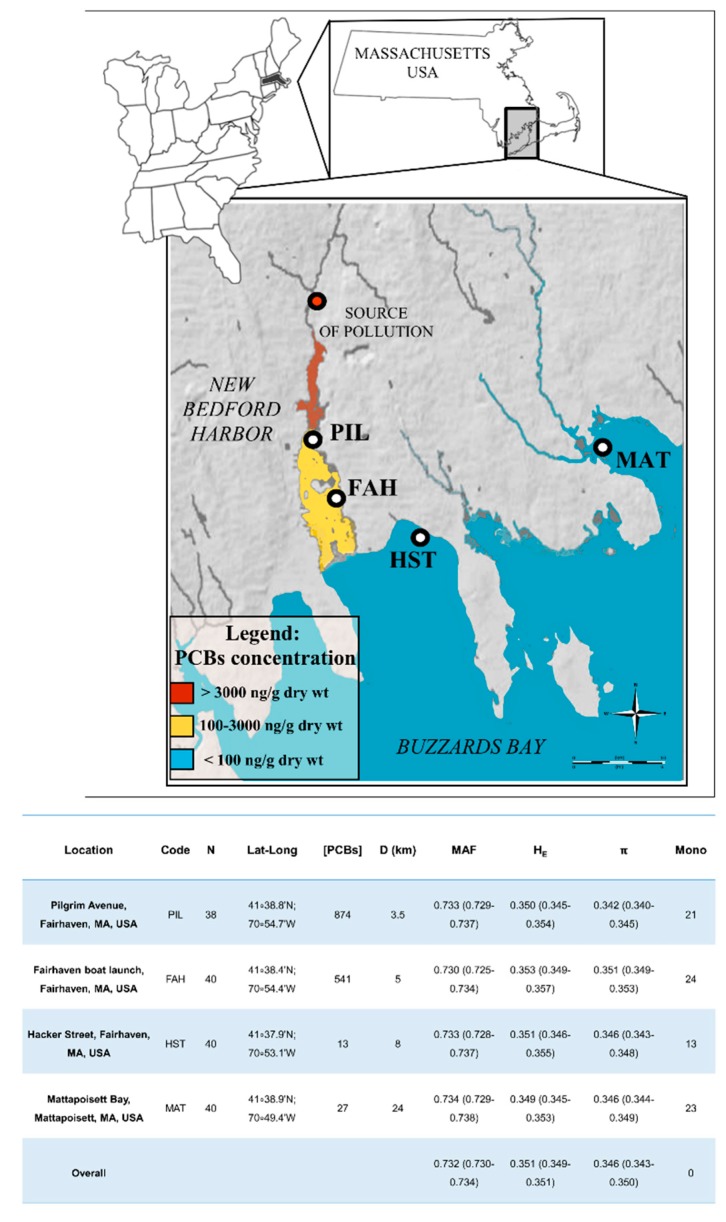
In this paper, we used a Genotyping-by-Sequencing (GBS) approach to find and genotype more than 4000 genome-wide SNPs (Single Nucleotide Polymorphisms) from striped killifish exposed to a variety of polychlorinated biphenyls (PCBs) and other aromatic pollutants in New Bedford Harbor (NBH, Massachusetts, USA). The aims of this study were to identify the genetic consequences of exposure to aquatic pollutants and detect genes that may be under selection. Low genetic diversity (HE and π) was found in the site exposed to the highest pollution level, but the pattern of genetic diversity did not match the pollution levels. Extensive connectivity was detected among sampling sites, which suggests that balanced gene flow may explain the lack of genetic variation in response to pollution levels. Tests for selection identified 539 candidate outliers, but many of the candidate outliers were not shared among tests. Differences among test results likely reflect different test assumptions and the complex pollutant mixture. Potentially, selectively important loci are associated with 151 SNPs, and enrichment analysis suggests a likely involvement of these genes with pollutants that occur in NBH. This result suggests that selective processes at genes targeted by pollutants may be occurring, even at a small geographical scale, and may allow the local striped killifish to resist the high pollution levels.

Keywords: GBS; SNPs; candidate outliers; evolutionary genomics; migration; toxicant resistance.


Conflict of interest statement

The authors declare no conflict of interest.

Figures

Figure 1
Figure 1
Figure 1 (above) DAPC (Discriminant Analysis of Principal Components) plot of individuals from the four sampling sites along the two most significant axes (PC1 41.75%, PC2 18.37% explained variance). In red are the individuals from Pilgrim Avenue (PIL) and, in blue, are the individuals from Fairhaven (FAH). Both PIL and FAH are located in the inner New Bedford Harbor (NBH) close to the pollution source. Depicted in light brown are individuals from Hacker Street (HST) and, in yellow, are individuals from Mattapoisett (MAT). Both these latter sampling sites are located in the outer NBH area and are exposed to lower pollution concentrations. The insert explains the percent of variance for the first three discrimination eigenvalues (in dark grey are the significant DAs). Figure 1 (below), STRUCTURE plots of the most likely K tested from the simulations with non-neutral (K = 2), only neutral (K = 2), and the complete set of markers analyzed (K = 3).
Figure 2
Figure 2
Pattern of historical gene flow from the Migrate-n simulation. The squares represent the four sampling locations and theta (Θ) values with 95% confidence intervals. Colored arrows refer to the sampling location of the same color and explain the directionality and rate of gene flow (M values are reported at the corner of each arrow with a 95% confidence interval).
Figure 3
Figure 3
Venn diagram of the outlier loci interpolation among four candidate outlier detection tests and FST value distribution of each outlier locus along the scaffolds position. In the Venn diagram (above), the numbers encased represent the number of shared SNPs between and among the corresponding set of methodologies. The colors in the Venn diagram reflect the pattern of color used in the Manhattan plot (below) that represents the scaffold position of each outlier locus and its estimated FST value.
Figure 4
Figure 4
Geographical area and the sampling locations covered by this study. The main map refers to New Bedford Harbor and Buzzards Bay (URL: http://mapmaker.education.nationalgeographic.org). The colored coastal areas refer to the pollution gradient described in the figure legend. Map ruler (URL: https://upload.wikimedia.org/wikipedia/commons/1/1a/Scale_kilometres_miles.svg) and compass (URL: https://commons.wikimedia.org/wiki/File:Simple_compass_rose.svg). The map of Eastern USA was obtained from URL: http://www.clker.com/cliparts/m/3/H/f/K/e/eastern-u-s-map-md.png). The map representing the Massachusetts outline was downloaded from Worldatlas.com at the URL: http://www.worldatlas.com/webimage/countrys/namerica/usstates/outline/ma.htm). The table below the figure summarize the main pollution and genetic diversity observed. Code = collection site codes, N = sample size, Lat-Long = geographic coordinates of sampled points, [PCBs] = PCBs concentration in (ng/g dry weight), D = distance in Km from the source of pollution. Genetic diversity by population: averaged Major Allele Frequencies (MAF), averaged expected heterozygosity (HE), and averaged nucleotide diversity (π), and number of monomorphic loci (Mono). Values between brackets refer to 95% confidence intervals.

Similar articles

Cited by

References

    1. Cope W.G., Leidy R.B., Hodgson E. Classes of toxicants: use classes. In: Hodgson E., editor. A Textbook of Modern Toxicology. John Wiley and Sons Inc.; New York, NY, USA: 2004. pp. 49–74.
    1. Wisdom H.L. Contamination of the marine environment from land–based sources. Mar. Pollut. Bull. 1992;25:32–36.
    1. GESAMP Reducing environmental impacts of coastal aquaculture. Rep. Stud. 1991;47
    1. Johnston E.L., Mayer–Pinto M., Crowe T.P., Frid C. Chemical contaminant effects on marine ecosystem functioning. J. Appl. Ecol. 2015;52:140–149. doi: 10.1111/1365-2664.12355. - DOI
    1. Hamilton P.B., Cowx I.G., Oleksiak M.F., Grahn M., Stevens J.R., Carvalho G.R., Nicol E., Tyler C.R. Population-level consequences for wild fish exposed to sublethal concentrations of chemicals–a critical review. Fish Fish. 2015;17:545–566. doi: 10.1111/faf.12125. - DOI

Substances