

The Complete Mitochondrial Genome Sequences of the Philomycus bilineatus (Stylommatophora: Philomycidae) and Phylogenetic Analysis
- PMID: 30841657
- PMCID: PMC6471268
- DOI: 10.3390/genes10030198
The Complete Mitochondrial Genome Sequences of the Philomycus bilineatus (Stylommatophora: Philomycidae) and Phylogenetic Analysis
Abstract
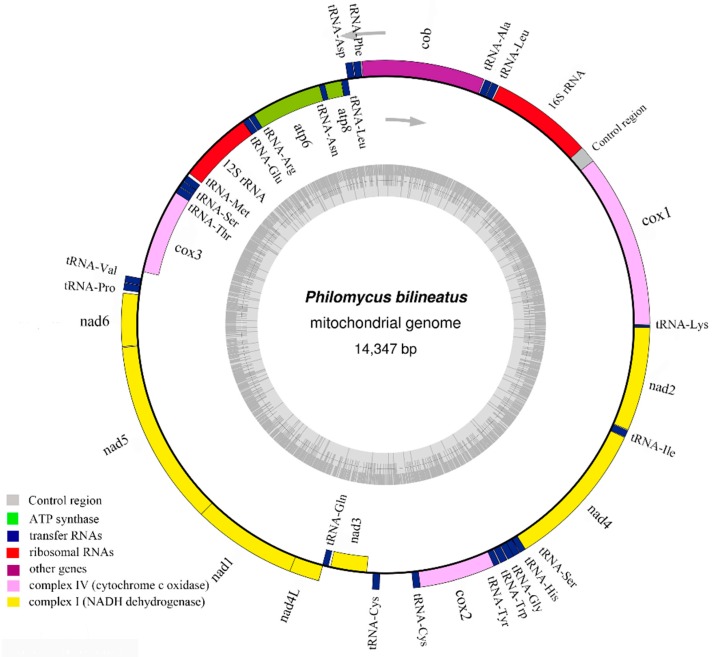
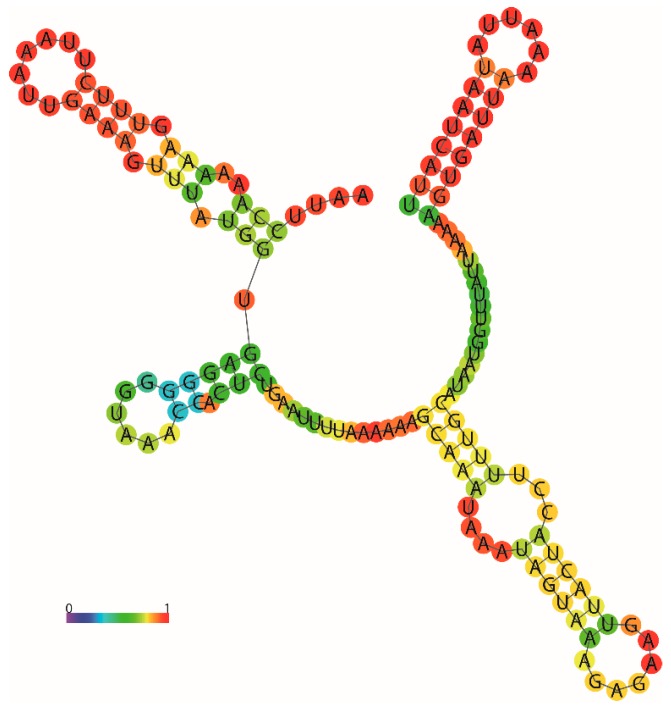
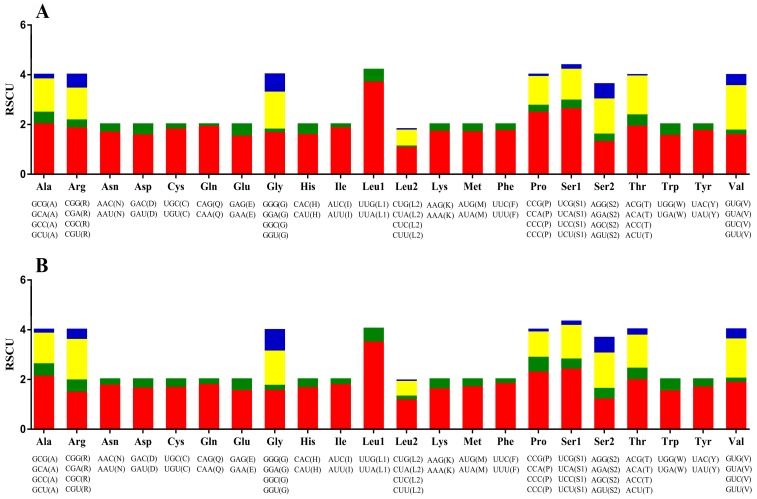
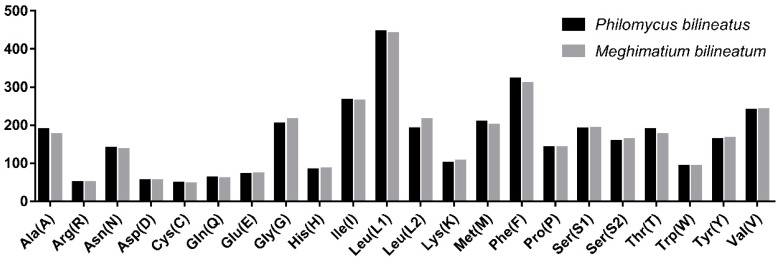
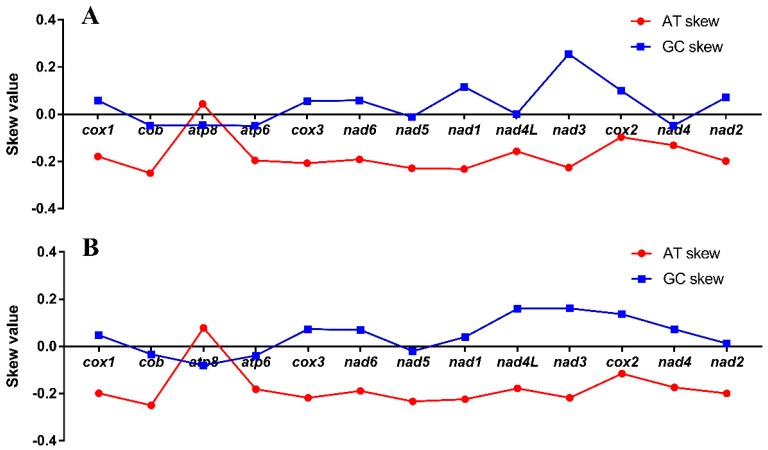
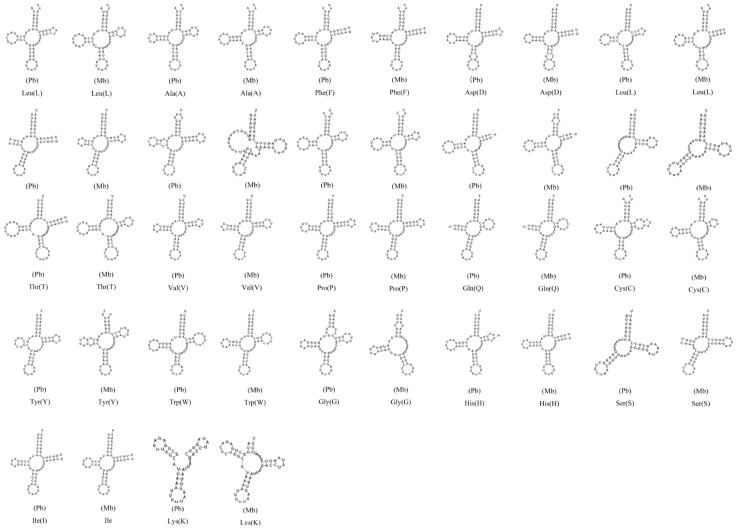
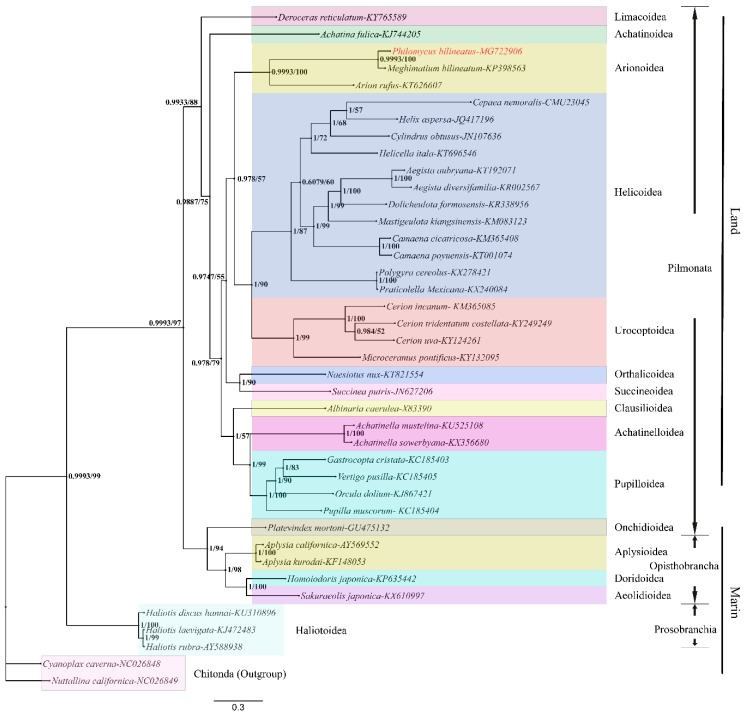
The mitochondrial genome (mitogenome) can provide information for phylogenetic analyses and evolutionary biology. We first sequenced, annotated, and characterized the mitogenome of Philomycus bilineatus in this study. The complete mitogenome was 14,347 bp in length, containing 13 protein-coding genes (PCGs), 23 transfer RNA genes, two ribosomal RNA genes, and two non-coding regions (A + T-rich region). There were 15 overlap locations and 18 intergenic spacer regions found throughout the mitogenome of P. bilineatus. The A + T content in the mitogenome was 72.11%. All PCGs used a standard ATN as a start codon, with the exception of cytochrome c oxidase 1 (cox1) and ATP synthase F0 subunit 8 (atp8) with TTG and GTG. Additionally, TAA or TAG was identified as the typical stop codon. All transfer RNA (tRNA) genes had a typical clover-leaf structure, except for trnS1 (AGC), trnS2 (TCA), and trnK (TTT). A phylogenetic analysis with another 37 species of gastropods was performed using Bayesian inference, based on the amino acid sequences of 13 mitochondrial PCGs. The results indicated that P. bilineatus shares a close ancestry with Meghimatium bilineatum. It seems more appropriate to reclassify it as Arionoidea rather than Limacoidea, as previously thought. Our research may provide a new meaningful insight into the evolution of P. bilineatus.
Keywords: Philomycus bilineatus; mitochondrial genome; phylogenetic analysis.
Conflict of interest statement
The authors declare that they have no conflicts of interest to this work.
Figures
Similar articles
-
The complete mitogenome of Arion vulgaris Moquin-Tandon, 1855 (Gastropoda: Stylommatophora): mitochondrial genome architecture, evolution and phylogenetic considerations within Stylommatophora.PeerJ. 2020 Feb 21;8:e8603. doi: 10.7717/peerj.8603. eCollection 2020. PeerJ. 2020. PMID: 32117634 Free PMC article.
-
A novel gene arrangement among the Stylommatophora by the complete mitochondrial genome of the terrestrial slug Meghimatium bilineatum (Gastropoda, Arionoidea).Mol Phylogenet Evol. 2019 Jun;135:177-184. doi: 10.1016/j.ympev.2019.03.002. Epub 2019 Mar 8. Mol Phylogenet Evol. 2019. PMID: 30858078
-
Characterization of the complete mitochondrial genome of Tryporyza incertulas, in comparison with seven other Pyraloidea moths.Gene. 2014 Jan 1;533(1):356-65. doi: 10.1016/j.gene.2013.07.072. Epub 2013 Aug 15. Gene. 2014. PMID: 23954873
-
The complete mitochondrial genome of Euproctis similis (Lepidoptera: Noctuoidea: Erebidae) and phylogenetic analysis.Int J Biol Macromol. 2017 Dec;105(Pt 1):219-227. doi: 10.1016/j.ijbiomac.2017.07.033. Epub 2017 Jul 8. Int J Biol Macromol. 2017. PMID: 28698080
-
The complete mitochondrial genome of Vanessa indica and phylogenetic analyses of the family Nymphalidae.Genes Genomics. 2018 Oct;40(10):1011-1022. doi: 10.1007/s13258-018-0709-x. Epub 2018 Jun 14. Genes Genomics. 2018. PMID: 29949077
Cited by
-
In vitro and in vivo Activity of Phibilin Against Candida albicans.Front Microbiol. 2022 May 11;13:862834. doi: 10.3389/fmicb.2022.862834. eCollection 2022. Front Microbiol. 2022. PMID: 35633688 Free PMC article.
-
Characterization of the Complete Mitochondrial Genome of Schizothorax kozlovi (Cypriniformes, Cyprinidae, Schizothorax) and Insights into the Phylogenetic Relationships of Schizothorax.Animals (Basel). 2024 Feb 25;14(5):721. doi: 10.3390/ani14050721. Animals (Basel). 2024. PMID: 38473106 Free PMC article.
-
The mitochondrial genome of the semi-slug Omalonyx unguis (Gastropoda: Succineidae) and the phylogenetic relationships within Stylommatophora.PLoS One. 2021 Jun 25;16(6):e0253724. doi: 10.1371/journal.pone.0253724. eCollection 2021. PLoS One. 2021. PMID: 34170937 Free PMC article.
-
Sequence and structure comparison of ATP synthase F0 subunits 6 and 8 in notothenioid fish.PLoS One. 2021 Oct 6;16(10):e0245822. doi: 10.1371/journal.pone.0245822. eCollection 2021. PLoS One. 2021. PMID: 34613983 Free PMC article.
-
The complete mitogenome of Arion vulgaris Moquin-Tandon, 1855 (Gastropoda: Stylommatophora): mitochondrial genome architecture, evolution and phylogenetic considerations within Stylommatophora.PeerJ. 2020 Feb 21;8:e8603. doi: 10.7717/peerj.8603. eCollection 2020. PeerJ. 2020. PMID: 32117634 Free PMC article.
References
Publication types
MeSH terms
LinkOut - more resources
Full Text Sources
