. 2019 Mar 6;11(482):eaau5612.
doi: 10.1126/scitranslmed.aau5612.

Structure-based design of small-molecule inhibitors of EBNA1 DNA binding blocks Epstein-Barr virus latent infection and tumor growth

Affiliations

Structure-based design of small-molecule inhibitors of EBNA1 DNA binding blocks Epstein-Barr virus latent infection and tumor growth

Troy E Messick et al. Sci Transl Med. .

Abstract

Epstein-Barr virus (EBV) is a DNA tumor virus responsible for 1 to 2% of human cancers including subtypes of Burkitt's lymphoma, Hodgkin's lymphoma, gastric carcinoma, and nasopharyngeal carcinoma (NPC). Persistent latent infection drives EBV-associated tumorigenesis. Epstein-Barr nuclear antigen 1 (EBNA1) is the only viral protein consistently expressed in all EBV-associated tumors and is therefore an attractive target for therapeutic intervention. It is a multifunctional DNA binding protein critical for viral replication, genome maintenance, viral gene expression, and host cell survival. Using a fragment-based approach and x-ray crystallography, we identify a 2,3-disubstituted benzoic acid series that selectively inhibits the DNA binding activity of EBNA1. We characterize these inhibitors biochemically and in cell-based assays, including chromatin immunoprecipitation and DNA replication assays. In addition, we demonstrate the potency of EBNA1 inhibitors to suppress tumor growth in several EBV-dependent xenograft models, including patient-derived xenografts for NPC. These inhibitors selectively block EBV gene transcription and alter the cellular transforming growth factor-β (TGF-β) signaling pathway in NPC tumor xenografts. These EBNA1-specific inhibitors show favorable pharmacological properties and have the potential to be further developed for the treatment of EBV-associated malignancies.


Conflict of interest statement

Competing interests: The Wistar Institute on behalf of the authors T.E.M. and P.M.L. have filed patent applications PCT/US14/65765 “EBNA1 inhibitors and their method of use” and PCT/US2016/032574 “EBNA1 inhibitors and methods using same” covering composition of matter and their use on the small molecules disclosed here for the treatment of human cancer and other diseases. Wistar, T.E.M. and P.M.L., and Fox Chase Chemical Diversity Center Inc. (FCCDC) have received financial benefit from the license to Cullinan Apollo Corp. and would receive additional financial benefit should the development of the EBNA1 inhibitor meet certain milestones including commercialization. A.P.J.v.d.H., M.E.M., B.-W.G., and J.A.C. were employed by Vironika LLC. P.M.L. is the owner of Vironika LLC. G.R.S., M.E.M., Y.Z., V.V., and A.B.R. are employees of FCCDC. A.B.R., M.E.M., and Y.Z. have ownership interests in the company (FCCDC). B.-W.G. is currently employed by WuXi AppTech. A.P.J.v.d.H., K.A.M., D.H.T., and L.T. are currently employees of Johnson & Johnson. V.V. is currently an employee of Senseonics. J.A.C. is currently an employee of The Wistar Institute. E.R.Z. was a paid consultant on the project. E.R.Z. is currently an employee of Pfizer.

Figures

Fig. 1.
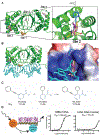
Fig. 1.. Structure-guided fragment-based drug design for inhibitors of EBNA1 DNA binding function.
(A) Superimposition of x-ray crystal structures for 20 fragments bound to four different sites in the EBNA1 DBD (green ribbon). Right inset: Close-up and 90° turn showing fragments bound to site 2. (B) Same as in (A), with modeled superposition of cognate DNA bound to EBNA1. Right inset: Space-filling model colored according to electrostatic potential of EBNA1 with fragments bound to site 2. (C) Fragments VK-0044 [median inhibitory concentration (IC50), 110 μM] and VK-0064 (IC50, 2 μM) were chemically merged to generate a more potent core scaffold VK-0497 (IC50, 0.89 μM). (D) Schematic of ALPHA proximity assay for EBNA1 binding to its cognate DNA showing ~60-fold selectivity relative to counterscreen for LANA binding to its cognate DNA (right panel).
Fig. 2.
Fig. 2.. Biochemical and biophysical basis for EBNA1 inhibitors.
(A) X-ray crystal structure of VK-0941 bound to EBNA1 with amino acid residues involved in hydrogen-bonding contacts. (B) Schematic for ALPHA competition assay using biotin linker–conjugated VK-0941 used for the assessment of more potent compounds VK-1248 and VK-1760. (C) Isothermal titration calorimetry (ITC) isotherms of EBNA1 with dimethyl sulfoxide (DMSO) and VK-1248. (D) Heteronuclear single-quantum coherence (HSQC) nuclear magnetic resonance (NMR) spectra of 15N-labeled EBNA1 unbound (black) and bound with VK-0941 (red). ppm, parts per million.
Fig. 3.
Fig. 3.. Cell-based assay validation for EBNA1 inhibition.
(A) Chemical structures of methyl esters of VK-1760 (VK-1850) and VK-1248 (VK-1727) used for in vitro cell-based assays. (B) BrdU proliferation assays for EBV-positive cell lines (C666–1, LCL352, and Akata+) compared to EBV-negative cell lines (HK1, BJAB, and Akata). Cells were treated with DMSO control or VK-1727 or VK-1850 at 0.25 or 2.5 μM for 2 days with fresh drug and medium change each day. OD, optical density. (C) Resazurin cell viability assay for EBV-positive cells (C666–1 and LCL352) or EBV-negative cells (HK1 and BJAB) with 10-point median effective concentration (EC50) calculation for VK-1727. (D) EBNA1-dependent OriP replication assays in transiently transfected cells treated with either DMSO or 10 μM VK-1248, VK-1727, VK-1760, or VK-1850. Dpn I–resistant replicated DNA is indicated by an arrowhead. (E) Average replication activity for three independent DNA replication assays of EBNA1 in the presence of inhibitors after transient transfection in 293T, HeLa, and SUNE1 cells averaged together and normalized to DMSO controls. P values were determined by two-tailed Student’s t test. (F) Representative Western blot of EBNA1 and actin after treatment with increasing amounts of inhibitors 4 days after transfection. HRP, horseradish peroxidase. (G) ChIP assay for EBNA1 binding to the DS, Qp, PITPNB cellular locus, or negative control EBV OriLyt locus in EBV-positive C666–1 NPC cells treated with DMSO or 30 μM VK-1850 for times ranging from 1 to 72 hours. P values were determined by two-tailed Student’s t test for three biological replicates. *P < 0.01. IgG, immunoglobulin G.
Fig. 4.
Fig. 4.. EBNA1 inhibitors and EBV-positive tumor growth.
(A to C) NSG-SCID (n = 10 per group) mice injected with 106 M14 LCLs expressing luciferase were treated twice daily (BID) with VK-1727 (10 mg/kg; red), VK-1850 (10 mg/kg; blue), or vehicle (black) and monitored for (A) bioluminescence that was (B) quantified (flux; photons/s) with a Xenogen IVIS imager and for (C) tumor size measured by calipers. Tumor growth was significantly (P < 0.0001, Kruskal-Wallis test) inhibited in mice treated with EBNA1 inhibitors as measured by both bioluminescence and tumor size. (D) Beige-SCID mice (n = 8 per group) were injected with the EBV-positive NPC cell line C666–1, which was allowed to grow to 100 mm3, and then treated twice daily with vehicle (black), VK-1727 (10 mg/kg; red), or VK-1850 (10 mg/kg, blue) and monitored by caliper measurement. NPC tumor growth was significantly (P = 0.0035, Kruskal-Wallis test) inhibited in mice treated with EBNA1 inhibitors. (E) Athymic Swiss nude mice (n = 6 per group) were surgically engrafted with C15-PDX and treated twice daily with vehicle control (black), VK-1727 (10 mg/kg; red), or VK-1850 (10 mg/kg; blue) and monitored by caliper measurement. (F) Tumor growth for C15-PDX shown in (E) was significantly (P < 0.0001, Kruskal-Wallis test) inhibited in mice treated with VK-1727 and VK-1850. *P < 0.05. (G) Athymic Swiss nude mice (n = 6 per group) were surgically engrafted with C17-PDX and treated twice daily with vehicle control (black), VK-1727 (10 mg/kg; red), or VK-1850 (10 mg/kg; blue) and monitored by caliper measurement. (H) Survival curve for C17-PDX animals shown in (G). P = 0.0005, log-rank Mantel-Cox test. (I) Survival curve for NSG mice implanted with M14 tumors and treated with EBNA1 inhibitor or vehicle until tumor reached 2000 mm3 (P = 0.0005, log-rank Mantel-Cox test). IP, intraperitoneally.
Fig. 5.
Fig. 5.. EBNA1 inhibitors and EBV-negative tumor growth.
(A) Mice engrafted with EBV-negative lung carcinoma cell line A549 were treated twice daily with VK-0941 (40 mg/kg), VK-1248 (30 mg/kg), or vehicle. (B) Mice engrafted with EBV-positive LCLs were treated twice daily with VK-0941 (30 mg/kg), VK-1248 (30 mg/kg), or vehicle. Tumor size was significantly decreased in EBV-positive LCLs treated with EBNA1 inhibitors [P < 0.0001, ordinary one-way analysis of variance (ANOVA)] but not in the EBV-negative A549 cell line.
Fig. 6.
Fig. 6.. Comparison of EBNA1 inhibitors with other treatments.
(A) C17-PDX was treated with vehicle (VEH) (black), IR (4 Gy) (green), VK-1850 (10 mg/kg) (blue), or a combination of IR and VK-1850 (red). IR was given on days 7, 14, 21, 28, and 35. (B) Survival curve for mice treated as described in (A) (P = 0.0001, log-rank Mantel-Cox test). (C) C15-PDX was treated with vehicle (black), olaparib (20 mg/kg, intraperitoneally) (yellow), idelalisib [30 mg/kg, orally (PO)] (green), 5-FU (20 mg/kg, intraperitoneally) (purple), or VK-1850 (10 mg/kg, intraperitoneally) (red). Tumor growth was assayed at day 49. QD, once daily; QW, once weekly. (D) Drug concentration (ng/ml) for VK-1760 in plasma or tumor at 0.5, 1, 2, and 5 hours after injection of VK-1760 (10 mg/kg) or the methyl ester prodrug VK-1850.
Fig. 7.
Fig. 7.. EBV target engagement and cell survival pathways affected by EBNA1 inhibitors.
(A) mRNA expression analysis comparing RNA expression in C15-PDX tumors treated with vehicle (x axis) and those treated with VK-1850 (y axis), shown as a scatter plot. EBV genes (red) are universally down-regulated in C15-PDX tumors isolated from animals treated with VK-1850 as compared to vehicle-treated animals. (B) mRNA expression of select EBV and cellular genes as measured by NanoString. EBV genes were significantly down-regulated for all EBV transcripts and specifically for BKRF1, BYFR1, BZLF1, BWRF1, BALF, BHRF (P < 0.001), and BNLF (P = 0.04) (ordinary one-way ANOVA) in C15-PDX tumors from VK-1727 (10 mg/kg; red) and VK-1850 (10 mg/kg; blue) mice as compared to vehicle-treated ones (black). The expression of most cellular genes was not significantly affected by treatment with EBNA1 inhibitors. For example, there was no significant change in the cellular genes FANCA, MAP3K, and PML. COL1A2 mRNA expression was significantly increased (P = 0.004, ordinary one-way ANOVA) in EBNA1 inhibitor–treated cells. (C) Heat map analysis of cellular RNA expression of genes in the TGF-β pathway in tumors treated with vehicle, VK-1727, or VK-1850. Red indicates decreased expression, and yellow indicates increased expression. (D) Decreased EBER-ISH staining (purple) in tumors allowed to grow to 300 mm3 and then treated with VK-1850 or vehicle control for 1 to 10 days, as indicated. Scale bars, 50 μm.

Comment in

References

    1. Parkin DM, Global cancer statistics in the year 2000. Lancet Oncol. 2, 533–543 (2001). - PubMed
    1. Young LS, Yap LF, Murray PG, Epstein–Barr virus: More than 50 years old and still providing surprises. Nat. Rev. Cancer 16, 789–802 (2016). - PubMed
    1. Young LS, Rickinson AB, Epstein–Barr virus: 40 years on. Nat. Rev. Cancer 4, 757–768 (2004). - PubMed
    1. Kang M-S, Kieff E, Epstein–Barr virus latent genes. Exp. Mol. Med 47, e131 (2015). - PMC - PubMed
    1. Farrell PJ, Epstein–Barr virus and cancer. Annu. Rev. Pathol 24, 29–53 (2019). - PubMed

Publication types

MeSH terms

Substances

LinkOut - more resources