. 2019 Mar 6;11(482):eaau8680.
doi: 10.1126/scitranslmed.aau8680.

Activin type II receptor signaling in cardiac aging and heart failure

Affiliations

Activin type II receptor signaling in cardiac aging and heart failure

Jason D Roh et al. Sci Transl Med. .

Abstract

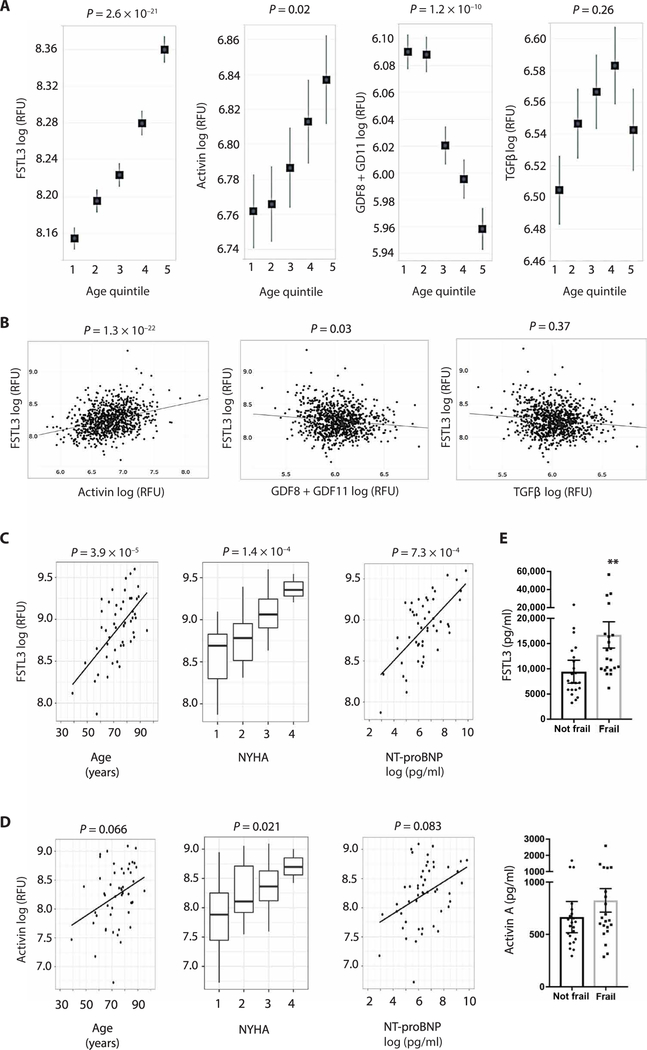
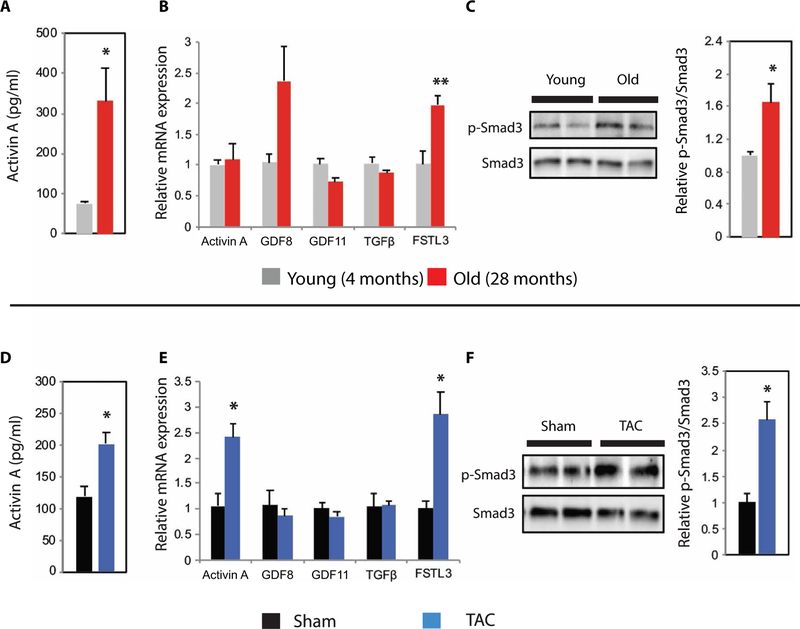
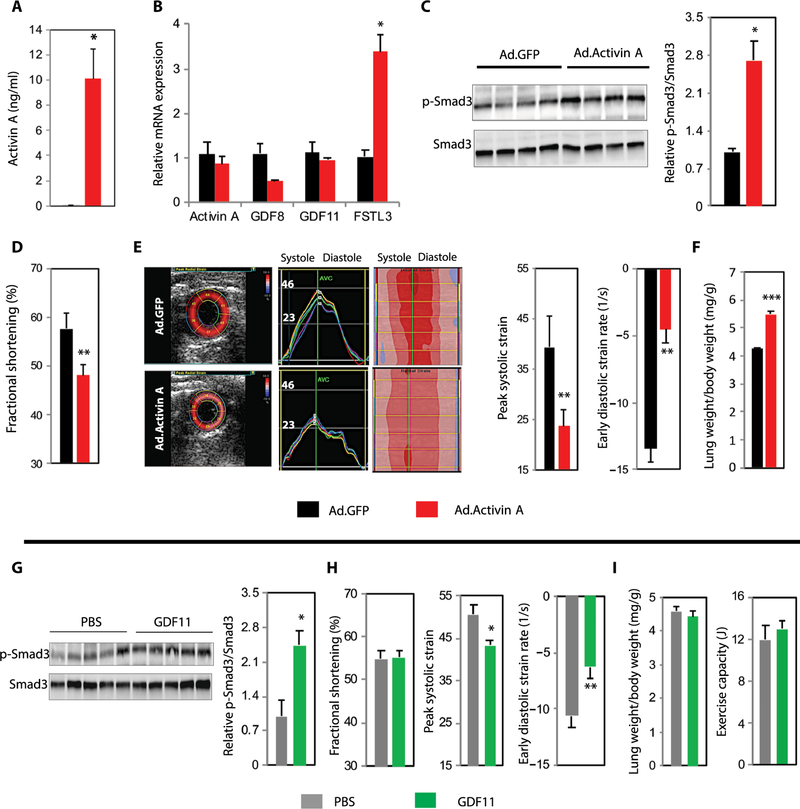
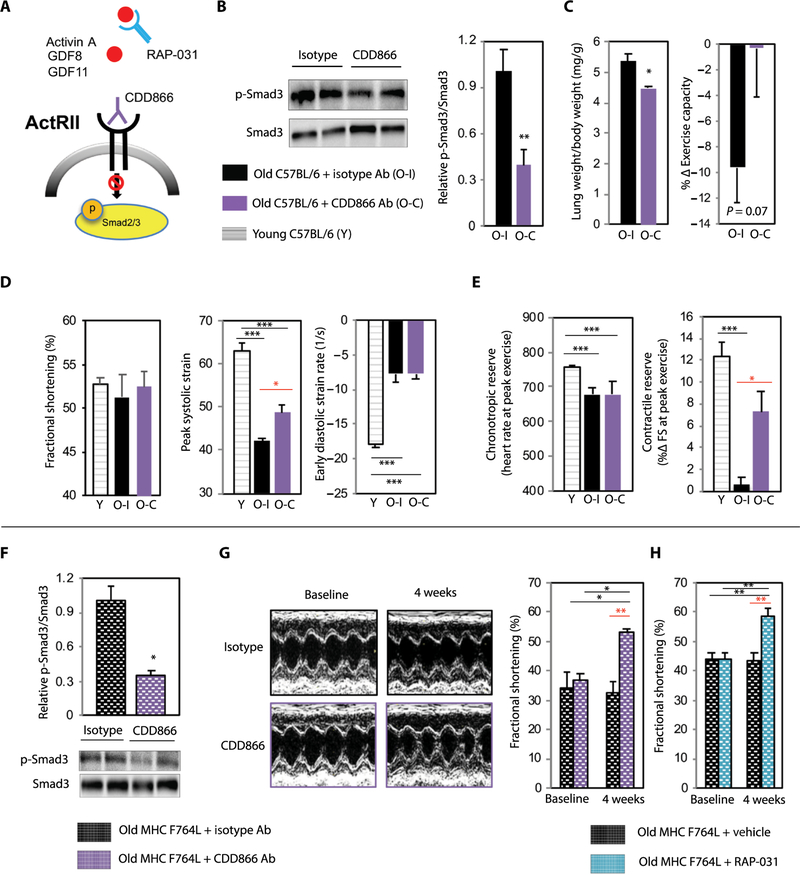
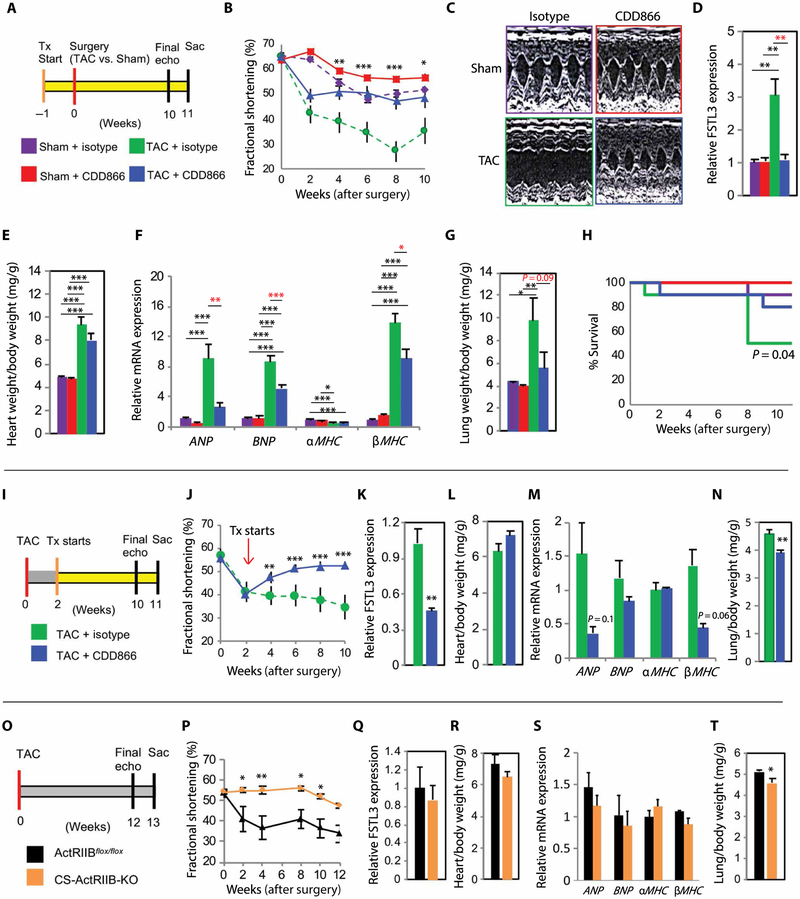
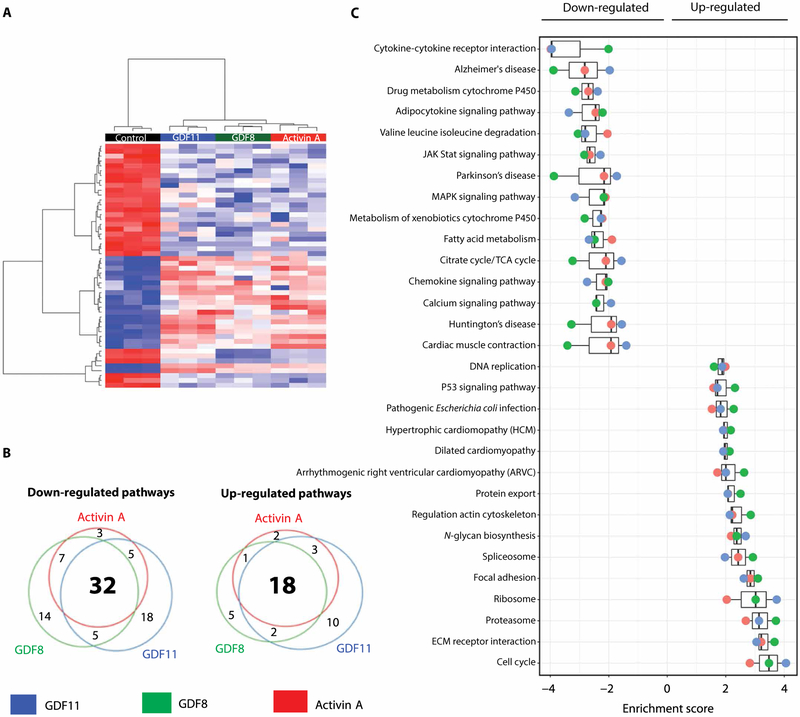
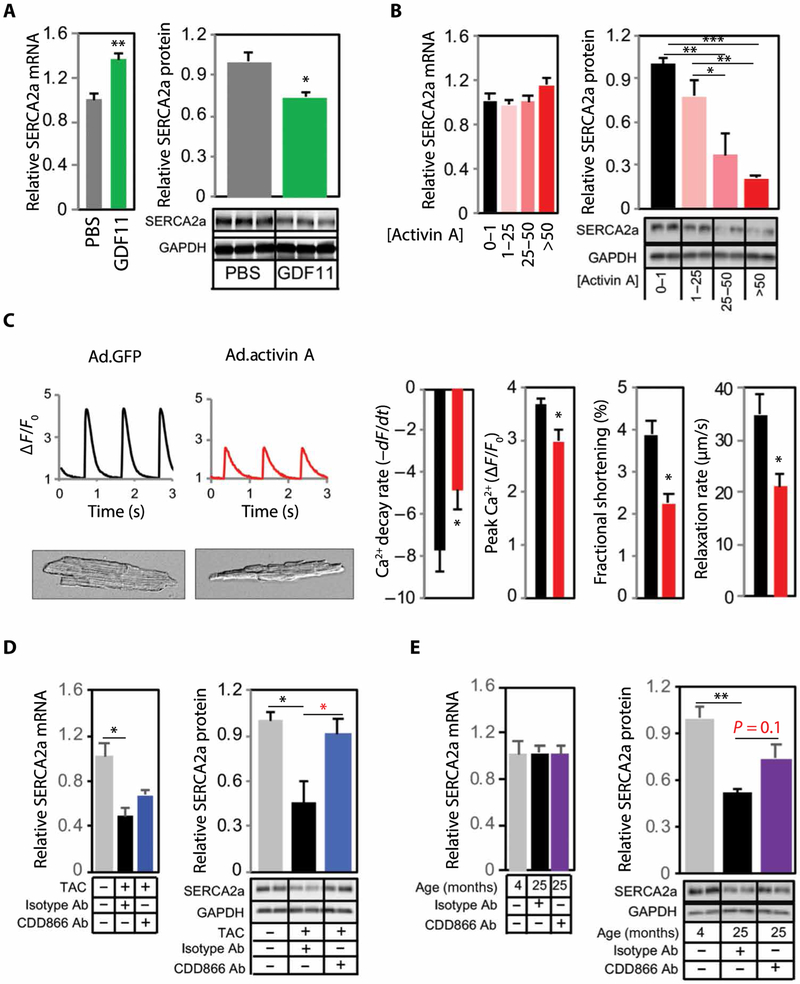
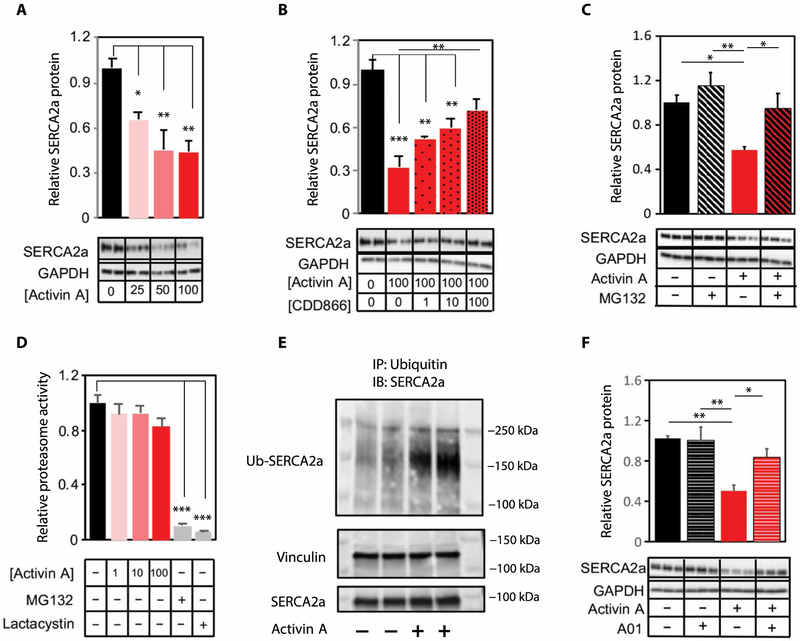
Activin type II receptor (ActRII) ligands have been implicated in muscle wasting in aging and disease. However, the role of these ligands and ActRII signaling in the heart remains unclear. Here, we investigated this catabolic pathway in human aging and heart failure (HF) using circulating follistatin-like 3 (FSTL3) as a potential indicator of systemic ActRII activity. FSTL3 is a downstream regulator of ActRII signaling, whose expression is up-regulated by the major ActRII ligands, activin A, circulating growth differentiation factor-8 (GDF8), and GDF11. In humans, we found that circulating FSTL3 increased with aging, frailty, and HF severity, correlating with an increase in circulating activins. In mice, increasing circulating activin A increased cardiac ActRII signaling and FSTL3 expression, as well as impaired cardiac function. Conversely, ActRII blockade with either clinical-stage inhibitors or genetic ablation reduced cardiac ActRII signaling while restoring or preserving cardiac function in multiple models of HF induced by aging, sarcomere mutation, or pressure overload. Using unbiased RNA sequencing, we show that activin A, GDF8, and GDF11 all induce a similar pathologic profile associated with up-regulation of the proteasome pathway in mammalian cardiomyocytes. The E3 ubiquitin ligase, Smurf1, was identified as a key downstream effector of activin-mediated ActRII signaling, which increased proteasome-dependent degradation of sarcoplasmic reticulum Ca2+ ATPase (SERCA2a), a critical determinant of cardiomyocyte function. Together, our findings suggest that increased activin/ActRII signaling links aging and HF pathobiology and that targeted inhibition of this catabolic pathway holds promise as a therapeutic strategy for multiple forms of HF.


Figures

Fig. 1.
Fig. 1.. Circulating FSTL3 and activins increase in human aging and HF.
(A) Linear regression of plasma FSTL3, activin, GDF8 + GDF11, and TGFβ with increasing quintiles (Q) of age in the FHS cohort [Q1, 29 to 47 years (n = 172); Q2, 47 to 52 years (n = 183); Q3, 53 to 59 years (n = 181); Q4, 60 to 65 years (n = 184); Q5, 66 to 82 years (n = 179)]. Data are shown as means ± SEM. (B) Partial Pearson’s correlations of FSTL3 with activin, GDF8 + GDF11, and TGFβ in the FHS cohort. (C) Linear regression of plasma FSTL3 with age, NYHA class, or NT-proBNP in the AS/HF cohort (n = 50). (D) Linear regression of plasma activins with age, NYHA class, or NT-proBNP in the AS/HF cohort. (E) Plasma FSTL3 and activin A concentrations [measured by enzyme-linked immunosorbent assay (ELISA)] in an independent cohort of older patients with AS phenotyped for frailty (n = 43). Data are shown as means ± SEM. **P < 0.01 by Mann-Whitney test. In (A) to (D), proteins measured with SomaLogic aptamers and displayed as log-transformed relative fluorescence units (RFU). Protein measurements are sex-adjusted when plotted against age, otherwise age and sex adjusted.
Fig. 2.
Fig. 2.. Circulating activin A and cardiac ActRII signaling increase in murine aging and LV pressure overload.
(A to C) Comparison of young (4 months; gray) versus old (28 months; red) C57BL/6 males. (A) Plasma activin A concentrations in young (n = 6) versus old (n = 9). (B) Relative cardiac mRNA expression of ActRII ligands, TGFβ, and FSTL3 in young (n = 4) versus old (n = 8). (C) Representative immunoblot and relative quantification of cardiac p-Smad3 and total Smad3 expression in young (n = 4) versus old (n = 4). (D to F) Comparison of 4-month-old C57BL/6 males 1 week after Sham versus TAC surgery. n = 3 per group for all analyses. (D) Plasma activin A concentrations. (E) Relative cardiac mRNA expression of ActRII ligands, TGFb, and FSTL3. (F) Representative immunoblot and relative quantification of cardiac p-Smad3 and total Smad3 expression. For all panels, data are shown as means ± SEM. *P < 0.05, **P < 0.01 by Student’s t test.
Fig. 3.
Fig. 3.. Increased circulating ActRII ligands are sufficient to induce cardiac dysfunction.
(A to F) Young (4 months) C57BL/6 males injected with either Ad.GFP (black) or Ad.activin A (red). n = 4 per group for all analyses. (A) Plasma activin A concentration 96 hours after infection. (B) Relative cardiac mRNA expression of ActRII ligands and FSTL3. (C) Immunoblot and relative quantification of cardiac p-Smad3/Smad3. (D) Fractional shortening (FS) by echocardiography. (E) Representative echocardiographic strain images and quantification of radial systolic strain and early diastolic strain rates. (F) Lung weight normalized to body weight. (G to I) Old (24 months) C57BL/6 males treated with daily intraperitoneal injections of phosphate-buffered saline (PBS) (n = 8; gray) versus GDF11 (0.1 mg/kg) (n = 8; green) for 28 days. Two mice died before study completion. (G) Immunoblot and relative quantification of cardiac p-Smad3/Smad3. n = 5 per group. (H) Echocardiographic FS, radial strain, and strain rate analyses. n = 6 to 7 per group. (I) Lung weight/body weight and exercise capacity. n = 7 per group. For all panels, data are shown as means ± SEM. *P < 0.05, **P < 0.01, ***P < 0.001 by Student’s t test.
Fig. 4.
Fig. 4.. ActRII pathway inhibition improves systolic function in age-related HF in mice.
(A) Schematic depicting ActRII pathway inhibitors used. (B to E) Old (24 months) C57BL/6 males treated with weekly injection of isotype (O-I; n = 6; black) versus CDD866 (O-C; n = 7; purple) for 4 weeks. Young (4 months) C57BL/6 males (Y; n = 12; striped) used for comparison in cardiac functional testing. (B) Representative immunoblot and relative quantification of cardiac p-Smad3/Smad3. n = 6 per group. (C) HF phenotyping. Lung weight normalized to body weight. Percentage change in exercise capacity (compared to pretreatment). n = 6 to 7 per group. (D) Resting cardiac function (% FS strain analyses) by echocardiography. n = 5 to 12 per group. (E) Cardiac reserves at peak exercise. n = 5 to 12 per group. (F and G) Old (21 to 23 months) MHCF764L mice (mixed genders) treated with isotype (n = 3; black) versus CDD866 (n = 5; purple) for 4 weeks. (F) Representative immunoblot and relative quantification of cardiac p-Smad3/Smad3. n = 3 per group. (G) Representative echocardiographic images and the FS at baseline and 4 weeks. n = 3 to 5 per group. (H) Old (18 to 20 months) MHCF764L mice (mixed genders) treated with vehicle (n = 6; black) versus RAP-031 (n = 6; blue). FS at baseline and 4 weeks. Data in all panels are shown as means ± SEM. *P < 0.05, **P < 0.01, ***P < 0.001 by Student’s t test (B, C, and F), one-way analysis of variance (ANOVA) with post hoc Tukey (D and E), and two-way ANOVA with post hoc Sidak (G and H).
Fig. 5.
Fig. 5.. ActRII inhibition improves systolic function in TAC.
(A to H) Prevention study. Weekly treatment (isotype versus CDD866) started 1 week before surgery (Sham versus TAC). n = 10 per group. (A) Prevention protocol. Sac, sacrifice. (B) Serial FS over 10 weeks. Analysis displayed for TAC-isotype versus TAC-CDD866. n = 5 to 10 per group per time point. (C) Representative echocardiographic images at 10 weeks. (D) Relative cardiac FSTL3 mRNA expression. n = 6 to 9 per group. (E) Heart weight normalized to body weight. n = 8 to 10 per group. (F) Gene expression profile of pathologic hypertrophy. n = 6 to 9 per group. (G) Lung weight normalized to body weight. n = 8 to 10 per group. (H) Mantel-Cox survival curve (mortality, natural death or euthanasia due to FS ≤ 20%). (I to N) Treatment study. Weekly treatment (isotype, n = 5, versus CDD866, n = 7) started after FS < 45%. n = 5 to 7 per group for all analyses. (I) Treatment protocol. (J) Serial FS over 10 weeks. (K) Relative cardiac FSTL3 mRNA expression. (L) Heart/body weight. (M) Gene expression profile of pathologic hypertrophy. (N) Lung/body weight. (O to T) CS-ActRIIB-KO TAC study. ActRIIBflox/flox (n = 6) and CS-ActRIIB-KO (n = 5) mice subjected to TAC for 12 weeks. n = 5 to 6 per group for analyses. (O) CS-ActRIIB-KO TAC protocol. (P) Serial FS over 12 weeks. (Q) Relative cardiac FSTL3 mRNA expression. (R) Heart/body weight. (S) Gene expression profile of pathologic hypertrophy. (T) Lung/body weight. Data are shown as means ± SEM. *P < 0.05, **P < 0.01, ***P < 0.001 by one-way ANOVA with post hoc Tukey (C to G), two-way ANOVA with post hoc Tukey (B), Student’s t test (K to N and Q to T), and two-way ANOVA with post hoc Sidak (J and P).
Fig. 6.
Fig. 6.. ActRII ligands induce similar pathologic profile in mammalian CMs.
NRVMs incubated with GDF11, GDF8, or activin A (100 ng/ml) for 18 hours. n = 3 per group. (A) Heat map of most highly differentially expressed genes [log2(FC) > 2; Padj < 0.05]. (B) Venn diagrams of differentially regulated pathways (false discovery rate, <0.25). (C) Enrichment scores of most highly differentially regulated pathways by all three ligands. TCA, tricarboxylic acid.
Fig. 7.
Fig. 7.. ActRII signaling modulates SERCA2a expression in the heart.
(A) Relative cardiac SERCA2a mRNA and protein expression in old (24 months) C57BL/6 from GDF11 substudy (Fig. 3). n = 5 to 6 per group. GAPDH, glyceraldehyde-3-phosphate dehydrogenase. (B) Relative cardiac SERCA2a mRNA and protein expression in 4-month-old C57BL/6 infected with Ad.GFP (black) versus Ad.activin A (pink red). Quartiles based on plasma activin A concentrations (nanograms per milliliter) at 96 hours. n = 4 per group. (C) Adult CMs isolated from mice infected with Ad.GFP (n = 3; black) versus Ad.activin A (n = 5; red). Representative images and Ca2+ flux curves and quantification of Ca2+ decay rate (from 25 to 75% diastole), peak Ca2+, contractility (FS), and relaxation rate (from 25 to 75% diastole). n = 7 to 24 CM per mouse. Data are shown as average CM per mouse. (D) Relative cardiac SERCA2a mRNA and protein expression in 4-month-old C57BL/6 subjected to TAC and treated with isotype (n = 7; black) versus CDD866 (n = 8; blue) for 1 week after FS of <45%. No surgery control (n = 4; gray). (E) Relative cardiac SERCA2a mRNA and protein expression in old (24 months) C57BL/6 treated with isotype (n = 4; black) versus CDD866 (n = 4; purple) for 4 weeks. Untreated young control (4 months; n = 4; gray). Data are shown as means ± SEM. *P < 0.05, **P < 0.01, ***P < 0.001 by Student’s t test (A and C) and one-way ANOVA with post hoc Tukey (B, D, and E).
Fig. 8.
Fig. 8.. Activin/ActRII signaling modulates proteasome-mediated SERCA2a degradation via E3 ligase Smurf1.
Representative immunoblot and quantification of relative SERCA2a protein content in NRVMs incubated with (A) activin A (0 to 100 ng/ml), n = 2 to 3 per group (repeated three times)]; (B) activin A (0 ng/ml versus 100 ng/ml) and CDD866 (0 to 100 μg/ml), n = 3 per group; or (C) activin A (0 ng/ml versus 100 ng/ml) and MG132 (0 μM versus 10 μM), n = 3 per group (repeated three times). (D) Proteasome activity in NRVM incubated with activin A (0 to 100 ng/ml). n = 2 to 3 per group (repeated two times). Proteasome inhibitors, MG132, and lactacystin were used as internal controls. (E) Top: Representative immunoblot (IB) of ubiquitinated (Ub) SERCA2a. Bottom: SERCA2a and vinculin immunoblots from same lysates without immunoprecipitation (IP) . (F) Representative immunoblot and quantification of relative SERCA2a protein in NRVMs incubated with activin A (0 ng/ml versus 100 ng/ml) and Smurf1 inhibitor A01 (0 uM versus 10 uM). n = 3 per group (repeated three times). All inhibitor experiments were performed with 6-hour pretreatment with inhibitors (CDD866, MG132, or A01), followed by 18-hour activin A incubation. IP (E) was done with a 1-hour activin A incubation. Data are shown as means ± SEM and were calculated from average of replicate experiments. *P < 0.05, **P < 0.01, ***P < 0.001 by one-way ANOVA with post hoc Tukey (A, B, C, and F) or Dunnett (D).

Comment in

Similar articles

Cited by

References

    1. Bui AL, Horwich TB, Fonarow GC, Epidemiology and risk profile of heart failure. Nat. Rev. Cardiol 8, 30–41 (2011). - PMC - PubMed
    1. Lüscher TF, Heart failure subgroups: HFrEF, HFmrEF, and HFpEF with or without mitral regurgitation. Eur. Heart J 39, 1–4 (2018). - PubMed
    1. Shah KS, Xu H, Matsouaka RA, Bhatt DL, Heidenreich PA, Hernandez AF, Devore AD, Yancy CW, Fonarow GC, Heart failure with preserved, borderline, and reduced ejection fraction: 5-year outcomes. J. Am. Coll. Cardiol 70, 2476–2486 (2017). - PubMed
    1. Loffredo FS, Steinhauser ML, Jay SM, Gannon J, Pancoast JR, Yalamanchi P, Sinha M, Dall’Osso C, Khong D, Shadrach JL, Miller CM, Singer BS, Stewart A, Psychogios N, Gerszten RE, Hartigan AJ, Kim M-J, Serwold T, Wagers AJ, Lee RT, Growth differentiation factor 11 is a circulating factor that reverses age-related cardiac hypertrophy. Cell 153, 828–839 (2013). - PMC - PubMed
    1. Olson KA, Beatty AL, Heidecker B, Regan MC, Brody EN, Foreman T, Kato S, Mehler RE, Singer BS, Hveem K, Dalen H, Sterling DG, Lawn RM, Schiller NB, Williams SA, Whooley MA, Ganz P, Association of growth differentiation factor 11/8, putative anti-ageing factor, with cardiovascular outcomes and overall mortality in humans: Analysis of the heart and soul and HUNT3 cohorts. Eur. Heart J 36, 3426–3434 (2015). - PMC - PubMed

Publication types

MeSH terms