. 2019 Mar 6;10(1):1091.
doi: 10.1038/s41467-019-08997-2.

Ecological niche modelling does not support climatically-driven dinosaur diversity decline before the Cretaceous/Paleogene mass extinction

Affiliations

Ecological niche modelling does not support climatically-driven dinosaur diversity decline before the Cretaceous/Paleogene mass extinction

Alfio Alessandro Chiarenza et al. Nat Commun. .

Abstract

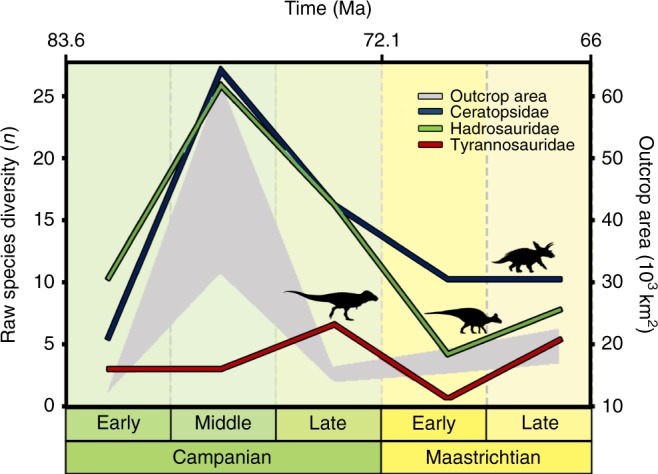
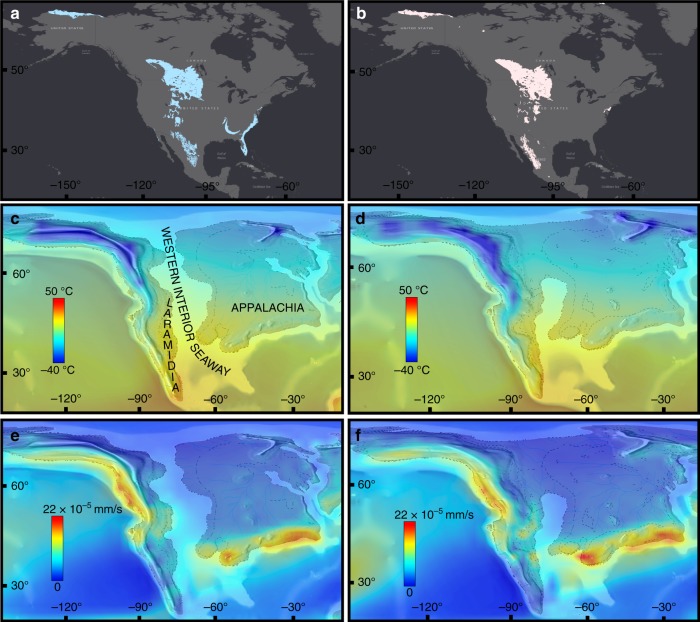
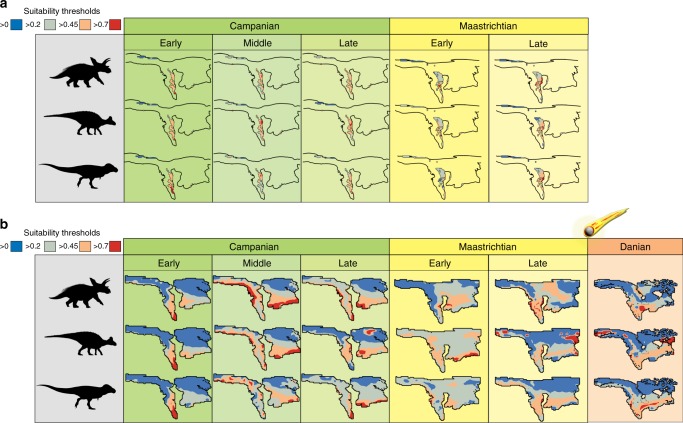
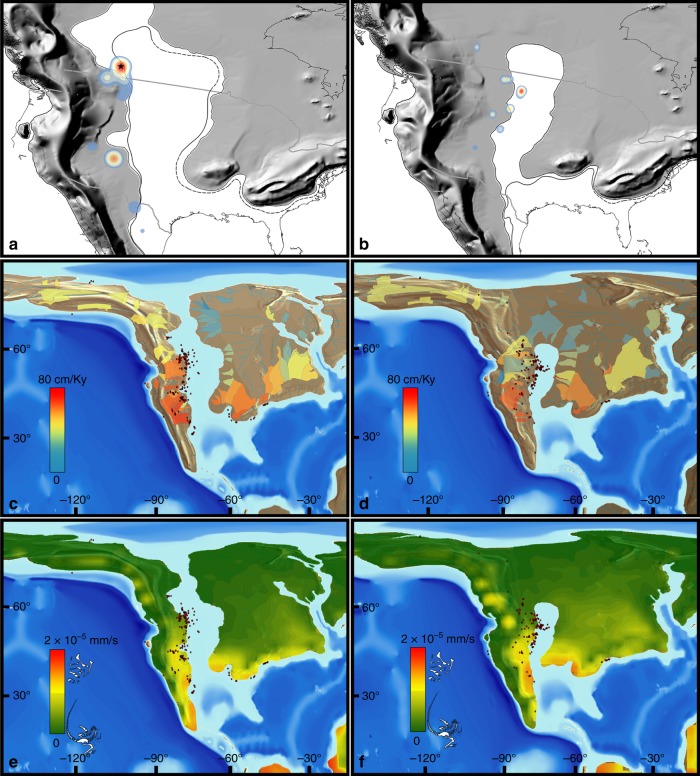
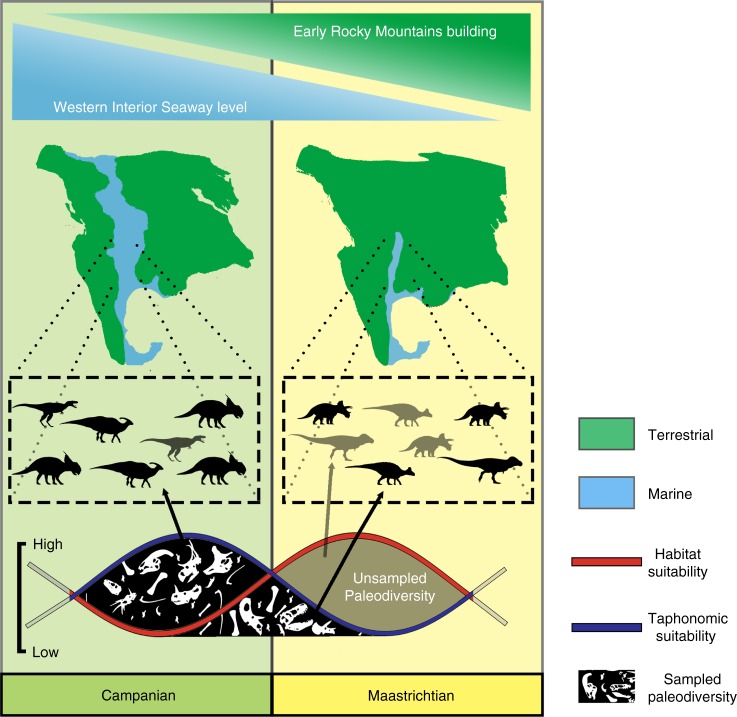
In the lead-up to the Cretaceous/Paleogene mass extinction, dinosaur diversity is argued to have been either in long-term decline, or thriving until their sudden demise. The latest Cretaceous (Campanian-Maastrichtian [83-66 Ma]) of North America provides the best record to address this debate, but even here diversity reconstructions are biased by uneven sampling. Here we combine fossil occurrences with climatic and environmental modelling to quantify latest Cretaceous North American dinosaur habitat. Ecological niche modelling shows a Campanian-to-Maastrichtian habitability decrease in areas with present-day rock-outcrop. However, a continent-wide projection demonstrates habitat stability, or even a Campanian-to-Maastrichtian increase, that is not preserved. This reduction of the spatial sampling window resulted from formation of the proto-Rocky Mountains and sea-level regression. We suggest that Maastrichtian North American dinosaur diversity is therefore likely to be underestimated, with the apparent decline a product of sampling bias, and not due to a climatically-driven decrease in habitability as previously hypothesised.


Conflict of interest statement

The authors declare no competing interests.

Figures

Fig. 1
Fig. 1
Raw diversity trends for the three clades of dinosaurs in this study plotted against outcrop exposure area. The plot shows the apparent correlation of this sampling proxy with diversity curves for these clades of dinosaurs (Ceratopsidae, Hadrosauridae, and Tyrannosauridae). Tyrannosauridae silhouette by Jack Mayer Wood (CC BY 3.0 license: https://creativecommons.org/licenses/by/3.0/ CC BY 3.0); Hadrosauridae silhouette by Pete Buchholz (under CC BY-SA 3.0 license: https://creativecommons.org/licenses/by-sa/3.0/); and Ceratopsidae silhouette by Mariana Ruiz (modified by T. Michael Keesey) under the Public Domain Mark 1.0
Fig. 2
Fig. 2
Environmental layers used as raw data for this study. Outcrop of Campanian (a) and Maastrichtian (b) aged terrestrial sedimentary units in North America. Palaeoclimatic outputs from a General Circulation Model configured to the Late Cretaceous (Lunt et al.) with modelled near-surface (1.5 m) annual mean air temperatures (°C) for the Campanian (c) and Maastrichtian (d). Annual mean precipitation (mm/s) for the Campanian (e) and Maastrichtian (f). Model outputs have been bilineary interpolated. All the environmental predictors and the statistical operations to select them can be found in Supplementary Note 1
Fig. 3
Fig. 3
Ecological niche models for the three major clades of non-avian dinosaurs in the latest Cretaceous of North America. From top to bottom: Ceratopsidae, Hadrosauridae, and Tyrannosauridae. Niche dynamics in outcrop areas (a) show a progressive decrease of high-suitability areas (orange and red) towards the Maastrichtian compared to unsuitable areas (blue) while overall niche stability or increase is shown in a continental setting (b). Tyrannosauridae silhouette by Jack Mayer Wood (CC BY 3.0 license: https://creativecommons.org/licenses/by/3.0/ CC BY 3.0); Hadrosauridae silhouette by Pete Buchholz (under CC BY-SA 3.0 license: https://creativecommons.org/licenses/by-sa/3.0/); and Ceratopsidae silhouette by Mariana Ruiz (modified by T. Michael Keesey) under the Public Domain Mark 1.0
Fig. 4
Fig. 4
Time-bin quantification of habitat suitability of ecological niche models. Quantification is shown for only outcrop area (a) and for the whole latest Cretaceous North American palaeocontinent (b). Both sets of models have been trained with the same extent (outcrop area), but while a shows quantification in training region, plot in b shows original models projected to North America. Thick line represents higher suitability threshold quantification (>0.7), while thinner line is lower suitability threshold one (>0.45). An overall decrease in habitat suitability in available outcrop areas is shown in a while an increase is obtained for all the three clades in North America (b). Orange column in b represents habitat stability when niche models are projected after the K/Pg boundary, showing potential habitability for these clades after the end-Cretaceous mass extinction. Numeric values on the y-axes are in 105 km2 in a and 106 km2 in b. Numeric values to build this figure are in Supplementary Table 1 and Supplementary Table 2. Tyrannosauridae silhouette by Jack Mayer Wood (CC BY 3.0 license: https://creativecommons.org/licenses/by/3.0/ CC BY 3.0); Hadrosauridae silhouette by Pete Buchholz (under CC BY-SA 3.0 license: https://creativecommons.org/licenses/by-sa/3.0/); and Ceratopsidae silhouette by Mariana Ruiz (modified by T. Michael Keesey) under the Public Domain Mark 1.0
Fig. 5
Fig. 5
Virtual taphofacies and hotspot analysis in the latest Cretaceous of North America. Kernel density in the Campanian (a) and Maastrichtian (b), with red representing highest-density and blue low-density hotspots. Grey line representing country boundaries overlaid on palaeogeographies. Black dashed line represents sea-level lowstand. Star in a is Dinosaur Provincial Park. Sediment fluxes (cm/ky) calculated using basin drainage tools (see Methods section) in the Campanian (c) and Maastrichtian (d). Surface runoff (mm/s) models overlaid spatially in the Campanian (e) and Maastrichtian (f). Red dots represent dinosaur occurrences (data points in the middle of the Western Interior Seaway are there because they are associated with lowstand phases). Brown and grey colours represent underlying topography of the digital elevation models. Dinosaur skeletons in figure legends redrawn by A.A.C.
Fig. 6
Fig. 6
Conceptual integration of the results from niche modelling and geological modelling of fossil occurrences. Eustatic (blue shaded bar on top) and tectonic (top green shaded bar) drive the distribution of depositional environment affecting fossil preservation. Campanian palaeogeography (left) fosters increased and more widespread preservation of fossil communities than the Maastrichtian (right) due to the higher accommodation space provided by the highstand of the Western Interior Seaway (left) than during the late Maastrichtian regressive phase (right). On the other hand, the latter time interval (right) may have provided equal if not greater habitable space in terrestrial areas, which are not captured by the geologic record. Diagram at the bottom shows how a high Maastrichtian habitat suitability (red line) is not in phase with the lower preservation potential of this stage, causing lower taphonomic suitability than in the Campanian. This combination of conditions provide a depauperate raw diversity record for non-avian dinosaurs towards the K/Pg. Chasmosaurinae silhouette by Mariana Ruiz (modified by T. Michael Keesey) under the Public Domain Mark 1.0. Saurolophinae silhouette by Pete Buchholz (under CC BY-SA 3.0 license: https://creativecommons.org/licenses/by-sa/3.0/); Tyrannosaurinae silhouette by Jack Mayer Wood (CC BY 3.0: https://creativecommons.org/licenses/by/3.0/ CC BY 3.0); Centrosaurinae silhouette by Andrew A. Farke (under CC BY 3.0: https://creativecommons.org/licenses/by/3.0/); Lambeosaurinae silhouette by Jack Mayer Wood (under CC0 1.0); and Albertosaurinae silhouette by Craig Dylke (under CC0 1.0)

References

    1. Sloan, et al. Gradual dinosaur extinction and simultaneous ungulate radiation in the Hell Creek Formation. Science. 1986;232:629–633. - PubMed
    1. Dodson P. Counting dinosaurs: how many kinds were there? Proc. Natl Acad. Sci. USA. 1990;87:7608–7612. - PMC - PubMed
    1. Wang SC, Dodson P. Estimating the diversity of dinosaurs. Proc. Natl Acad. Sci. USA. 2006;103:13601–13605. - PMC - PubMed
    1. Upchurch P, et al. Geological and anthropogenic controls on the sampling of the terrestrial fossil record: a case study from the Dinosauria. Geol. Soc. Lond. Spec. Publ. 2011;358:209–240.
    1. Brusatte SL, et al. The extinction of the dinosaurs. Biol. Rev. 2015;90:628–642. - PubMed

Publication types