. 2019 Mar 6;10(1):1076.
doi: 10.1038/s41467-019-09046-8.

Neutrophils promote the development of reparative macrophages mediated by ROS to orchestrate liver repair

Affiliations

Neutrophils promote the development of reparative macrophages mediated by ROS to orchestrate liver repair

Wenting Yang et al. Nat Commun. .

Abstract

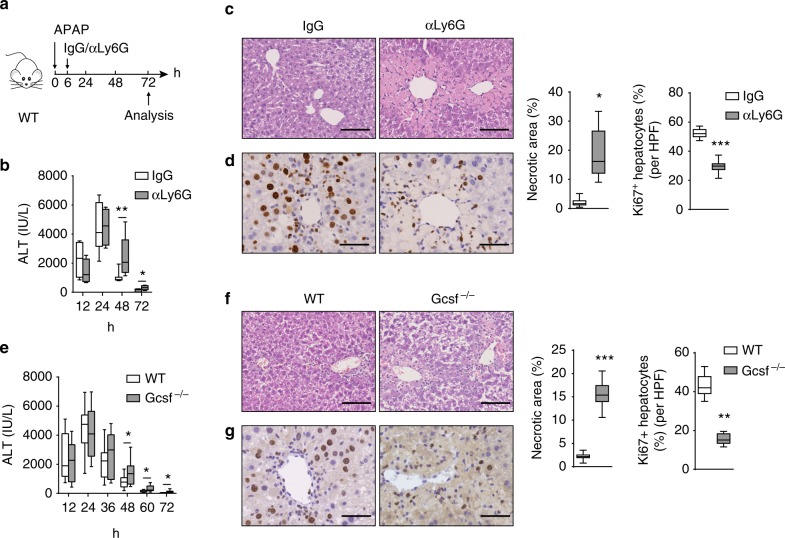
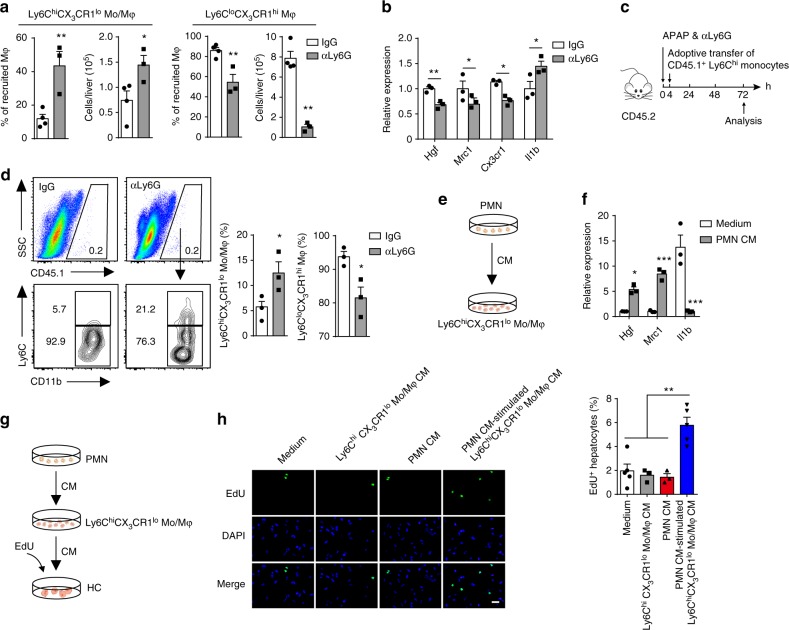
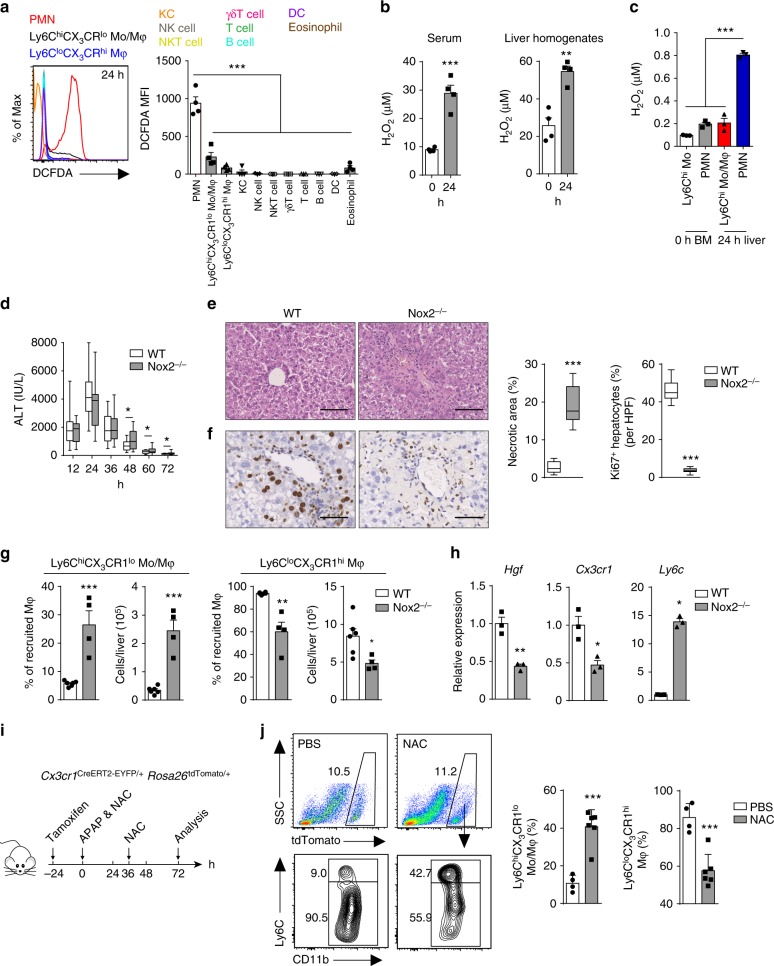
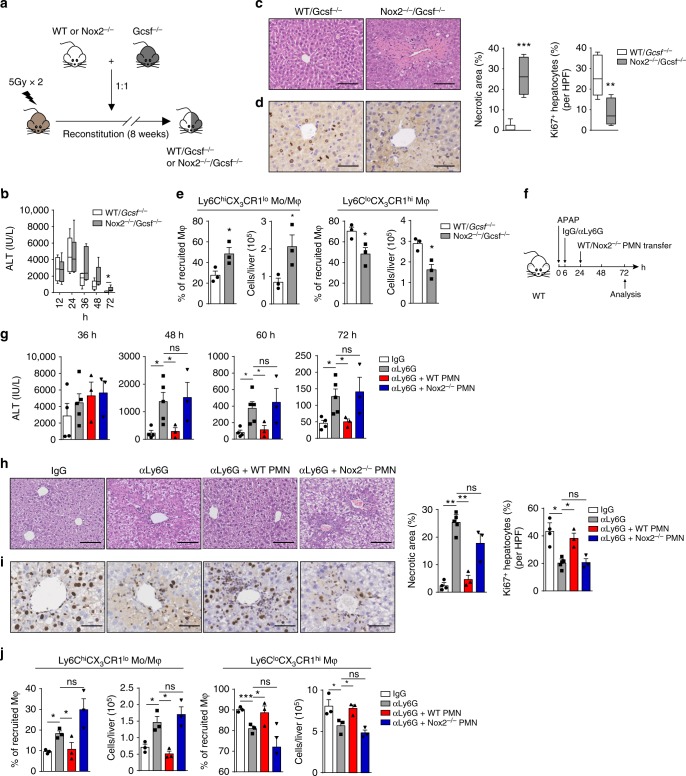
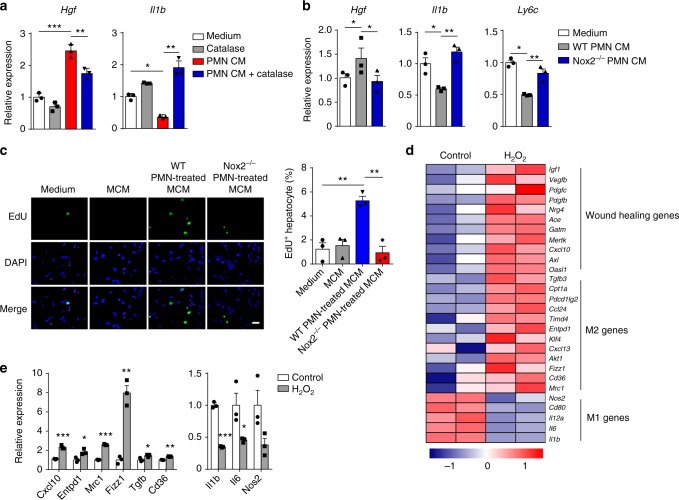
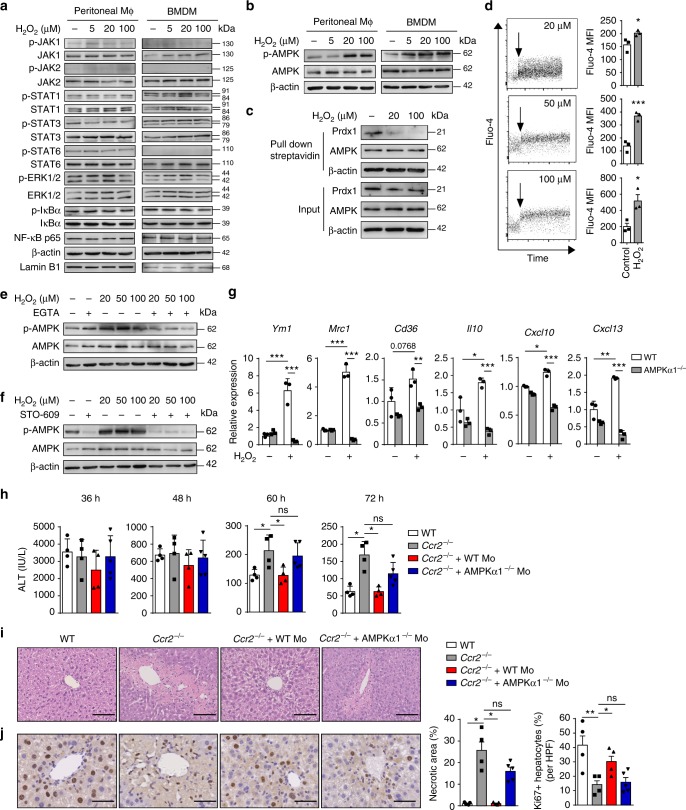
Phagocytes, including neutrophils and macrophages, have been suggested to function in a cooperative way in the initial phase of inflammatory responses, but their interaction and integration in the resolution of inflammation and tissue repair remain unclear. Here we show that neutrophils have crucial functions in liver repair by promoting the phenotypic conversion of pro-inflammatory Ly6ChiCX3CR1lo monocytes/macrophages to pro-resolving Ly6CloCX3CR1hi macrophages. Intriguingly, reactive oxygen species (ROS), expressed predominantly by neutrophils, are important mediators that trigger this phenotypic conversion to promote liver repair. Moreover, this conversion is prevented by the depletion of neutrophils via anti-Ly6G antibody, genetic deficiency of granulocyte colony-stimulating factor, or genetic deficiency of NADPH oxidase 2 (Nox2). By contrast, adoptive transfer of WT rather than Nox2-/- neutrophils rescues the impaired phenotypic conversion of macrophages in neutrophil-depleted mice. Our findings thus identify an intricate cooperation between neutrophils and macrophages that orchestrate resolution of inflammation and tissue repair.


Conflict of interest statement

The authors declare no competing interests.

Figures

Fig. 1
Fig. 1
Neutrophils contribute to liver repair after acute injury. ad Schematic of the experimental design. a Mice were treated with the neutrophil-depleting anti-Ly6G mAb or an isotype control (IgG) at 6 h after APAP challenge. Serum ALT levels at each time point (b), histological characterization (c), and IHC staining for Ki67 (d) in liver sections at 72 h were evaluated. Percentage of necrotic areas and Ki67 positive hepatocytes per high-powered field (HPF) were also quantified. n = 5. Experiment was repeated three times. eg WT and Gcsf−/− mice were challenged with APAP. Serum ALT levels at each time point (e), histological characterization (f), and IHC staining for Ki67 (g) in liver sections at 72 h are shown. n = 13, 12. The data are pooled from two independent experiments. The bar graph indicates 100 μm (c, f), 50 μm (d, g). Whiskers show min to max. Bars show the median (*P < 0.05, **P < 0.01, ***P < 0.001). P values were calculated by two-tailed Student’s t-test (bg)
Fig. 2
Fig. 2
Neutrophils mediate development of reparative macrophages. a, b Mice were treated with anti-Ly6G mAb or IgG at 6 h after APAP challenge. The percentage and number of the indicated macrophage subsets at 72 h were determined (a). n = 4, 3. Experiment was repeated three times. Gene expression in 72 h hepatic monocyte-derived macrophages following neutrophil depletion was measured by qPCR, presented relative to Gapdh (b). n = 3. Experiment was repeated three times. c, d Schematic of the experimental design: CD115+Ly6Chi monocytes enriched with CD45.1 mice were adoptively transferred into neutrophil-depleted CD45.2 mice at 4 h after APAP challenge (c). The transferred CD45.1+ monocytes in the livers of recipient mice harvested at 72 h were identified (d). n = 3. Experiment was repeated twice. e, f Schematic of the experimental design: 24 h Ly6ChiCX3CR1lo monocytes/macrophages were exposed to the conditioned medium (CM) of 24 h hepatic neutrophils (e). The expression of the indicated genes in Ly6ChiCX3CR1lo monocytes/macrophages was detected by qPCR (f). n = 3. Experiment was repeated three times. g, h Schematic of the experimental design: Hepatocyte proliferation was induced with the supernatants from 24 h Ly6ChiCX3CR1lo monocytes/macrophages that had been co-cultured with the CM of 24 h neutrophils compared to the supernatants from the 24 h Ly6ChiCX3CR1lo monocytes/macrophages or neutrophils cultured alone (g). Hepatocytes undergoing DNA synthesis after co-culture were visualized using a EdU Imaging Kit. The EdU-positive cells were then quantified (h). The bar graph indicates 50 μm. n = 5, 3, 3, 5. Experiment was repeated twice. The results represent mean ± s.e.m. (*P < 0.05, **P < 0.01, ***P < 0.001). P values were calculated by two-tailed Student’s t-test (a, b, d, f) and one-way ANOVA (h)
Fig. 3
Fig. 3
ROS facilitate liver repair through regulating macrophage skewing in vivo. a Flow cytometric analysis of CM-H2DCFDA staining for ROS in the indicated cell types at 24 h after APAP challenge. MFI, mean fluorescence intensity. n = 4. Experiment was repeated three times. b The levels of H2O2 in serum and liver homogenates were determined. n = 4. Experiment was repeated twice. c The extracellular ROS concentrations from Ly6Chi monocytes (Mo) and neutrophils in the bone marrow (BM) of untreated mice, and hepatic 24 h Ly6ChiCX3CR1lo monocytes/macrophages and neutrophils of APAP-treated mice were measured. n = 3. Experiment was repeated three times. df WT and Nox2−/− mice were challenged with APAP. Serum ALT levels at each time point (d), H&E staining (e), and IHC staining for Ki67 (f) in liver sections at 72 h were evaluated. n = 17, 21. The data shown are pooled from three independent experiments. Whiskers show min to max. Bars show the median. g, h The percentage and number of the indicated macrophage subsets among the total hepatic recruited macrophages at 72 h were determined (g). n = 6, 4. Gene expression in 72 h hepatic monocyte-derived macrophages was measured by qPCR (h). n = 3. Experiment was repeated three times. i, j Schematic of the experimental design: Cx3cr1CreERT2-EYFP/+Rosa26tdTomato/+ mice were given tamoxifen via oral gavage 1 day before APAP challenge. Cx3cr1CreERT2-EYFP/+Rosa26tdTomato/+ mice also received two doses of NAC with a separation of 36 h between doses to block ROS (i). Representative flow cytometry analysis of Ly6C expression on CD11b+tdTomato+ cells in the livers of PBS- or NAC-treated mice at 72 h post APAP challenge (j). n = 4, 6. Experiment was repeated twice. The bar graph indicates 100 μm (e), 50 μm (f). The data shown are mean ± s.e.m. (*P < 0.05, **P < 0.01, ***P < 0.001). P values were calculated by one-way ANOVA (a, c) and two-tailed Student’s t-test (b, dh, j)
Fig. 4
Fig. 4
ROS-producing neutrophils permit macrophage skewing toward a reparative phenotype. ae Schematic of the experimental design: mixed bone marrow chimera mice were generated by reconstituting lethally irradiated WT recipients with 50% WT + 50% Gcsf−/− or 50% Nox2−/− + 50% Gcsf−/− bone marrow cells (total transplanted cells were 107 cells per mouse) (a). Chimera mice were challenged with APAP. Serum ALT levels at the indicated time points (b), histological characterization (c), and IHC staining for Ki67 (d) in liver sections at 72 h were evaluated. n = 6. Whiskers show min to max. Bars show the median. The percentage and number of the indicated macrophage subsets at 72 h were calculated (e). n = 3. Experiment was repeated twice. fj Schematic of the experimental design: WT mice were treated with neutrophil-depleting anti-Ly6G mAb at 6 h after APAP challenge; WT or Nox2−/− neutrophils were adoptively transferred to the anti-Ly6G-treated mice at 24 h post APAP challenge (f). Serum ALT levels at the indicated time points (g), histological characterization (h), and IHC staining for Ki67 (i) in liver sections at 72 h were evaluated. n = 4, 5, 3, 3. The percentage and number of the indicated macrophage subsets at 72 h were calculated (j). n = 3. Experiment was repeated twice. The bar graph indicates 100 μm (c, h), 50 μm (d, i). The data shown are mean ± s.e.m. (*P < 0.05, **P < 0.01, ***P < 0.001). P values were calculated by two-tailed Student’s t-test (ce, gj)
Fig. 5
Fig. 5
ROS mediate phenotypic conversion of pro-inflammatory macrophages ex vivo. a The 24 h Ly6ChiCX3CR1lo monocytes/macrophages were co-cultured with CM from 24 h neutrophils in the absence or presence of catalase for 6 h. The expression of the indicated genes was measured by qPCR. n = 3. Experiment was repeated twice. b The 24 h Ly6ChiCX3CR1lo monocytes/macrophages were co-cultured with CM from 24 h WT or Nox2−/− neutrophils for 6 h. The expression of the indicated genes was measured by qPCR. n = 3. Experiment was repeated twice. c Hepatocyte proliferation was induced by the CM from the 24 h Ly6ChiCX3CR1lo monocytes/macrophages (MCM) that had been exposed to CM from 24 h WT or Nox2−/− neutrophils. Representative images of hepatocytes pulsed with EdU (left panel) and the quantification of hepatocyte proliferation (right panel). Scale bar, 50 μm. n = 3. Experiment was repeated twice. d Peritoneal macrophages were treated with LPS (100 ng ml−1) for 3 h to polarize into pro-inflammatory phenotype and then were stimulated with 20 μM H2O2 for 4 h. Heatmap showing differential expression of the indicated genes in H2O2-treated macrophages as compared to control macrophages. Row-based Z-score normalized. e Expression of the indicated genes in H2O2-treated or untreated macrophages were determined by qPCR. n = 3. Experiment was repeated twice. The results represent mean ± s.e.m. (*P < 0.05, **P < 0.01, ***P < 0.001). P values were calculated by two-tailed Student’s t-test (a, b, e) and one-way ANOVA (c)
Fig. 6
Fig. 6
ROS promote activation of AMPK in macrophages to orchestrate liver repair. ac Peritoneal macrophages or BMDMs were treated with LPS for 3 h and then were stimulated with different concentrations of H2O2 for 30 min. Immunoblot analysis of phosphorylated (p-) or total protein in lysates of macrophages and nuclear translocation of NF-κB in nuclear extracts of macrophages (a, b). Cellular proteins from peritoneal macrophages were incubated with BIAM. Protein-BIAM adducts were purified using streptavidin pull-down and then subjected to immunoblot analysis (c). Experiment was repeated three times. d Ca2+ influx into macrophages after exposure to different concentrations of H2O2, represented by Fluo-4 intensity. n = 3. Experiment was repeated three times. e, f Effect of removal of extracellular Ca2+ by EGTA (2 mM) (e), or inhibition of CaMKKβ by STO-609 (5 μM) (f) on phosphorylation of AMPK in peritoneal macrophages after 30 min H2O2 exposure. Experiment was repeated three times. g WT and AMPKα1−/− BMDMs were treated with LPS for 3 h, and then incubated with 20 μM H2O2 for 4 h. Expression of the indicated genes in H2O2-treated or untreated macrophages were determined by qPCR. n = 3. Experiment was repeated twice. h, i WT or AMPKα1−/− monocytes were adoptively transferred to APAP-challenged Ccr2−/− mice. Serum ALT levels at the indicated time points (h), histological characterization (i), and IHC staining for Ki67 (j) in liver sections at 72 h were evaluated. n = 4, 4, 4, 5. Experiment was repeated twice. The bar graph indicates 100 μm (i), 50 μm (j). The results represent mean ± s.e.m. (*P < 0.05, **P < 0.01, ***P < 0.001). P values were calculated by two-tailed Student’s t-test (d, g, hj). Uncropped scans of western blots are shown in Supplementary Fig. 8

References

    1. Soehnlein O, Lindbom L. Phagocyte partnership during the onset and resolution of inflammation. Nat. Rev. Immunol. 2010;10:427–439. doi: 10.1038/nri2779. - DOI - PubMed
    1. Kolaczkowska E, Kubes P. Neutrophil recruitment and function in health and inflammation. Nat. Rev. Immunol. 2013;13:159–175. doi: 10.1038/nri3399. - DOI - PubMed
    1. Sugimoto MA, Sousa LP, Pinho V, Perretti M, Teixeira MM. Resolution of inflammation: what Ccntrols its onset? Front. Immunol. 2016;7:160. doi: 10.3389/fimmu.2016.00160. - DOI - PMC - PubMed
    1. Buckley CD, Gilroy DW, Serhan CN. Proresolving lipid mediators and mechanisms in the resolution of acute inflammation. Immunity. 2014;40:315–327. doi: 10.1016/j.immuni.2014.02.009. - DOI - PMC - PubMed
    1. Serhan CN. Pro-resolving lipid mediators are leads for resolution physiology. Nature. 2014;510:92–101. doi: 10.1038/nature13479. - DOI - PMC - PubMed

Publication types

MeSH terms