. 2019 Mar;567(7747):249-252.
doi: 10.1038/s41586-019-1004-y. Epub 2019 Mar 6.

Hepatocytes direct the formation of a pro-metastatic niche in the liver

Affiliations

Hepatocytes direct the formation of a pro-metastatic niche in the liver

Jae W Lee et al. Nature. 2019 Mar.

Abstract

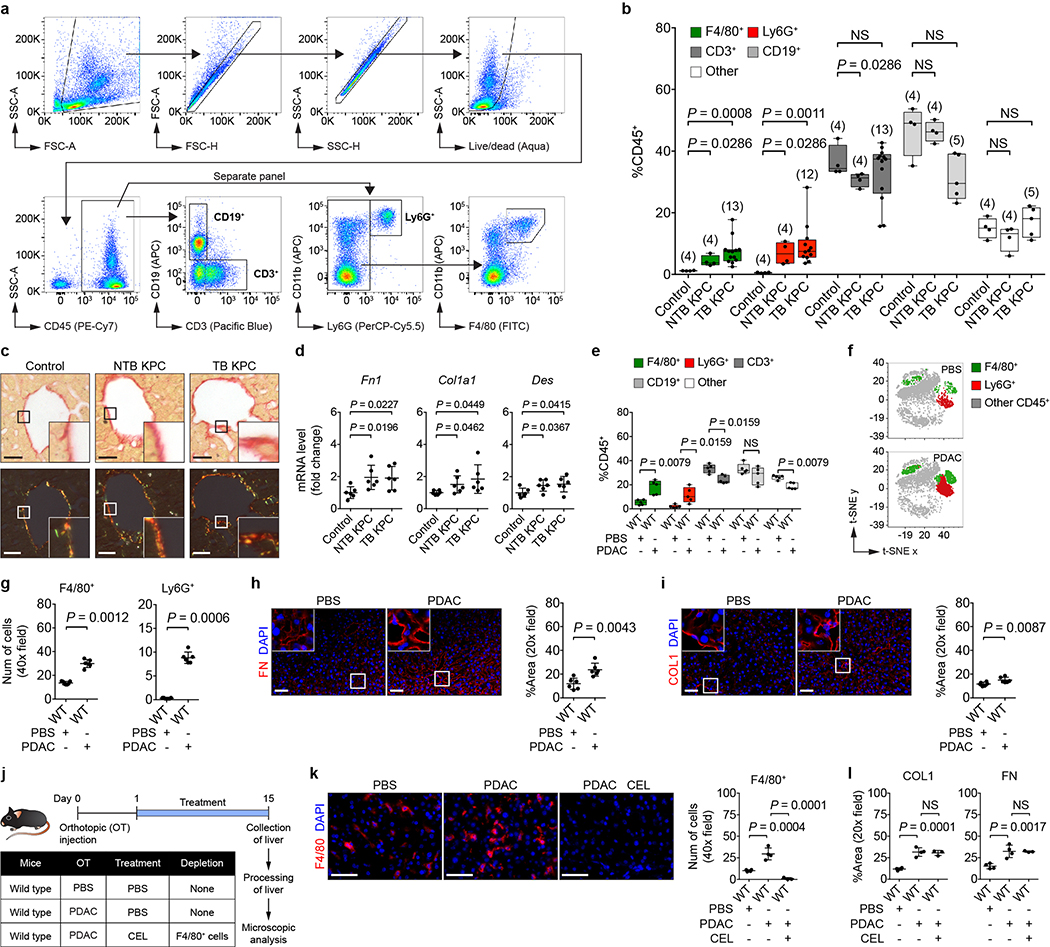
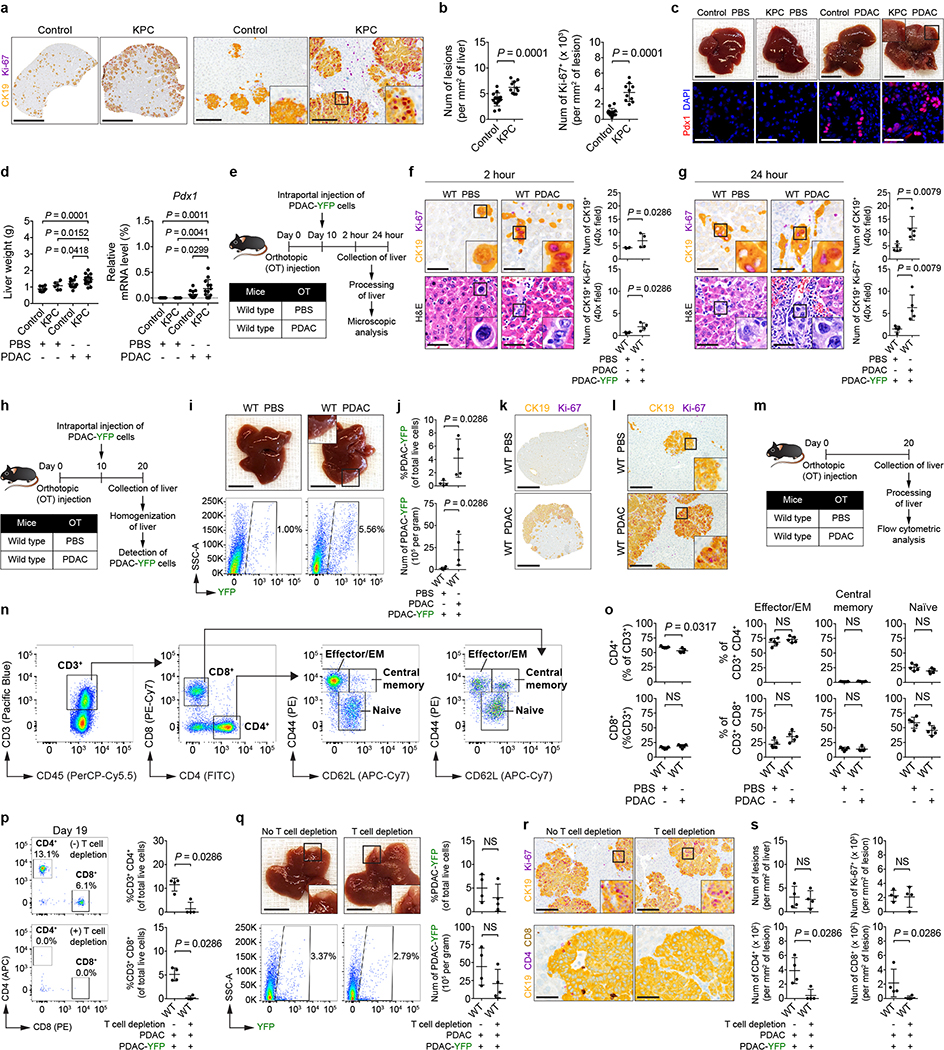
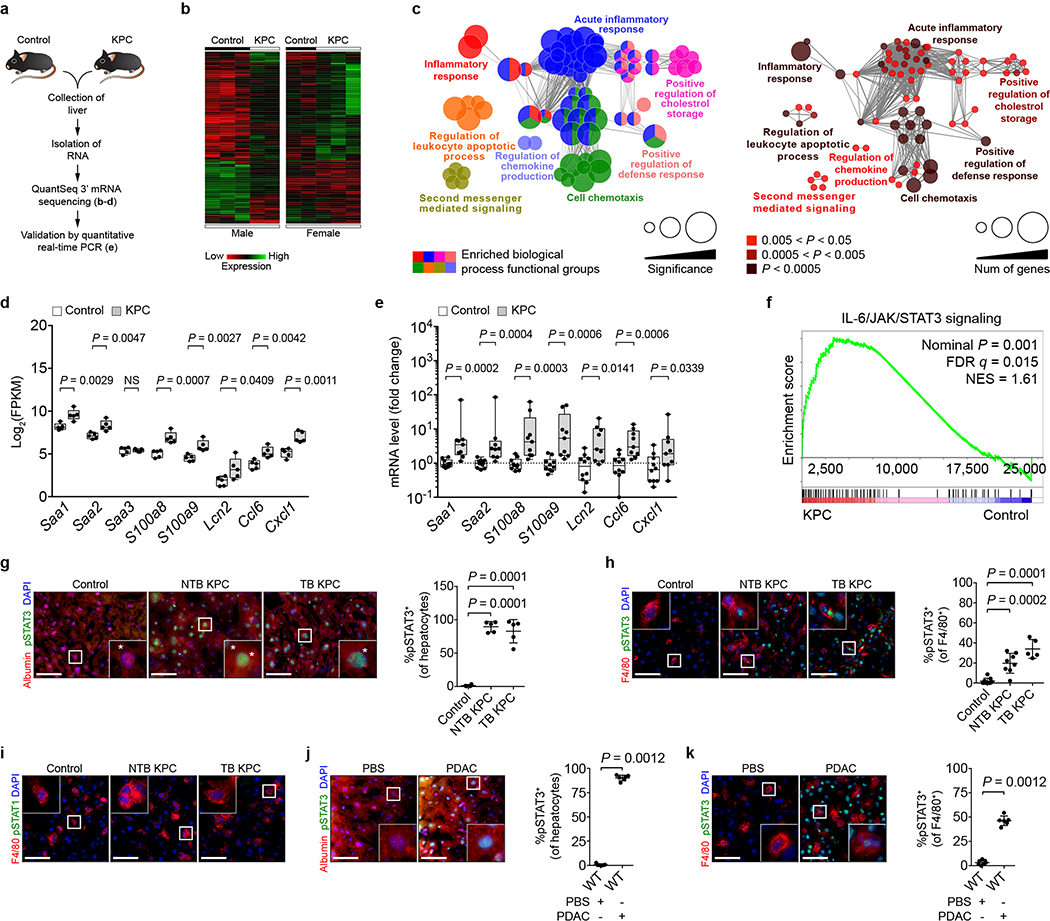
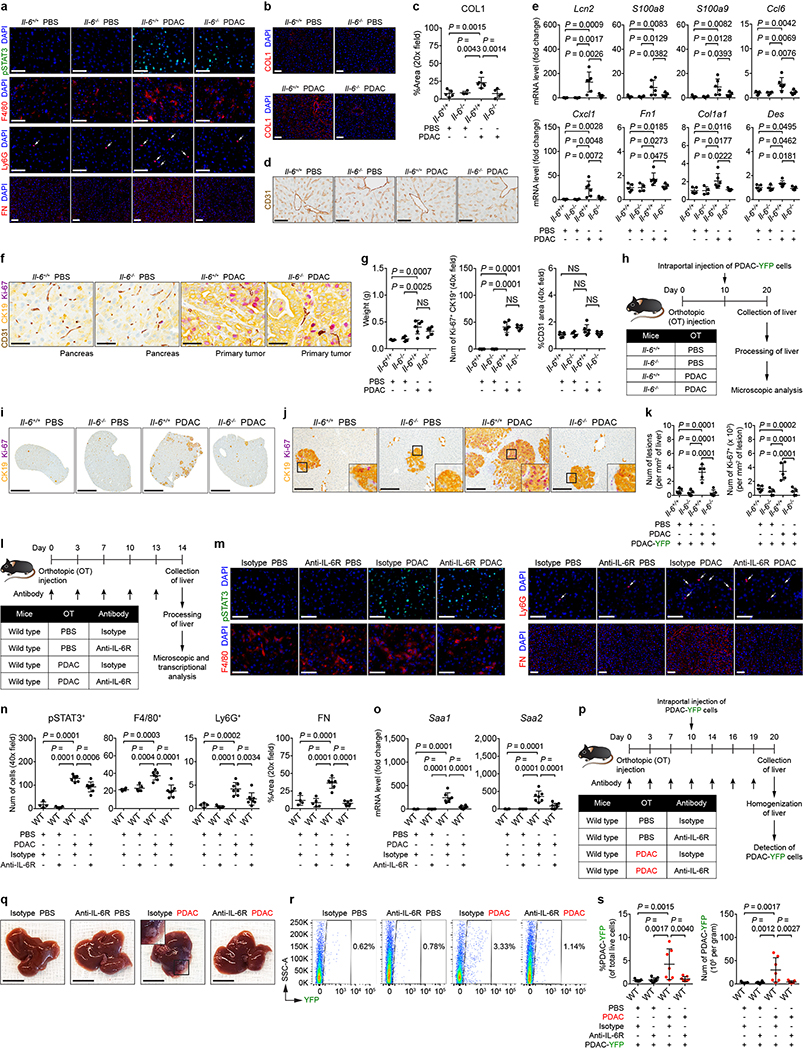
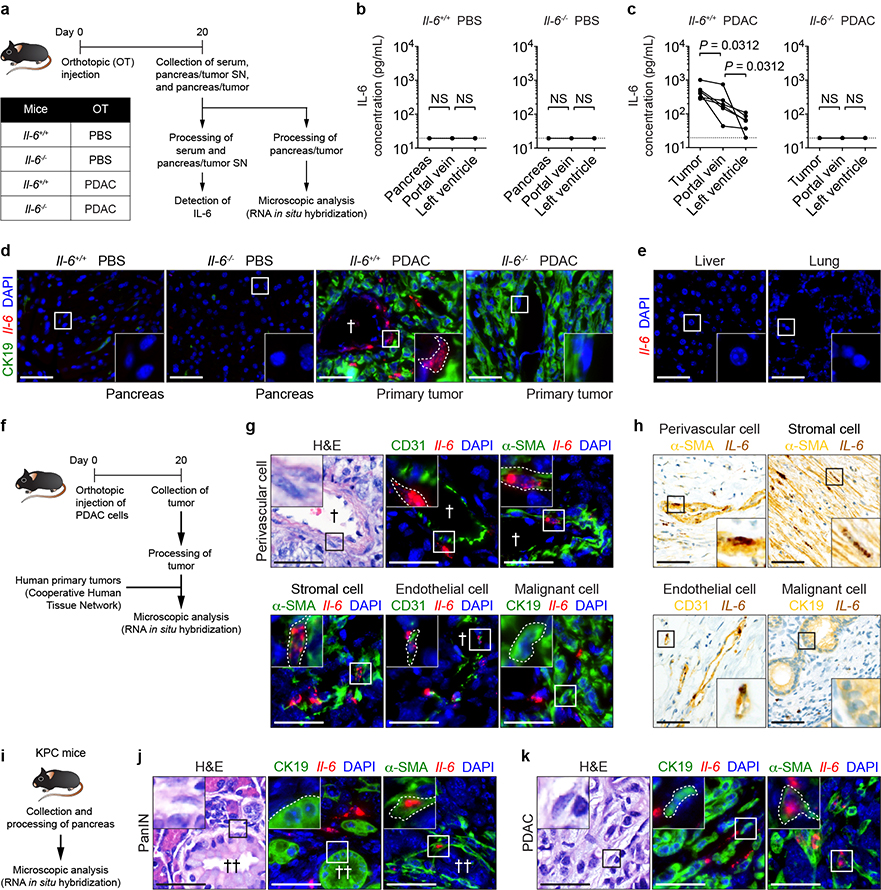
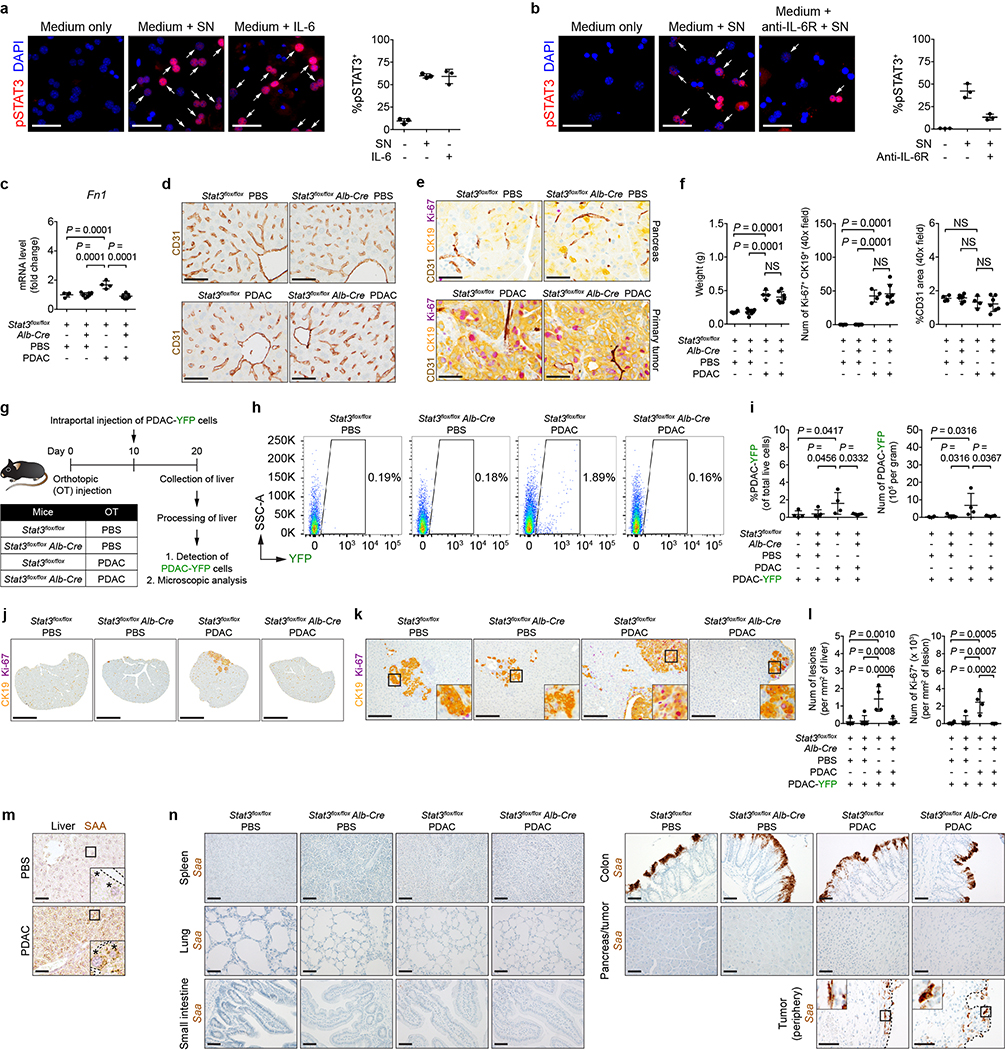
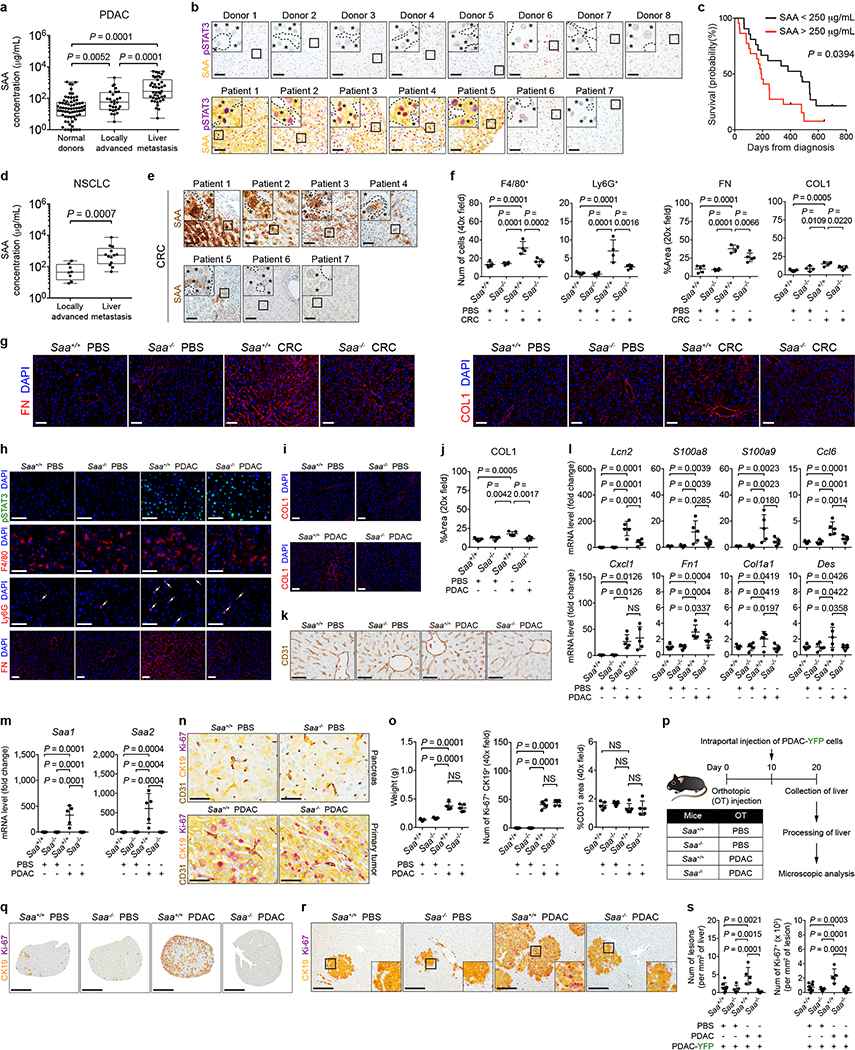
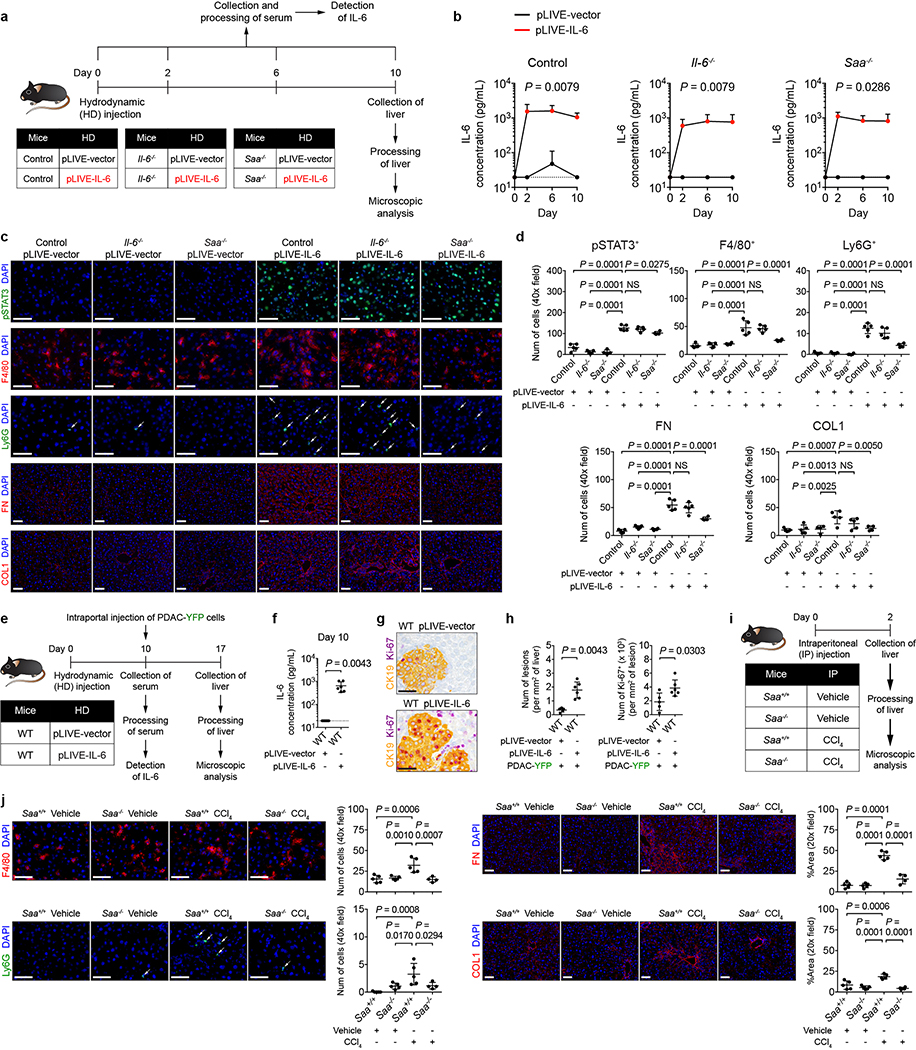
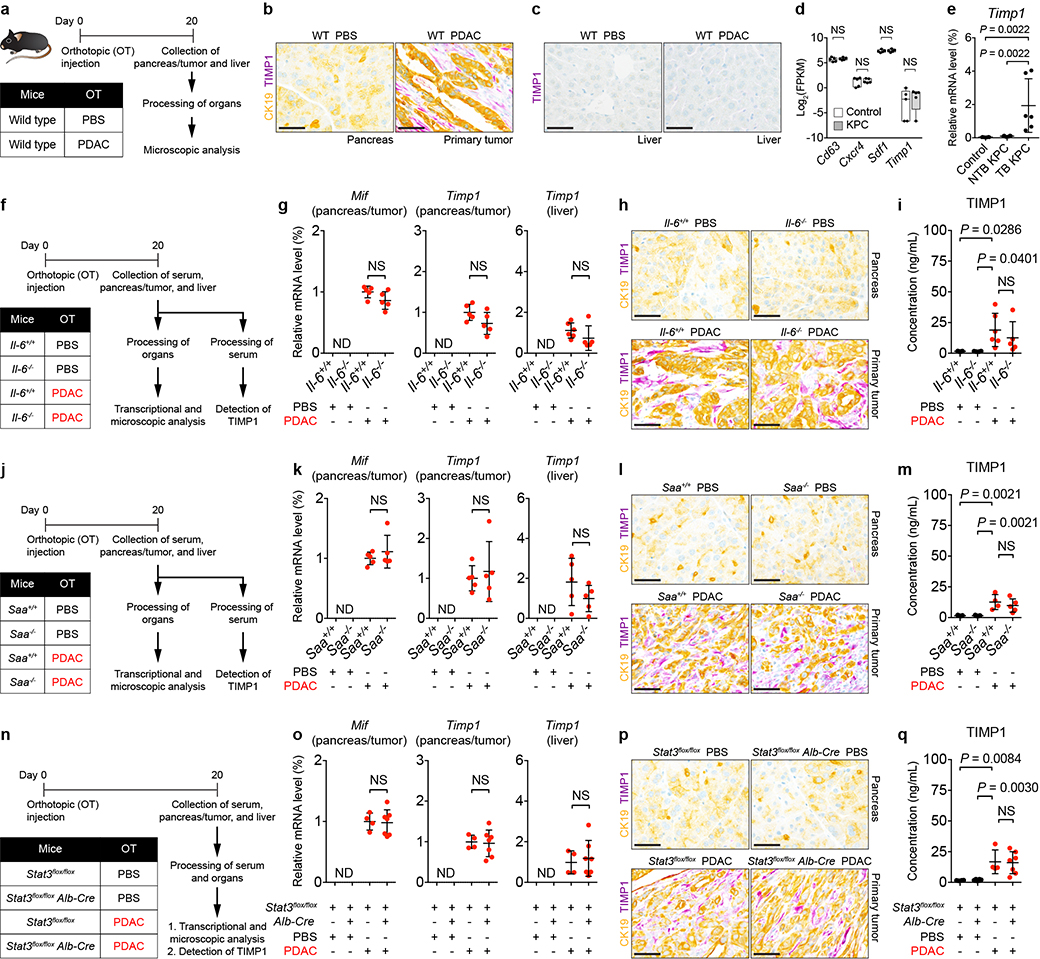
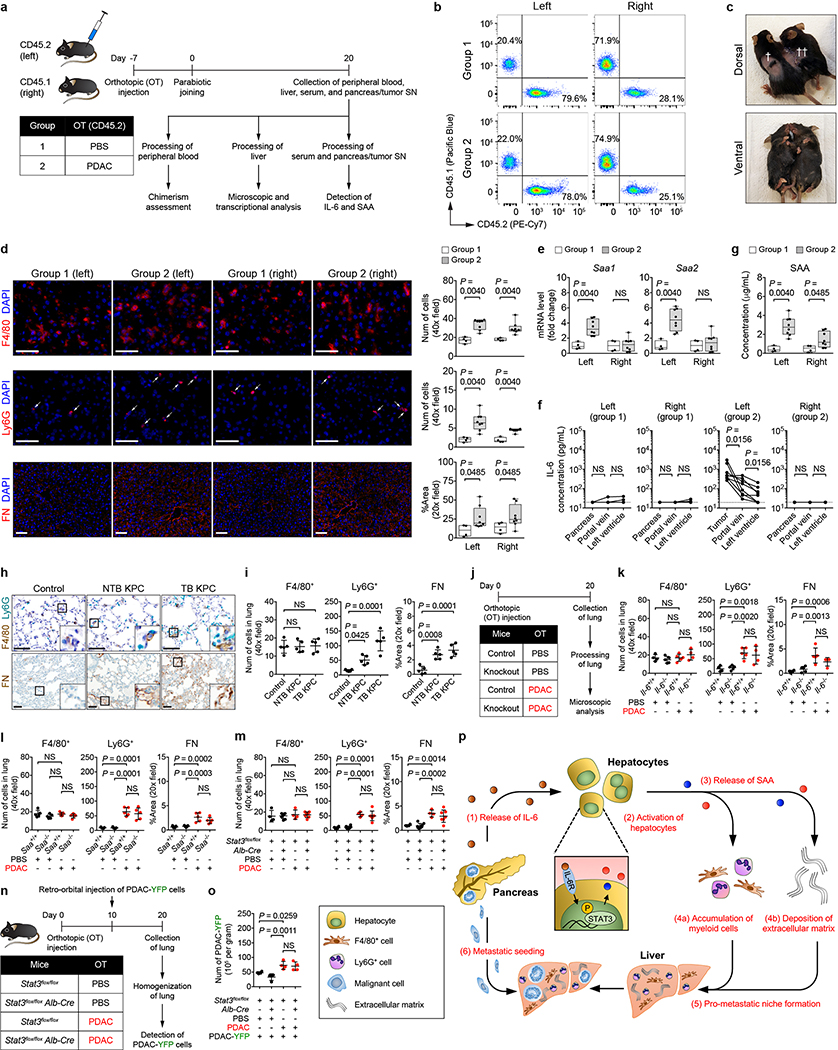
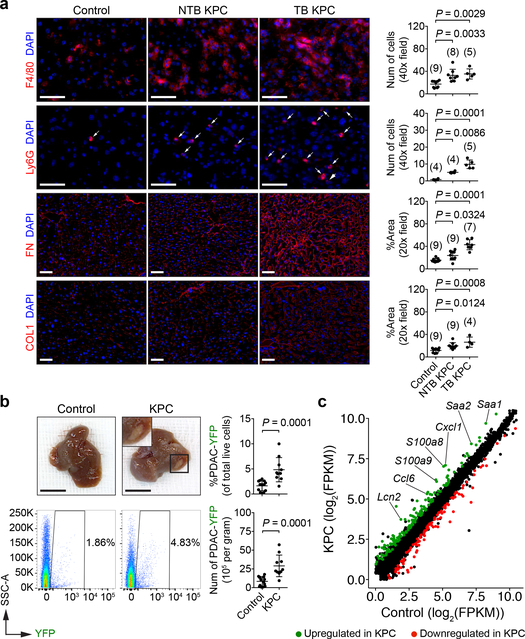
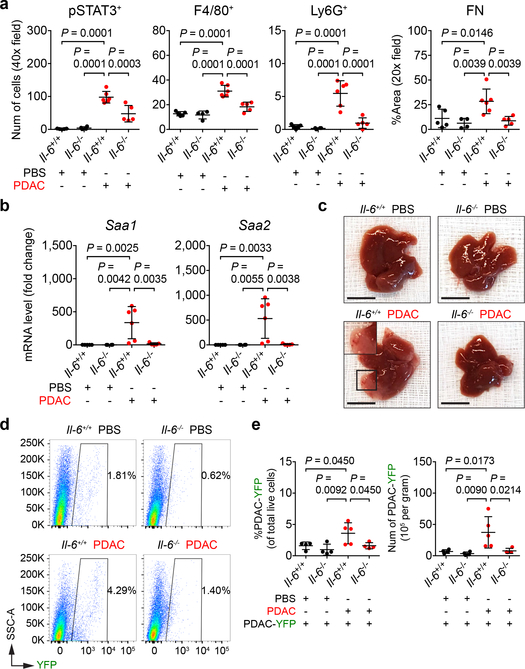
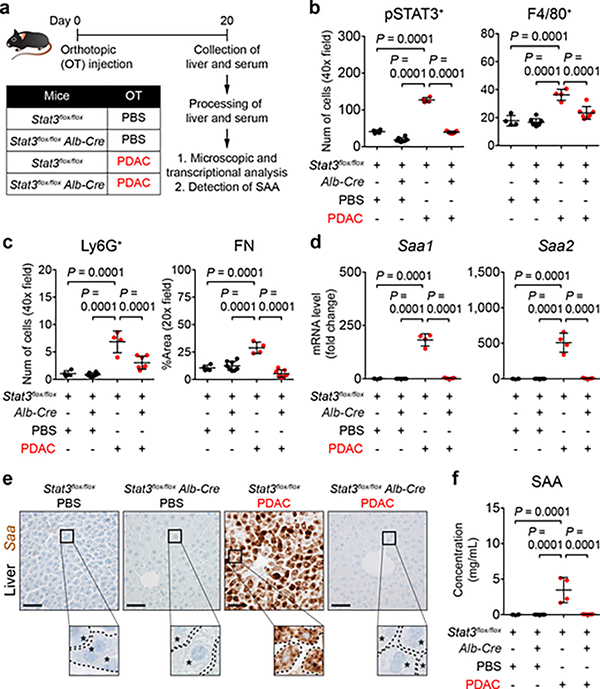
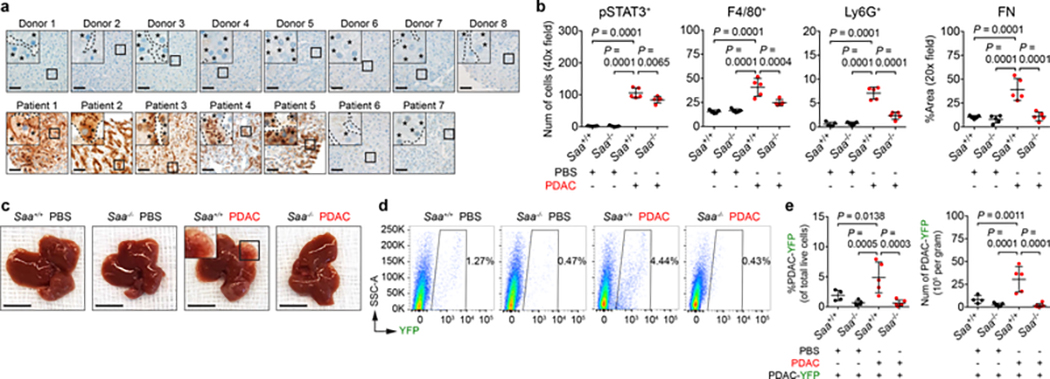
The liver is the most common site of metastatic disease1. Although this metastatic tropism may reflect the mechanical trapping of circulating tumour cells, liver metastasis is also dependent, at least in part, on the formation of a 'pro-metastatic' niche that supports the spread of tumour cells to the liver2,3. The mechanisms that direct the formation of this niche are poorly understood. Here we show that hepatocytes coordinate myeloid cell accumulation and fibrosis within the liver and, in doing so, increase the susceptibility of the liver to metastatic seeding and outgrowth. During early pancreatic tumorigenesis in mice, hepatocytes show activation of signal transducer and activator of transcription 3 (STAT3) signalling and increased production of serum amyloid A1 and A2 (referred to collectively as SAA). Overexpression of SAA by hepatocytes also occurs in patients with pancreatic and colorectal cancers that have metastasized to the liver, and many patients with locally advanced and metastatic disease show increases in circulating SAA. Activation of STAT3 in hepatocytes and the subsequent production of SAA depend on the release of interleukin 6 (IL-6) into the circulation by non-malignant cells. Genetic ablation or blockade of components of IL-6-STAT3-SAA signalling prevents the establishment of a pro-metastatic niche and inhibits liver metastasis. Our data identify an intercellular network underpinned by hepatocytes that forms the basis of a pro-metastatic niche in the liver, and identify new therapeutic targets.


Conflict of interest statement

The authors have no competing financial interests.

Figures

Extended Data Figure 1 |
Extended Data Figure 1 |. Primary PDAC development induces myeloid cell accumulation and fibrosis within the liver.
a, Gating strategy for identification of F4/80+, Ly6G+, CD3+, and CD19+ cells. Representative images from flow cytometric analysis of cells isolated from the liver of a TB KPC mouse are shown. b, Quantification of immune cells in the liver by flow cytometry. Numbers in parentheses indicate the number (n) of mice. Data pooled from four experiments. c, Representative Sirius red staining on the liver (n = 5 for all groups) viewed using standard light microscopy (top) and polarized light (bottom). d, mRNA levels of Fn1, Col1a1, and Des in the liver (n = 6 for all groups). Data pooled from two experiments (c, d). For e-i, wild type mice were orthotopically injected with PBS or PDAC cells and analyzed on day 20. e, Quantification of immune cells in the liver by flow cytometry (n = 5 for both groups). f, t-SNE 2D plots of immune cells analyzed in e. g, Quantification of myeloid cells in the liver (n = 7 for PBS and n = 6 for PDAC). h, i, Images and quantification of FN and COL1 in the liver (n = 6 for both groups). Data representative of at least two independent experiments (e-i). j, Study design for k and l (n = 4 for mice injected with PBS; n = 4 and 3 for mice injected with PDAC cells and then intraperitoneally injected with PBS and clodronate-encapsulated liposomes (CEL)). k, Images and quantification of F4/80+ cells in the liver. l, Quantification of COL1 and FN in the liver. Data representative of one experiment (j-l). Scale bars, 100 μm (c) and 50 μm (other panels). Statistical significance was calculated using two-tailed unpaired Student’s t test (d), one-way ANOVA with Dunnett’s test (k, l), and two-tailed Mann-Whitney test (all other panels). NS, not significant. Data represented as mean ± s.d., except b and e, which are shown as box plots (center line, median; box limits, upper and lower quartiles; whiskers, max and min values).
Extended Data Figure 2 |
Extended Data Figure 2 |. Primary PDAC development enhances liver susceptibility to metastatic colonization.
For a and b, control mice (n = 14) and NTB KPC mice (n = 10) were intrasplenically injected with PDAC-YFP cells, and the liver was analyzed after 10 days. a, Images of the liver showing metastatic lesions (yellow, CK19) and Ki-67 (purple). Scale bars, 4 mm (left) and 200 μm (right). b, Quantification of lesions (left) and Ki-67+ tumor cells (right). Data pooled from three experiments (a, b). For c and d, n = 9 and 13 for control mice and n = 6 and 13 for NTB KPC mice intrasplenically injected with PBS and PDAC (PDA.69). c, Images of the liver (top) and metastatic lesions in the liver (stained with Pdx1). Scale bars, 1 cm (top) and 50 μm (bottom). d, Liver weights and mRNA levels of Pdx1 in the liver relative to Gapdh. Data pooled from five experiments (c, d). e, Study design for f and g. Wild type mice were injected with PBS or PDAC cells and then injected with PDAC-YFP cells on day 10. The liver was harvested at 2 hours (j, n = 4 for both groups) or 24 hours (k, n = 5 for both groups) after intraportal injection. f, g, Images and quantification of tumor cells in the liver. Scale bars, 50 μm. Data representative of one experiment (e-g). h, Study design for i-l (n = 4 for both groups). i, Images of the liver and flow cytometric analysis. Scale bars, 1 cm. j, Quantification of PDAC-YFP cells. k, l, Images of the liver showing metastatic lesions (yellow, CK19) and Ki-67 (purple). Scale bars, 4 mm (k) and 200 μm (l). Data representative of at least three independent experiments (h-l). m, Study design for n and o (n = 5 for both groups). n, Gating strategy for identification of T cell subsets. Images from flow cytometric analysis of cells isolated from the liver of a wild type mouse are shown. EM, effector memory. o, Quantification of CD4+ T cell subsets (top) and CD8+ T cell subsets (bottom) in the liver. Data representative of two independent experiments (m-o). For p-s, wild type mice were orthotopically injected with PBS or PDAC cells (n = 4 for both groups). One group received anti-CD4 and anti-CD8 antibodies on days 8 and 13. Both groups were intraportally injected with PDAC-YFP cells on day 10. p, Flow cytometric analysis of the peripheral blood and quantification of CD4+ and CD8+ T cells. q, Images of the liver, flow cytometric analysis, and quantification of PDAC-YFP cells. Scale bars, 1 cm. r, Images of the liver showing metastatic lesions (yellow, CK19), Ki-67 (purple, top), and CD4+ cells (purple) and CD8+ cells (brown, bottom). Scale bars, 200 μm (top) and 50 μm (bottom). s, Quantification of lesions and Ki-67+ tumor cells (top) and CD4+ cells and CD8+ cells (bottom). Data representative of one experiment (p-s). Statistical significance was calculated using one-way ANOVA (d) or two-tailed Mann-Whitney test (all other panels). NS, not significant. Data represented as mean ± s.d.
Extended Data Figure 3 |
Extended Data Figure 3 |. Primary PDAC development induces expression of myeloid chemoattractants and activates STAT3 signaling in the liver.
a, Study design for b-e (n = 5 for both groups for b-d and n = 10 and 9 for control mice and NTB KPC mice for e). b, Heat map. c, Enriched biological processes in the liver of NTB KPC mice. d, FPKM values of chemoattractant genes in the liver. e, mRNA levels of chemoattractant genes in the liver. Data representative of one experiment (a-e). f, Enrichment of IL-6/JAK/STAT3 signaling genes in the liver (n = 5 for control mice and NTB KPC mice). FDR, false discovery rate; NES, normalized enrichment score. Data representative of one experiment. g, Left, images showing hepatocytes (stained for albumin) and pSTAT3. Right, percentage of hepatocytes that are pSTAT3+ in control mice (n = 4), NTB KPC mice (n = 5), and TB KPC mice (n = 5). h, Left, images of F4/80+ cells and pSTAT3. Right, percentage of F4/80+ cells that are pSTAT3+ in control mice (n = 9), NTB KPC mice (n = 8), and TB KPC mice (n = 5). i, Images of F4/80+ cells and pSTAT1 in the liver of control mice (n = 9), NTB KPC mice (n = 8), and TB KPC mice (n = 5). Data pooled from two experiments (g-i). For j and k, wild type mice were orthotopically injected with PBS (n = 7) or PDAC cells (n = 6). j, k, Left, images of hepatocytes (j), F4/80+ cells (k), and pSTAT3. Right, percentage of hepatocytes (j) and F4/80+ cells (k) that are pSTAT3+. Scale bars, 50 μm. Statistical significance was calculated using ClueGO (b, Ref 34), two-tailed unpaired Student’s t test (d), GSEA (f, Ref 38), one-way ANOVA with Dunnett’s test (g, h), and two-tailed Mann-Whitney test (all other panels). NS, not significant. Data represented as mean ± s.d., except d and e, which are shown as box plots (center line, median; box limits, upper and lower quartiles; whiskers, max and min values).
Extended Data Figure 4 |
Extended Data Figure 4 |. IL-6 promotes the formation of a pro-metastatic niche in the liver.
For a-g, n = 5 and 6 for Il-6+/+ mice and n = 4 and 5 for Il-6−/− mice orthotopically injected with PBS or PDAC cells, respectively. a, Images of pSTAT3+ cells, myeloid cells, and FN. Arrows indicate Ly6G+ cells. b, c, Images and quantification of COL1. d, Images of sinusoids (brown, stained with CD31) in the liver. e, mRNA levels of Lcn2, S100a8, S100a9, Ccl6, Cxcl1, Fn1, Col1a1, and Des in the liver. f, Images of the pancreas and primary tumor stained with CD31 (brown), CK19 (yellow), and Ki-67 (purple). g, Quantification of the weight of pancreas/primary tumor (left), number of Ki-67+ tumor cells (middle), and vascular area (right). Data representative of one (b-d, Fn1, Col1a1, and Des in e, f, g) or two independent experiments (a, all other genes in e). h, Study design for i-k (n = 5 for all groups). All groups were injected with PDAC-YFP cells on day 10. i, j, Images of the liver showing metastatic lesions (yellow, CK19) and Ki-67 (purple). Scale bars, 4 mm (i) and 200 μm (j). k, Quantification of lesions (left) and Ki-67+ tumor cells (right). Data representative of one experiment (h-k). l, Study design for m-o (n = 4 and 5 for mice injected with PBS and treated with isotype control or anti-IL-6R antibodies, respectively; n = 7 and 8 for mice injected with PDAC cells and treated with isotype control or anti-IL-6R antibodies, respectively, unless indicated otherwise below). m, n, Images and quantification of pSTAT3+ cells, myeloid cells, and FN. For FN, n = 7 for mice injected with PDAC cells and treated with anti-IL-6R antibodies. Arrows indicate Ly6G+ cells. o, mRNA levels of Saa. p, Study design for q-s (n = 7 and 8 for mice injected with PBS and treated with isotype control and anti-IL-6R antibodies; n = 7 for mice injected with PDAC cells and treated with isotype control and anti-IL-6R antibodies). All groups were injected with PDAC-YFP cells on day 10. q, r, Images of the liver and flow cytometric analysis. Scale bars, 1 cm. s, Quantification of PDAC-YFP cells. Data representative of two independent experiments (l-s). Scale bars, 50 μm unless indicated otherwise. Statistical significance was calculated using one-way ANOVA with Dunnett’s test. NS, not significant. Data represented as mean ± s.d.
Extended Data Figure 5 |
Extended Data Figure 5 |. Non-malignant cells are the predominant source of IL-6.
a, Study design for b-e (n = 5 and 6 for Il-6+/+ mice injected with PBS or PDAC cells, respectively; n = 4 and 5 for Il-6−/− mice injected with PBS or PDAC cells, respectively). SN, supernatant. b, Concentration of IL-6 in pancreas supernatant and serum collected from indicated sites in Il-6+/+ mice injected with PBS or PDAC cells. c, Concentration of IL-6 in pancreatic tumor supernatant and serum collected from indicated sites in Il-6−/− mice injected with PBS or PDAC cells. Solid lines indicate data points from individual mice, and dashed lines indicate the lower limit of detection (b, c). d, Images of CK19 and Il-6 mRNA in the pancreas and primary tumor. e, Images of Il-6 mRNA in the liver and lung of Il-6+/+ mice injected with PDAC cells. Data representative of two independent experiments (a-e). f, Study design for g and h (n = 4 for Il-6+/+ mice injected with PDAC cells and n = 5 for human samples). g, Images of α-SMA, CD31, CK19, and Il-6 mRNA in perivascular cells (top), stromal cells (bottom, left), endothelial cells (bottom, middle) and malignant cells (bottom, right) present within the mouse primary tumor. h, Images of α-SMA (yellow), CD31 (yellow), CK19 (yellow), and IL-6 mRNA (brown) in perivascular cells (top, left), stromal cells (top, right), endothelial cells (bottom, left) and malignant cells (bottom, right) present within the human primary tumor. Data representative of one experiment (f-h). i, Study design for j and k (n = 5). j, k, Representative images of α-SMA, CK19, and Il-6 mRNA detected in PanIN (j) and invasive PDAC (k). Data representative of one experiment (i-k). Scale bars, 50 μm. Statistical significance was calculated using two-tailed Wilcoxon test. NS, not significant. †, blood vessel; ††, PanIN lesion. Data from individual mice are shown in b and c.
Extended Data Figure 6 |
Extended Data Figure 6 |. STAT3 signaling in hepatocytes promotes the formation of a pro-metastatic niche in the liver.
a, b, Representative images and quantification of pSTAT3+ hepatocytes (n = 3 technical replicates per condition). Arrows indicate pSTAT3+ hepatocytes. SN, pancreatic tumor supernatant. Data representative of two independent experiments (a, b). For c-f and n, n = 4 for Stat3flox/flox mice and n = 8 and 7 for Stat3flox/flox Alb-Cre mice orthotopically injected with PBS or PDAC cells, respectively. c, mRNA levels of Fn1 in the liver. d, Images of sinusoids (brown, stained for CD31) in the liver. e, Images of the pancreas and primary tumor stained for CD31 (brown), CK19 (yellow), and Ki-67 (purple). f, Quantification of the weight of pancreas/primary tumor (left), number of Ki-67+ tumor cells (middle), and vascular area (right). Data representative of one experiment (c-f). g, Study design for h-l (n = 4 and 5 for Stat3flox/flox mice and Stat3flox/flox Alb-Cre mice, respectively). All groups were injected with PDAC-YFP cells on day 10. h, Flow cytometric analysis. i, Quantification of PDAC-YFP cells. j, k, Images of the liver showing metastatic lesions (yellow, CK19) and Ki-67 (purple). Scale bars, 4 mm (j) and 200 μm (k). l, Quantification of lesions (left) and Ki-67+ tumor cells (right). Data representative of one experiment (g-l). m, Images of SAA detected by immunohistochemistry (brown, n = 5 for wild type mice orthotopically injected with PBS or PDAC cells). Dashed lines and asterisks indicate sinusoids and hepatocytes, respectively. n, Images of Saa mRNA (brown) detected by RNA in situ hybridization. Data representative of one experiment (m, n). Scale bars, 50 μm unless indicated otherwise. Statistical significance was calculated using one-way ANOVA with Dunnett’s test. NS, not significant. Data represented as mean ± s.d.
Extended Data Figure 7 |
Extended Data Figure 7 |. SAA promotes the formation of a pro-metastatic niche in the liver.
a, Concentration of circulating SAA in normal donors (n = 69), patients with locally advanced PDAC (n = 28), and patients with liver metastases (n = 43). Data represented as a box plot (center line, median; box limits, upper and lower quartiles; whiskers, max and min values). b, Images of SAA (yellow) and pSTAT3 (purple) in the liver of normal donors and PDAC patients with liver metastases. Dashed lines and asterisks indicate sinusoids and hepatocytes, respectively. c, Kaplan-Meier survival curve for PDAC patients with liver metastases with low (< 250 mg/mL, black, n = 21) and high (> 250 mg/mL, red, n = 22) levels of circulating SAA. d, Concentration of circulating SAA in patients with locally advanced non-small cell lung carcinoma (NSCLC, n = 8) and NSCLC patients with liver metastases (n = 13). Data shown as a box plot (center line, median; box limits, upper and lower quartiles; whiskers, max and min values). e, Images of SAA (brown) in the liver of CRC patients with liver metastases. Dashed lines and asterisks indicate sinusoids and hepatocytes. Data representative of one experiment (a-e). For f and g, n = 5 and 4 for Saa+/+ mice and n = 4 and 5 for Saa−/− mice orthotopically injected with PBS or CRC cells (MC-38), respectively. f, Quantification of myeloid cells, FN, and COL1. g, Images of FN (left) and COL1 (right). Data representative of one experiment (f, g). For h-o, n = 5 for all groups unless indicated otherwise. h, Images of pSTAT3+ cells, myeloid cells, and FN. i, j, Images and quantification of COL1. k, Images of sinusoids (brown, CD31) in the liver. l, mRNA levels of Lcn2, S100a8, S100a9, Ccl6, Cxcl1, Fn1, Col1a1, and Des in the liver. m, mRNA levels of Saa1 and Saa2. n, Images of the pancreas and primary tumor stained for CD31 (brown), CK19 (yellow), and Ki-67 (purple). o, Quantification of the weight of pancreas/primary tumor (left), number of Ki-67+ tumor cells (middle), and vascular area (right). For weight, n = 4 for Saa+/+ mice injected with PDAC cells. Data representative of one (i-k, Fn1, Col1a1, and Des in l, n, o) or two independent experiments (h, all other genes in l, m). p, Study design for q-s (n = 8 and 5 for Saa+/+ mice and n = 5 and 7 for Saa−/− mice injected with PBS or PDAC cells, respectively). All groups were injected with PDAC-YFP cells on day 10. q, r, Images of the liver showing metastatic lesions (yellow, CK19) and Ki-67 (purple). Scale bars, 4 mm (q) and 200 μm (r). s, Quantification of lesions (left) and Ki-67+ tumor cells (right). Data representative of one experiment (p-s). Scale bars, 50 μm unless indicated otherwise. Statistical significance was calculated using two-sided Mann-Whitey test (a, d), Mantel-Cox test (c), and one-way ANOVA with Dunnett’s test (all other panels). NS, not significant. Data represented as mean ± s.d. unless indicated otherwise.
Extended Data Figure 8 |
Extended Data Figure 8 |. SAA is a downstream mediator of IL-6 signaling that drives myeloid cell accumulation and fibrosis within the liver.
a, Study design for b-d (n = 5 for all groups, except n = 4 for Saa−/− mice). b, Concentration of IL-6 in the serum collected from control mice (left), Il-6−/− mice (middle), and Saa−/− mice (right) on indicated days. c, d, Images and quantification of pSTAT3+ cells, myeloid cells, FN, and COL1. Arrows indicate Ly6G+ cells. Data representative of one experiment (a-d) e, Study design (n = 5 for mice injected with pLIVE-vector; n = 6 for mice injected with pLIVE-IL-6). f, Concentration of IL-6 in the serum. g, Images of the liver showing metastatic lesions (yellow, CK19) and Ki-67 (purple). h, Quantification of lesions (left) and Ki-67+ tumor cells (right). Data representative of one experiment (e-h). i, Study design (n = 5 for all groups, except n = 4 for Saa−/− mice injected with CCl4). j, Images and quantification of myeloid cells, FN, and COL1. Arrows indicate Ly6G+ cells. Dashed lines indicate the lower limit of detection (b, f). Scale bars, 50 μm. Statistical significance was calculated using two-tailed Mann-Whitney test (b, f, h) or one-way ANOVA (all other panels). NS, not significant. Data represented as mean + s.d. or mean ± s.d.
Extended Data Figure 9 |
Extended Data Figure 9 |. IL-6/STAT3/SAA signaling axis does not impact expression of MIF and TIMP1.
a, Study design (n = 5 and 4 for mice injected with PBS and PDAC cells. b, c, Images of CK19 (yellow) and TIMP1 (purple) in the pancreas, primary tumor, and liver. Data representative of at least three independent experiments (a-c). d, FPKM values of genes in the liver of control mice (n = 5) and NTB KPC mice (n = 5) obtained from QuantSeq 3’ mRNA sequencing. Data represented as box plots (center line, median; box limits, upper and lower quartiles; whiskers, max and min values). e, mRNA levels of Timp1 in the liver of control mice (n = 6), NTB KPC mice (n = 7), and TB KPC mice (n = 6) relative to Actb. Data representative of one experiment (d, e). f, j, n, Study designs. For f, n = 5 for Il-6+/+ mice injected with PBS and n = 5 or 6 for Il-6+/+ mice injected with PDAC cells. n = 4 and 5 for Il-6−/− mice injected with PBS or PDAC cells, respectively. For j, n = 5 for all groups, except n = 4 or 5 for Saa+/+ injected with PDAC cells. For n, n = 4 for Stat3flox/flox mice and n = 8 and 7 for Stat3flox/flox Alb-Cre mice injected with PBS or PDAC cells, respectively. g, k, o, mRNA levels of Mif and Timp1 in the indicated organs relative to Actb. h, l, p, Images of CK19 (yellow) and TIMP1 (purple) in the pancreas and primary tumor. i, m, q, Concentration of TIMP1 in the serum. Data representative of one experiment (f-q). Scale bars, 50 μm. Statistical significance was calculated using one-way ANOVA with Dunnett’s test (i, m, q) or two-tailed Mann-Whitney test (all other panels). NS, not significant. ND, not detected. Data represented as mean ± s.d. unless indicated otherwise.
Extended Data Figure 10 |
Extended Data Figure 10 |. Primary PDAC development induces a systemic response that promotes the formation of a pro-metastatic niche in the liver.
a, Study design for b-g (n = 4 and 8 for CD45.2 mice injected with PBS (group 1) or PDAC cells (group 2)). SN, supernatant. b, Assessment of chimerism in parabiotically joined mice. Flow cytometric analysis of the peripheral blood gated on CD45.1+ and CD45.2+ cells as a percentage of CD45+ cells. c, Dorsal (top) and ventral (bottom) views of parabiotically joined mice. †, site of laparotomy for orthotopic injection; ††, skin suture for parabiotic joining. d, Images and quantification of myeloid cells and FN. Arrows indicate Ly6G+ cells. e, mRNA levels of Saa. f, Concentration of IL-6 in pancreas supernatant and serum. Solid lines indicate data points from individual mice. Dashed lines indicate the lower limit of detection. g, Concentration of circulating SAA. Data representative of one (f, g) or two independent experiments (a-e). For h and i, n = 5 for all groups. h, Images of myeloid cells and FN in the lung of control mice, NTB KPC mice, and TB KPC mice. i, Quantification of myeloid cells and FN. Data representative of one experiment (h, i). j, Study design for k-m. For k, n = 4 and 5 for Il-6+/+ mice and n = 5 and 4 for Il-6−/− mice injected with PBS or PDAC cells, respectively. For l, n = 5 for all groups. For m, n = 4 for Stat3flox/flox mice and n = 8 and 7 for Stat3flox/flox Alb-Cre mice injected with PBS or PDAC cells, respectively. k, l, m, Quantification of myeloid cells and FN. Data representative of one experiment (j-m). n, Study design for o (n = 4 for all groups of mice). All groups of mice were injected with PDAC-YFP cells on day 10. o, Quantification of PDAC-YFP cells. Data representative of one experiment (n, o). p, conceptual model. Scale bars, 50 μm. Statistical significance was calculated using two-sided Mann-Whitney test (d, e, g), two-sided Wilcoxon test (f), and one-way ANOVA with Dunnett’s test (all other panels). NS, not significant. Data represented as mean ± s.d, except d, e, and g, which are shown as box plots (center line, median; box limits, upper and lower quartiles; whiskers, max and min values). Data from individual mice are shown in f.
Figure 1 |
Figure 1 |. Primary PDAC development induces a pro-metastatic niche in the liver.
a, Images and quantification of myeloid cells, FN, and COL1 in the liver. Arrows indicate Ly6G+ cells. Numbers in parentheses indicate the number (n) of mice. Data pooled from two experiments. b, Images of the liver and quantification of PDAC-YFP cells. Control mice (n = 14) and NTB KPC mice (n = 10) were intrasplenically injected with PDAC-YFP cells, and the liver was analyzed after 10 days. Data representative of two independent experiments. c, Scatter plot of transcriptome data. FPKM, fragments per kilobase of exon per million mapped fragments (n = 5 for both groups). Scale bars, 50 μm (a) and 1 cm (b). Statistical significance was calculated using one-way ANOVA with Dunnett’s test (a) and two-tailed Mann-Whitney test (b). Data represented as mean ± s.d.
Figure 2 |
Figure 2 |. IL-6 is necessary for the establishment of a pro-metastatic niche in the liver.
For a and b, n = 5 and 6 for Il-6+/+ mice and n = 4 and 5 for Il-6−/− mice orthotopically injected with PBS or PDAC cells, respectively. a, Quantification of pSTAT3+ cells, myeloid cells, and FN. b, mRNA levels of Saa in the liver. For c-e, n = 4 and 5 for Il-6+/+ mice and n = 4 for Il-6−/− mice orthotopically injected with PBS or PDAC cells, respectively. All groups were intraportally injected with PDAC-YFP cells on day 10. c, d, Images of liver and flow cytometric analysis. e, Quantification of PDAC-YFP cells. Data representative of two independent experiments (a-e). Scale bars, 1 cm. Statistical significance was calculated using one-way ANOVA with Dunnett’s test. Data represented as mean ± s.d.
Figure 3 |
Figure 3 |. STAT3 signaling in hepatocytes orchestrates the formation of a pro-metastatic niche in the liver.
a, Study design for b-f (n = 4 for Stat3flox/flox mice injected with PBS or PDAC cells; n = 8 and 7 for Stat3flox/flox Alb-Cre mice injected with PBS or PDAC cells, respectively). b, c, Quantification of pSTAT3+ cells, myeloid cells, and FN. d, mRNA levels of Saa in the liver. e, Images of Saa. Dashed lines and asterisks indicate sinusoids and hepatocytes. f, Concentration of circulating SAA. Data representative of two independent experiments (a-f). Scale bars, 50 μm. Statistical significance was calculated using one-way ANOVA with Dunnett’s test. Data represented as mean ± s.d.
Figure 4 |
Figure 4 |. SAA is a critical determinant of liver metastasis.
a, Images of SAA in the liver of normal donors (top) and PDAC patients with liver metastases (bottom). Dashed lines and asterisks indicate sinusoids and hepatocytes. Data representative of one experiment. b, Quantification of pSTAT3+ cells, myeloid cells, and FN (n = 5 for all groups orthotopically injected with PBS or PDAC cells). For c-e, n = 4 and 5 for Saa+/+ mice and n = 5 and 6 for Saa−/− mice orthotopically injected with PBS or PDAC cells, respectively. All groups were intraportally injected with PDAC-YFP cells on day 10. c, d, Images of liver and flow cytometric analysis. e, Quantification of PDAC-YFP cells. Data representative of two independent experiments (b-e). Scale bars, 50 μm (a) and 1 cm (c). Statistical significance was calculated using one-way ANOVA with Dunnett’s test. Data represented as mean ± s.d.

Comment in

References

    1. Hidalgo M Pancreatic cancer. N. Engl. J. Med 362, 1605–1617 (2010). - PubMed
    1. Becker A et al. Extracellular vesicles in cancer: cell-to-cell mediators of metastasis. Cancer Cell 30, 836–848 (2016). - PMC - PubMed
    1. Sceneay J, Smyth MJ & Möller A The pre-metastatic niche: finding common ground. Cancer Metastasis Rev. 32, 449–464 (2013). - PubMed
    1. Hingorani SR et al. Trp53R172H and KrasG12D cooperate to promote chromosomal instability and widely metastatic pancreatic ductal adenocarcinoma in mice. Cancer Cell 7, 469–483 (2005). - PubMed
    1. Lee JW, Komar CA, Bengsch F, Graham K & Beatty GL Genetically engineered mouse models of pancreatic cancer: the KPC model (LSL-KrasG12D/+;LSL-Trp53R172H/+;Pdx-1-Cre), its variants, and their application in immuno-oncology drug discovery. Curr. Protoc. Pharmacol 73, 14.39.1–14.39.20 (2016). - PMC - PubMed

Publication types