Review
. 2019 Feb 4;5(1):e303.
doi: 10.1212/NXG.0000000000000303. eCollection 2019 Feb.

Genotype-structure-phenotype relationships diverge in paralogs ATP1A1, ATP1A2, and ATP1A3

Affiliations
Review

Genotype-structure-phenotype relationships diverge in paralogs ATP1A1, ATP1A2, and ATP1A3

Kathleen J Sweadner et al. Neurol Genet. .

Abstract

Objective: We tested the assumption that closely related genes should have similar pathogenic variants by analyzing >200 pathogenic variants in a gene family with high neurologic impact and high sequence identity, the Na,K-ATPases ATP1A1, ATP1A2, and ATP1A3.

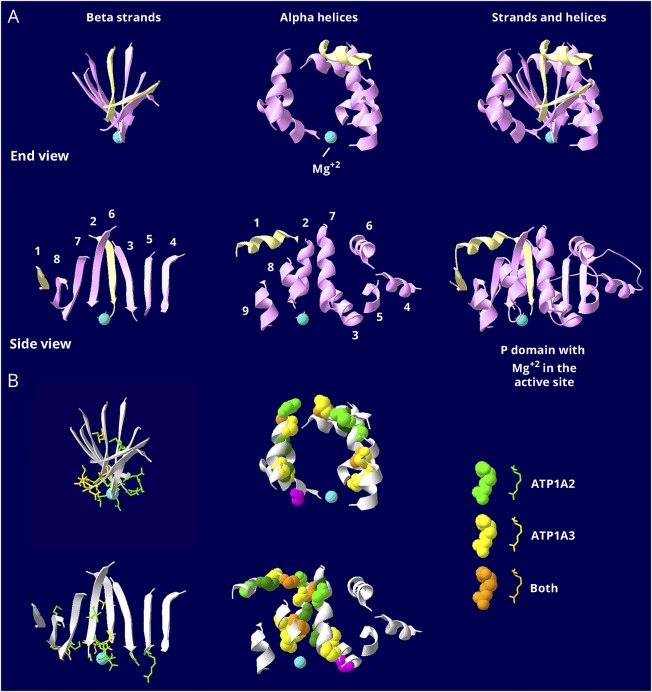
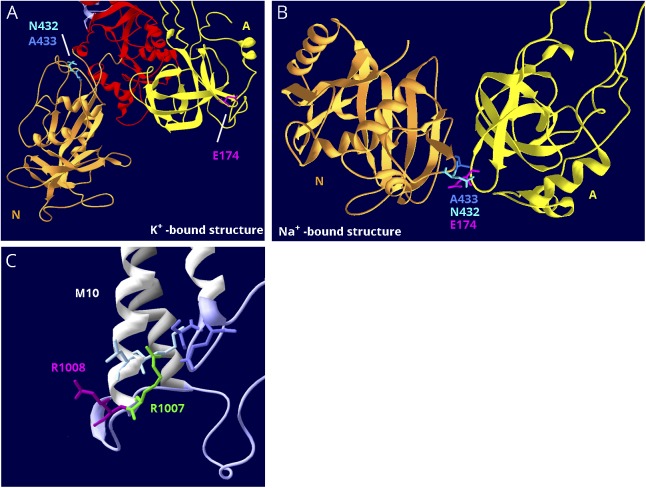
Methods: Data sets of disease-associated variants were compared. Their equivalent positions in protein crystal structures were used for insights into pathogenicity and correlated with the phenotype and conservation of homology.

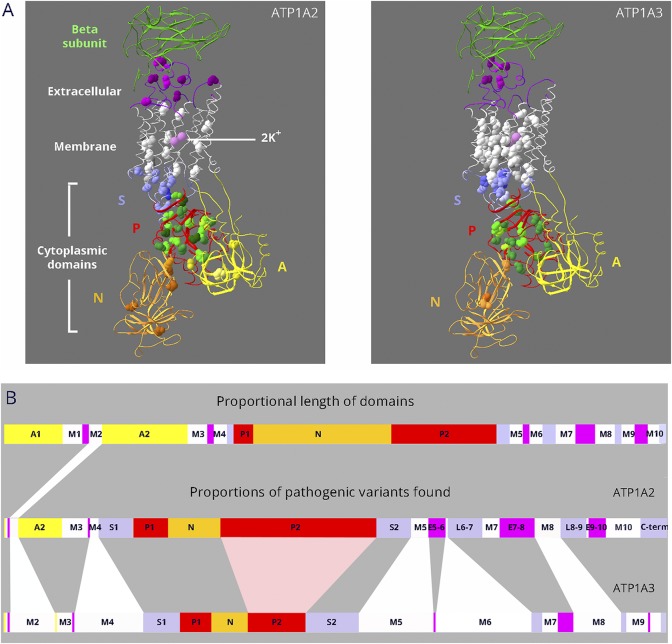
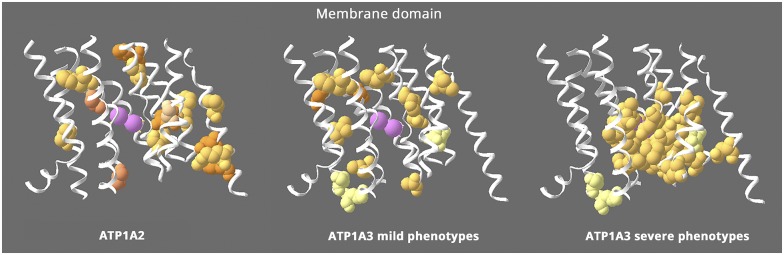
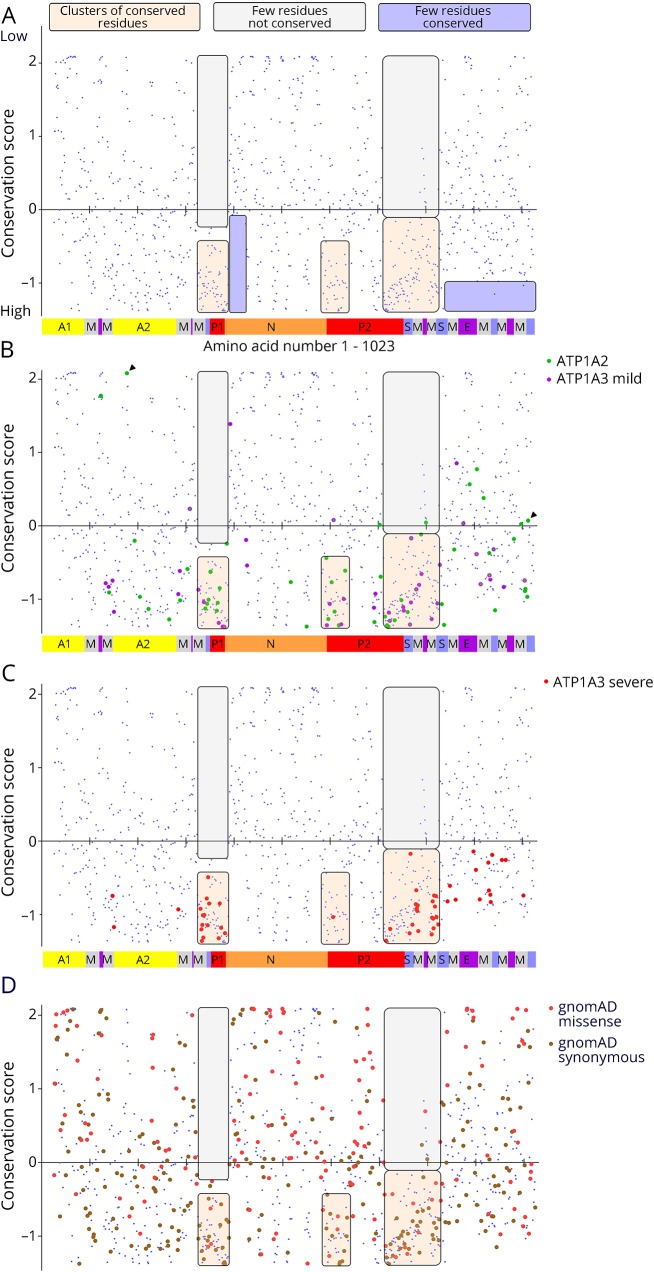
Results: Relatively few mutations affected the corresponding amino acids in 2 genes. In the membrane domain of ATP1A3 (primarily expressed in neurons), variants producing milder neurologic phenotypes had different structural positions than variants producing severe phenotypes. In ATP1A2 (primarily expressed in astrocytes), membrane domain variants characteristic of severe phenotypes in ATP1A3 were absent from patient data. The known variants in ATP1A1 fell into 2 distinct groups. Sequence conservation was an imperfect indicator: it varied among structural domains, and some variants with demonstrated pathogenicity were in low conservation sites.

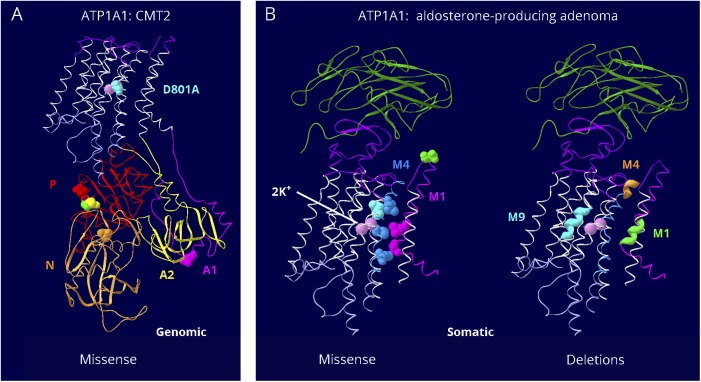
Conclusions: Pathogenic variants varied between genes despite high sequence identity, and there is a genotype-structure-phenotype relationship in ATP1A3 that correlates with neurologic outcomes. The absence of "severe" pathogenic variants in ATP1A2 patients predicts that they will manifest either in a different tissue or by death in utero and that new ATP1A1 variants will produce additional phenotypes. It is important that some variants in poorly conserved amino acids are nonetheless pathogenic and could be incorrectly predicted to be benign.


Figures

Figure 1
Figure 1. Dissimilar mutation distributions in 88% identical ATP1A2 and ATP1A3 proteins
(A) Ribbon diagrams of Na,K-ATPase in the K+-bound conformation. Bound K+ is shown as pink spheres. Extracellular portions include the β-subunit (green; transmembrane portion removed for clarity) and extracellular loops of the α-subunit (magenta). The 10 transmembrane α-helices are white. The cytoplasmic domains are the stalk (S, lavender), phosphorylation domain (P, red), nucleotide binding domain (N, gold), and actuator domain (A, yellow). Spacefill residues are the backbones of each amino acid mutated in ATP1A2 or ATP1A3. Color shading is varied to help distinguish different amino acids. For ATP1A2, 76 different DNA variants occur in 66 amino acids, i.e., 10 amino acids have 2 alternative codon changes. Three of the mutations are single amino acid deletions. For ATP1A3, 130 different DNA variants occur in 86 amino acids; 5 are single amino acid deletions, and there are 25 amino acids with 2–6 alternative codon changes. All 18 overlapping residue pairs (including 3 where one was found in ClinVar) were identical before the mutation. In 6 pairs, the amino acid change was different; in 8, it was the same; and in 4, both identical and different substitutions were found (i.e., alternative codon changes). (B) Linear diagram of the domain substructure. Both the A domain (yellow) and the P domain (red) are composed of 2 parts that are separated in the linear structure. As in (A), the extracellular loops are magenta. The stalk domain comprises 5 separate parts: the cytoplasmic extensions of the M4 and M5 transmembrane spans S1 and S2; the short intracellular loops L6-7 and L8-9; and the C-terminus (lavender). For ATP1A2 and ATP1A3, domain lengths are proportional to the number of distinct variants found (including alternative codon changes). Although variants are found in most domains, ATP1A2 has an excess in the P domain, and ATP1A3 has an excess in the membrane domain.
Figure 2
Figure 2. Structure-phenotype relationship in the membrane domain
This figure shows the transmembrane α-helices, omitting the portions that extend into the extracellular and intracellular spaces. All the ATP1A2 membrane mutations are shown (left), whereas ATP1A3's are divided into 2 groups: milder ATP1A3 phenotypes (middle) with onset from childhood to adult and severe ATP1A3 mutations (right) with onset in infancy. ATP1A2 and the milder ATP1A3 phenotypes have similar distributions that appear to exclude the residues right around the ions (pink = potassium ions). In contrast, the severe ATP1A3 mutations are usually close to the ions. Almost 70% of the severe mutations are in contiguous stretches in M4, M5, and M6 near the ions. In contrast, 100% of the mild mutations are not adjacent to any other mutations, and the few in M4, M5, and M6 are on either side of the contiguous stretches. The distributions highlight 2 unique features: that mild and severe ATP1A3 mutations have different distributions and that ATP1A2 mutations all look like “mild”. In fact, hemiplegic migraine seldom has onset in infancy. Equivalent “severe” mutations of ATP1A2 have not been found. Variants of 3 ATP1A3 residues in pale yellow can produce either mild or severe phenotypes. Fourteen ATP1A3 residues altogether have produced both RDP and mild AHC or an intermediate phenotype. Eleven of those were recurrent (with the same or different substitution) or appeared also in ATP1A1 or ATP1A2 patients. Here, 2 had different substitutions in patients with differing phenotypes (S137Y or S137F severe, S137del mild; Q140L severe, Q140H mild), and the third, D923N, reduces affinity for Na+ and presents as a continuum between AHC and RDP,, severe or mild in the same family.
Figure 3
Figure 3. Similar but restricted distributions of pathogenic variants in the P domain
The P domain is the most conserved in the gene family. It is covalently phosphorylated during transport, and the Mg2+ ion (aqua) is at the active site. (A) The P domain consists of 2 halves that are separated in the linear structure but that interdigitate in a complex way when the protein folds. The first half, P1 in figure 1B, is shown in pale yellow, and the second half, P2 in figure 1B, in pink. There is a twisted β-sheet (left views) surrounded by α-helices (middle views). Strands and helices are numbered in the order found in the sequence. (B) The known mutations are displayed with color coding as indicated. Stick view is used for mutations in the β-sheet to avoid overcrowding. Note how most of the side chains of the mutated residues extend down into the active site surface. Spacefill view of the mutations, without side chains, is used for the α -helices. Note how the mutations are confined to just 5 helices: helix 1, which is associated with the stalk domain, and 4 helices that form a belt around the middle of the P domain: 2, 3, 7, and 8. There are no mutations in the end strands (1 and 4) or the end helices (4, 5, 6, and 9), which may be less important to function. The magenta mutation in an α-helix is the only helix mutation near (but not in) the active site. It is ATP1A3 T613M, a recurrent RDP mutation. The data indicate that the ATP1A2 and ATP1A3 distributions of mutations are very similar in the P domain, but there are 2 types of mutations. Most of the mutations in the β-sheet are at the active site. Most of the ones in the α-helices are distant from the active site. There was no correlation with phenotype severity.
Figure 4
Figure 4. Distinct groups of ATP1A1 pathogenic variants
There are only a handful of known mutations for ATP1A1, but they fall in 2 clearly different groups. (A) Seven germline mutations were found in CMT2 patients. One is at the interface between the 2 halves of the A domain (A1 dark pink, A2 yellow), where it may interfere with A domain stability. One is at the site equivalent to D801N, the most common AHC pathogenic variant, but the change is from aspartate to alanine, presumably a milder substitution. The other 5 variants are close to the boundary of P and N domains. They do not appear fundamentally different from mutations in ATP1A2 or ATP1A3. I592T in ATP1A1 (orange) is the residue equivalent to I589T in ATP1A2. (B) The other group is somatic mutations found in aldosterone-producing adenomas. (Left) Six of the missense mutations all lie along the ion path through the protein, and some alter amino acids that are believed to be gates. The seventh is at the top of the extracellular mouth (green). Two of them, V332G and L337M, are less disruptive versions of mild pathogenic variants in ATP1A3: V322D and L327del. (Right) Multiple different short deletions (of 2–6 amino acids) appear only in the 3 stretches of amino acids highlighted in membrane spans 1, 4, and 9. Such deletions have not been reported for ATP1A2 or ATP1A3. These somatic mutations are in a class by themselves. They are believed to generate slight leaks, large enough to lead to aldosterone production but not large enough to kill the cells.
Figure 5
Figure 5. Evolutionary sequence conservation
Human ATP1A1, ATP1A2, and ATP1A3 amino acid sequences were aligned with Sus scrofa ATP1A1 (the species used in protein crystal structures 3KDP and 3WGU), and each residue affected by a disease variant was assigned the conservation score calculated for ATP1A1. (A) The individual conservation scores of all aligning amino acids are shown with score on the Y axis and amino acid sequence (1–1,023) on the X axis. As seen in figure e-1 (links.lww.com/NXG/A134), there is no alignment at the N-terminus, so N-terminal residues do not appear. Each blue spot is one amino acid, and the Na,K-ATPase domains are illustrated in the bar at the bottom. Some patterns of conservation can be discerned, highlighted by transparent boxes: two regions with few or no highly conserved amino acids (lavender) and 3 regions of conserved residues (tan) with practically no low conservation residues (off-white). (B) The ATP1A2 variants (green) and the mild ATP1A3 variants (magenta) have similar distributions. There are 14 cases (∼15%) where homology scores were in the less-conserved half. The C-terminal region has many pathogenic variants in both genes despite lacking the highest conservation scores. Residues E174 and R1008 from figure 6 are marked with arrowheads. (C) The severe ATP1A3 variants had a more restricted distribution. It can be seen that many align with the membrane spans. Although their conservation scores varied widely, none were in the less-conserved half. Of the points that do not lie in one of the 3 clusters of high conservation, 8 were shared by mild and severe ATP1A3 phenotypes (visible as 2 colors per symbol at high magnification). This suggests that intermediate phenotypes tend to have less restricted structure distributions than the most severe phenotypes. (D) All the synonymous (brown; n = 281) and missense (coral pink; n = 145) ATP1A3 variants from gnomAD (138,632 sequences) are plotted to compare to the clustering of mutations.
Figure 6
Figure 6. Structure-based interpretation of variants of uncertain significance
(A) E174K; N, P, and A domains are visible. In the K+-bound conformation, the N (gold) and A (yellow) domains are far apart. (B) In the Na+-bound conformation, the N and A domains are in contact. The P domain in the background was hidden for clarity. E174K (magenta) is a variant in ATP1A2 that has the poorest conservation score in figure 5B, and it is predicted to be tolerated by SIFT. In the K+-bound structure, it is fully exposed to the cytoplasm (A), but in the Na+-bound structure, it is the point of closest contact between the A domain (yellow) and N domain (gold). There it interacts with 2 adjacent residues, an asparagine N432 and an alanine A433 (blue and aqua). They are also shown in (A). (C) R1008W; close-up of M10, M7, and M8 where these helices terminate in parts of the S domain (lavender). R1008W (magenta) is a variant in ATP1A2 in a patient with compound heterozygosity with R548C. Because the adjacent variant R1007W (green) is known to be pathogenic, it was suggested that R1008W might contribute to the severity. R1007 has a better conservation score, but R1008's score is still in the range of other pathogenic variants (close to zero). In the structure, R1007 points into the protein where it makes close association with 2 domains: two residues in M10 (light blue) and 2 residues in L7-8 (lavender), including the protein kinase A phosphorylation site, S933. In contrast, R1008 points out into the cytoplasm, where a substitution may be tolerated.

Similar articles

Cited by

References

    1. Heinzen EL, Arzimanoglou A, Brashear A, et al. . Distinct neurological disorders with ATP1A3 mutations. Lancet Neurol 2014;13,503–514. - PMC - PubMed
    1. Friedrich T, Tavraz NN, Junghans C. ATP1A2 mutations in migraine: seeing through the facets of an ion pump onto the neurobiology of disease. Front Physiol 2016;7:239. - PMC - PubMed
    1. Azizan EA, Brown MJ. Novel genetic determinants of adrenal aldosterone regulation. Curr Opin Endocrinol Diabetes Obes 2016;23:209–217. - PubMed
    1. Lassuthova P, Rebelo AP, Ravenscroft G, et al. . Mutations in ATP1A1 Cause Dominant Charcot-Marie-Tooth Type 2. Am J Hum Genet 2018;102:505–514. - PMC - PubMed
    1. Barcroft LC, Moseley AE, Lingrel JB, Watson AJ. Deletion of the Na/K-ATPase α1-subunit gene (Atp1a1) does not prevent cavitation of the preimplantation mouse embryo. Mech Dev 2004;121:417–426. - PubMed