

Boosting to Amplify Signal with Isobaric Labeling (BASIL) Strategy for Comprehensive Quantitative Phosphoproteomic Characterization of Small Populations of Cells
- PMID: 30843680
- PMCID: PMC6596310
- DOI: 10.1021/acs.analchem.9b00024
Boosting to Amplify Signal with Isobaric Labeling (BASIL) Strategy for Comprehensive Quantitative Phosphoproteomic Characterization of Small Populations of Cells
Abstract
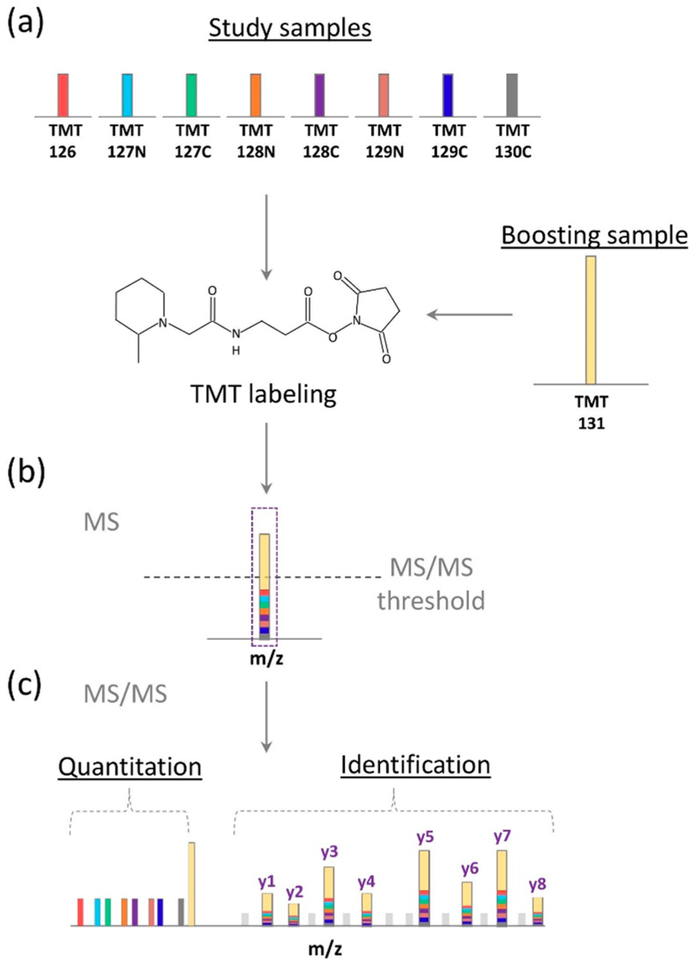
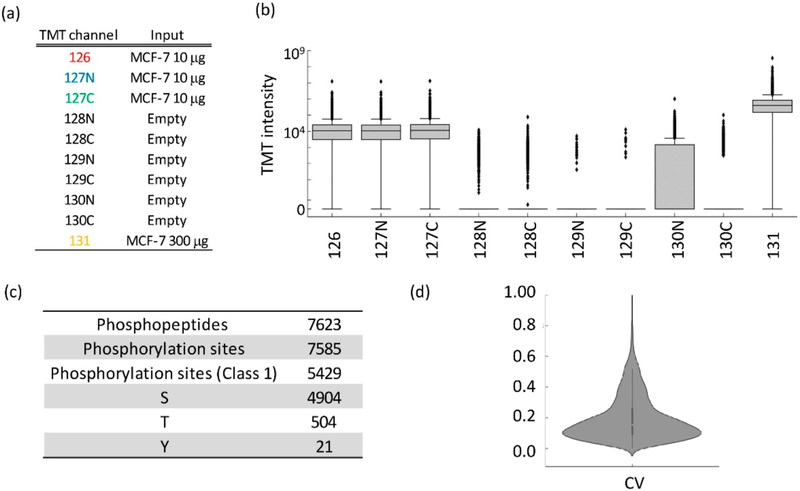
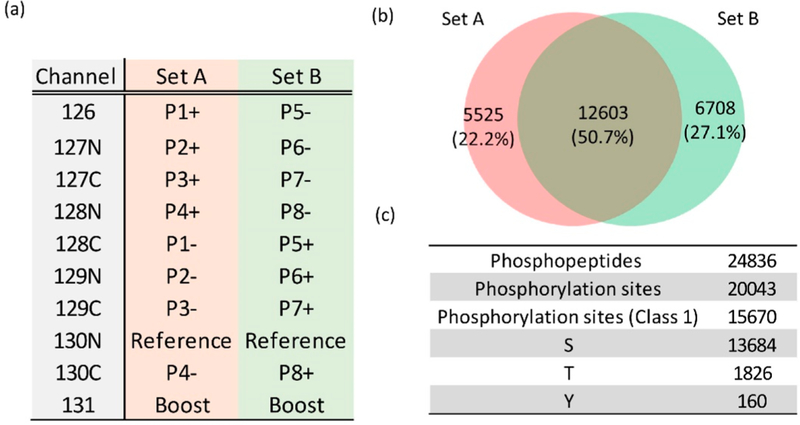
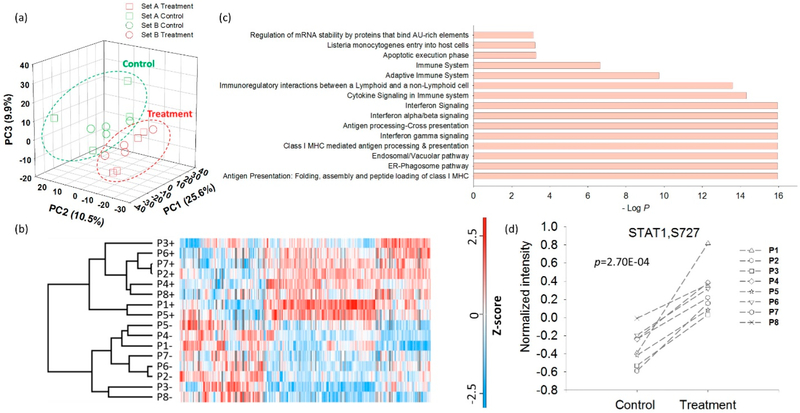
Comprehensive phosphoproteomic analysis of small populations of cells remains a daunting task due primarily to the insufficient MS signal intensity from low concentrations of enriched phosphopeptides. Isobaric labeling has a unique multiplexing feature where the "total" peptide signal from all channels (or samples) triggers MS/MS fragmentation for peptide identification, while the reporter ions provide quantitative information. In light of this feature, we tested the concept of using a "boosting" sample (e.g., a biological sample mimicking the study samples but available in a much larger quantity) in multiplexed analysis to enable sensitive and comprehensive quantitative phosphoproteomic measurements with <100 000 cells. This simple boosting to amplify signal with isobaric labeling (BASIL) strategy increased the overall number of quantifiable phosphorylation sites more than 4-fold. Good reproducibility in quantification was demonstrated with a median CV of 15.3% and Pearson correlation coefficient of 0.95 from biological replicates. A proof-of-concept experiment demonstrated the ability of BASIL to distinguish acute myeloid leukemia cells based on the phosphoproteome data. Moreover, in a pilot application, this strategy enabled quantitative analysis of over 20 000 phosphorylation sites from human pancreatic islets treated with interleukin-1β and interferon-γ. Together, this signal boosting strategy provides an attractive solution for comprehensive and quantitative phosphoproteome profiling of relatively small populations of cells where traditional phosphoproteomic workflows lack sufficient sensitivity.
Conflict of interest statement
The authors declare no competing financial interest.
Figures
References
-
- Hunter T Cell 2000, 100 (1), 113–27. - PubMed
-
- Cohen P Nat. Cell Biol 2002, 4 (5), E127–30. - PubMed
-
- Tsai CF; Wang YT; Chen YR; Lai CY; Lin PY; Pan KT; Chen JY; Khoo KH; Chen YJ J. Proteome Res 2008, 7 (9), 4058–69. - PubMed
-
- Larsen MR; Thingholm TE; Jensen ON; Roepstorff P; Jorgensen TJ Mol. Cell. Proteomics 2005, 4 (7), 873–86. - PubMed
Publication types
MeSH terms
Substances
Grants and funding
LinkOut - more resources
Full Text Sources
Other Literature Sources
Molecular Biology Databases
