. 2019 Mar 7;4(5):e124865.
doi: 10.1172/jci.insight.124865.

Changes in body composition and weight during the menopause transition

Affiliations

Changes in body composition and weight during the menopause transition

Gail A Greendale et al. JCI Insight. .

Abstract

Background: The relation between the menopause transition (MT) and changes in body composition or weight remains uncertain. We hypothesized that, independent of chronological aging, the MT would have a detrimental influence on body composition.

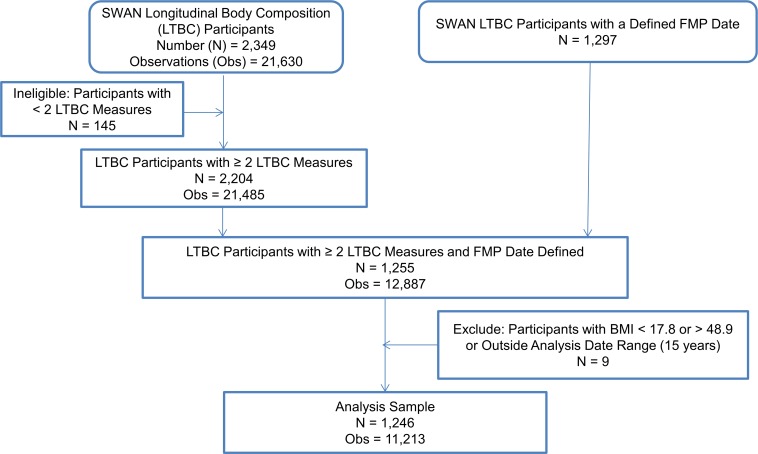
Methods: Participants were from the longitudinal Study of Women's Health Across the Nation (SWAN) cohort. We assessed body composition by dual energy x-ray absorptiometry. Multivariable mixed effects regressions fitted piece-wise linear models to repeated measures of outcomes as a function of time before or after the final menstrual period (FMP). Covariates were age at FMP, race, study site, and hormone therapy.

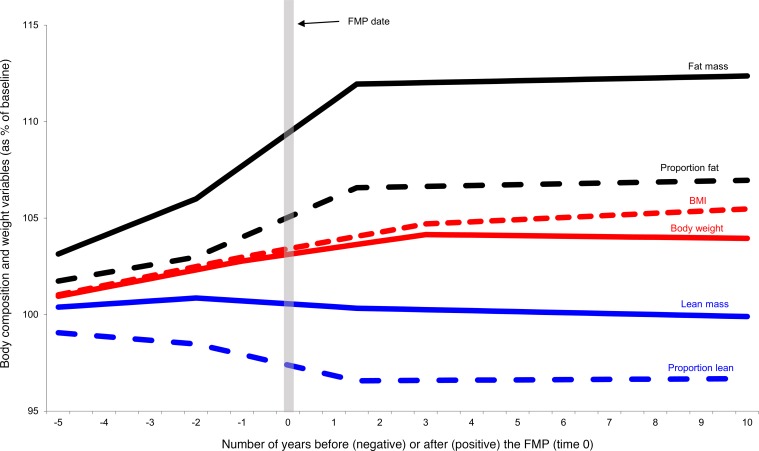
Results: Fat and lean mass increased prior to the MT. At the start of the MT, rate of fat gain doubled, and lean mass declined; gains and losses continued until 2 years after the FMP. After that, the trajectories of fat and lean mass decelerated to zero slope. Weight climbed linearly during premenopause without acceleration at the MT. Its trajectory became flat after the MT.

Conclusion: Accelerated gains in fat mass and losses of lean mass are MT-related phenomena. The rate of increase in the sum of fat mass and lean mass does not differ between premenopause and the MT; thus, there is no discernable change in rate of weight gain at the start of the MT.

Funding: NIH, Department of Health and Human Services (DHHS), through the National Institute on Aging, National Institute of Nursing Research, and NIH Office of Research on Women's Health (U01NR004061, U01AG012505, U01AG012535, U01AG012531, U01AG012539, U01AG012546, U01AG012553, U01AG012554, and U01AG012495).

Keywords: Aging; Epidemiology; Metabolism; Obesity.


Conflict of interest statement

Conflict of interest: The authors have declared that no conflict of interest exists.

Figures

Figure 1
Figure 1. LOESS plots of baseline-normalized values of each outcome (fat mass, proportion fat mass, lean mass, proportion lean, weight, and BMI) in relation to time prior to and after the final menstrual period (FMP-time) from the Study of Women’s Health Across the Nation (SWAN).
Blue curves illustrate mean values. Cross-sectional, 95% CI are indicated by the red curves. Number of observations in each plot ranges from 11837–11901; plots truncated at 8 years prior to and 10.5 years after FMP — the 5th and 95th percentiles, respectively — of the distribution of FMP-time. LOESS plots are a cross-section at each time point, thus are influenced by the composition of the study sample at each time and by between-women differences; they are not equivalent to longitudinal, repeated measures models. LOESS plots are used to develop a hypothesis about the functional form of the relation between the exposure (FMP-time) and the outcomes (body composition or weight measures). Apparent slopes should not be overinterpreted; the tails are particularly susceptible to influence by sparser data. The presence of knots (changes in slope direction) and slope of each putative segment must be formally tested, as described in the Methods.
Figure 2
Figure 2. Model-predicted trajectories of body composition and body weight outcomes relative to the time prior to or after the FMP, SWAN.
Values shown are for an average study participant (i.e., with each model covariate set at its analysis sample mean). Covariates were age at FMP, race, SWAN study site, and HT use.
Figure 3
Figure 3. Derivation of the analysis sample for analysis of body composition and weight in relation to the FMP.
Participants are from the Study of Women’s Health Across the Nation (SWAN).

References

    1. Prospective Studies Collaboration, et al. Body-mass index and cause-specific mortality in 900 000 adults: collaborative analyses of 57 prospective studies. Lancet. 2009;373(9669):1083–1096. doi: 10.1016/S0140-6736(09)60318-4. - DOI - PMC - PubMed
    1. Walley AJ, Asher JE, Froguel P. The genetic contribution to non-syndromic human obesity. Nat Rev Genet. 2009;10(7):431–442. doi: 10.1038/nrg2594. - DOI - PubMed
    1. Williams EP, Mesidor M, Winters K, Dubbert PM, Wyatt SB. Overweight and Obesity: Prevalence, Consequences, and Causes of a Growing Public Health Problem. Curr Obes Rep. 2015;4(3):363–370. doi: 10.1007/s13679-015-0169-4. - DOI - PubMed
    1. Mauvais-Jarvis F, Clegg DJ, Hevener AL. The role of estrogens in control of energy balance and glucose homeostasis. Endocr Rev. 2013;34(3):309–338. doi: 10.1210/er.2012-1055. - DOI - PMC - PubMed
    1. Kohrt WM, Wierman ME. Preventing Fat Gain by Blocking Follicle-Stimulating Hormone. N Engl J Med. 2017;377(3):293–295. doi: 10.1056/NEJMcibr1704542. - DOI - PubMed

Publication types