. 2019 Mar 7;4(5):e125914.
doi: 10.1172/jci.insight.125914.

Human adipose tissue microvascular endothelial cells secrete PPARγ ligands and regulate adipose tissue lipid uptake

Affiliations

Human adipose tissue microvascular endothelial cells secrete PPARγ ligands and regulate adipose tissue lipid uptake

Silvia Gogg et al. JCI Insight. .

Abstract

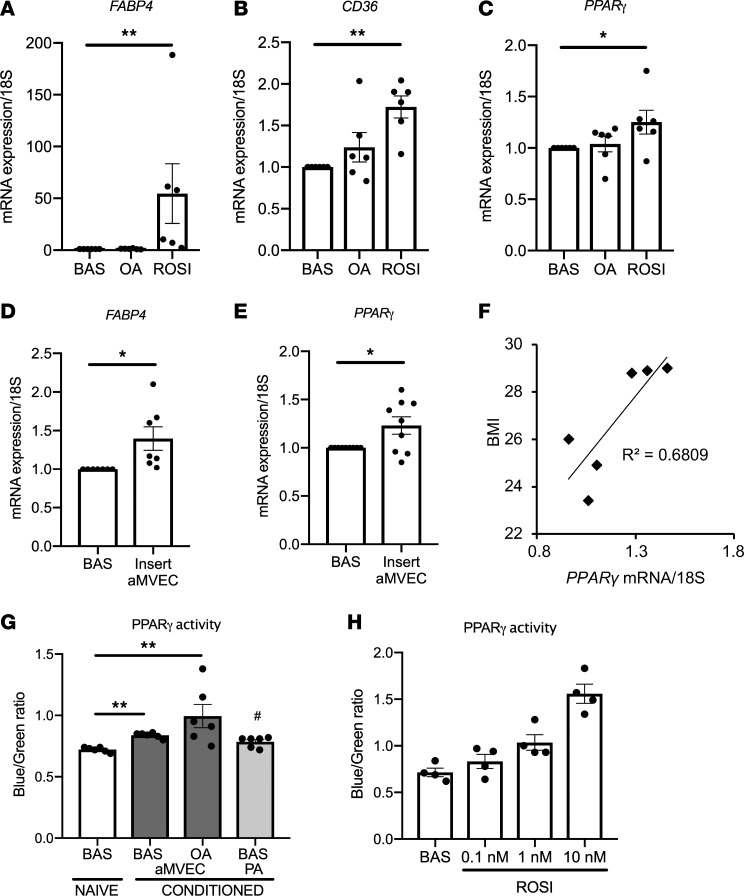
Human adipose cells cannot secrete endogenous PPARγ ligands and are dependent on unknown exogenous sources. We postulated that the adipose tissue microvascular endothelial cells (aMVECs) cross-talk with the adipose cells for fatty acid (FA) transport and storage and also may secrete PPARγ ligands. We isolated aMVECs from human subcutaneous adipose tissue and showed that in these cells, but not in (pre)adipocytes from the same donors, exogenous FAs increased cellular PPARγ activation and markedly increased FA transport and the transporters FABP4 and CD36. Importantly, aMVECs only accumulated small lipid droplets and could not be differentiated to adipose cells and are not adipose precursor cells. FA exchange between aMVECs and adipose cells was bidirectional, and FA-induced PPARγ activation in aMVECs was dependent on functional adipose triglyceride lipase (ATGL) protein while deleting hormone-sensitive lipase in aMVECs had no effect. aMVECs also released lipids to the medium, which activated PPARγ in reporter cells as well as in adipose cells in coculture experiments, and this positive cross-talk was also dependent on functional ATGL in aMVECs. In sum, aMVECs are highly specialized endothelial cells, cannot be differentiated to adipose cells, are adapted to regulating lipid transport and secreting lipids that activate PPARγ, and thus, regulate adipose cell function.

Keywords: Adipose tissue; Cell Biology; endothelial cells.


Conflict of interest statement

Conflict of interest: The authors have declared that no conflict of interest exists.

Figures

Figure 1
Figure 1. Effects of free fatty acids (FA).
(A) FA transport: aMVECs were incubated for 24 hours without (basal condition; BAS) or with 300 μM OA followed by 60 minutes starvation, but with maintained OA, as indicated. The FA transport assay (Quencher-Based Technology assay) was performed as described in Methods. The results, expressed as relative fluorescence units (RFU), are the means of data from 4 experiments. *P < 0.05 compared with BAS. (BD) Regulation of lipid transporters: aMVECs and HUVECs were incubated without (BAS) or with 300 μM OA or 5 μM ROSI for 24 hours. Quantitative real-time PCR (qRT-PCR) of FABP4 (B), CD36 (C), and PPARγ (D) expressed as mRNA/18S rRNA ratio; n = 8 aMVECs or n = 5 HUVECs. *P < 0.05; **P < 0.01; ***P < 0.001 compared with BAS. (B and C) The bottom images show representative Western blots of the protein level of FABP4 (B) and CD36 (C). (E and F) Effect of a PPARγ inhibitor in aMVECs: Cells were incubated for 24 hours without (BAS) or with 300 μM OA or 5 μM ROSI, alone or in the presence of 1 μM T0070907(T007). qRT-PCR of FABP4 (E) and CD36 (F); n = 6. *P < 0.05 compared with OA alone. (G) OA in cMVECs: The cardiac microvascular cells were starved and incubated without (BAS) or with 300 μM OA for 24 hours. qRT-PCR of CD36, FABP4, and PPARγ, n = 5. (H) Effect of VEGF in aMVECs: Cells were starved and incubated without (BAS) or with 100 μM hrVEGF-B for 24 hours. qRT-PCR in aMVECs for CD36 and FABP4; n = 7. (I) Comparative mRNA expression of PPARγ in HUVECs, PAs, and aMVECs. Data are from at least 5 experiments. *P < 0.05; **P < 0.01 compared with HUVECs. In all graphs bars represent mean ± SEM. Wilcoxon’s signed-rank test (A), Kruskal-Wallis test (BD and GI), and 1-way ANOVA (E and F).
Figure 2
Figure 2. aMVECs take up and release lipids but are not adipose precursor cells.
(AE) Lipolytic effect of forskolin in aMVECs: Cells were treated for 24 hours without (BAS) or with 300 μM OA. During the last 24 hours of incubation, OA was removed (B and D) or not (E), and the cells were exposed to 10 μM forskolin for an additional 24 hours (C and D). The intracellular lipid accumulation was revealed by Oil Red O staining (original magnification, ×100). (FN) aMVECs are not adipose precursor cells. PAs and aMVECs were incubated with or without an adipogenic differentiation (Diff) cocktail for 7 days. (FI) The presence of lipids was revealed with Oil Red O staining (original magnification, ×100). (JN) The genes, as indicated in the figures, were analyzed with qRT-PCR. Data are from at least 4 experiments. **P < 0.01. Bars represent mean ± SEM. Wilcoxon’s signed-rank test.
Figure 3
Figure 3. aMVEC/adipocyte cross-talk.
(A and B) Experimental design with Thincert coculture with the long-chain FA analog fluorescent BODIPY-500/510 C1, C12: Adipocytes and aMVECs were independently seeded in the bottom of a culture dish or on the insert membrane. **BODIPY was added to the monocultures and then combined with the opposite unlabeled population, as shown in the schematic figures. (C and D) Microphotographs showing aMVECs and adipocytes cross-talk. aMVECs previously exposed to OA and partially differentiated PAs were grown independently as described. The differentiated PAs (PA diff) and aMVECs filled with lipids were incubated with 3 μM fluorescent BODIPY for 3 hours (upper microphotographs). After a thorough wash of the excess label with PBS, the labeled and not labeled cells were paired as shown in the figures (A) and (B), and the microphotographs were taken after 48 hours of coculture (bottom microphotographs). Original magnification, ×100 (left); ×400 (right).
Figure 4
Figure 4. Effect of OA in PAs.
(AC) Human PAs were starved and incubated without (BAS) or with 300 μM OA or 5 μM ROSI for 24 hours. qRT-PCR of FABP4 (A), CD36 (B), and PPARγ (C); n = 6. *P < 0.05; **P < 0.01 compared with BAS. (DF) aMVECs and PAs cross-talk. aMVECs and PAs were grown independently either in cell culture dishes or in cell culture inserts for 48 hours. PAs were cocultured with the aMVEC insert or without (BAS) for an additional 48 hours. qRT-PCR of FABP4, where n = 8 (D), and PPARγ, where n = 6 (E). *P < 0.05. (F) Correlation between PPARγ expression and donor’s BMI; n = 6, and P < 0.05. Pearson’s correlation. (G and H) PPARγ activation: PPARγ-UAS-bla HEK 293H cells were plated in a 384-well plate and cultured for 20 hours with aMVEC- or PA-conditioned medium obtained after 24 hours of incubation. Naive medium was used as a control. After the incubation time the assay was resolved as described in Methods, and the fluorescence emission values at 460 nm (blue) and 530 nm (green) were obtained after 90 minutes using a fluorescence plate reader. (G) The bars show the blue/green ratio after background subtraction (medium only, without cells) for each condition tested; n = 6. *P < 0.05; **P < 0.01 compared with naive medium; #P < 0.05 compared with BAS aMVECs. (H) Dose-response of PPARγ-UAS-bla HEK 293H cells exposed to ROSI and resolved with the same assay (n = 4). Bars represent mean ± SEM. Kruskal-Wallis test (AC and G) and Wilcoxon’s signed-rank test (D and E).
Figure 5
Figure 5. Effect of GRP40 ligand and OA in aMVECs and PAs.
Cells were incubated for 24 hours without (BAS) or with 300 μM OA or 100 μM GW9508. qRT-PCR of FABP4 and PPARγ in aMVECs (A and B) or PAs (C and D). Data are from at least 6 experiments. *P < 0.05; ***P < 0.001 compared with BAS. Bars represent mean ± SEM. Kruskal-Wallis test.
Figure 6
Figure 6. Suppressive effect of PPARγ siRNA.
aMVECs were transfected with small interfering control (siC) or small interfering PPARγ (siPPARγ). Twenty-four hours after transfection, medium was changed to stimulation medium without (BAS) or with 300 μM OA or 100 μM GW9508 and incubated for an additional 24 hours. (AD) Western blot analyses were performed using antibodies specific for CD36, PPARγ, FABP4, and actin, used as loading controls. (A) Western blots from 1 representative individual, and vertical lines represent removed and rejoined data from the same Western blot membrane. (BD) Protein levels were analyzed by densitometry, and the bar histograms show protein levels of respective protein normalized to actin from 5 experiments. (E) Western blot membranes from 1 representative individual with the same conditions as above except that aMVECs were incubated with 5 μM ROSI. (F and G) Protein levels were analyzed by densitometry, and the bar histograms show protein levels of respective protein normalized to actin from 5 experiments. Bars represent mean ± SEM. Wilcoxon’s signed-rank test, *P < 0.05.
Figure 7
Figure 7. Suppressive effect of ATGL siRNA.
aMVECs were transfected with siC or small interfering ATGL (siATGL). Twenty-four hours after transfection, medium was changed to stimulation medium without (BAS) or with 300 μM OA or 100 μM GW9508 and incubated for an additional 24 hours. (AD) Western blots were performed using antibodies specific for ATGL, FABP4, CD36, PPARγ, and actin was used as a loading control. Protein levels were analyzed by densitometry, and the bar histograms show protein levels of respective proteins normalized to actin from at least 5 experiments. (E) The figure shows representative Western blots of CD36, ATGL, PPARγ, actin, and FABP4 in cells transfected with siC (left) or with siATGL (right). (F) Microphotographs of aMVECs transfected with RNA interference as described. Cells were treated without (BAS) or with 200 μM OA. The presence of lipids was revealed by Oil Red O staining (original magnification, ×100). (GI) Western blots were performed as above, and data were obtained from at least 6 experiments. (J) Representative Western blots from the same membrane of CD36, ATGL, actin, and FABP4 for cells transfected with siC (left) or with siATGL (right). Vertical lines represent removed and rejoined data from the same Western blot membranes. Bars represent mean ± SEM. Wilcoxon’s signed-rank test; *P < 0.05; **P < 0.01.

References

    1. Gustafson B, Hedjazifar S, Gogg S, Hammarstedt A, Smith U. Insulin resistance and impaired adipogenesis. Trends Endocrinol Metab. 2015;26(4):193–200. doi: 10.1016/j.tem.2015.01.006. - DOI - PubMed
    1. Rosen ED, Spiegelman BM. What we talk about when we talk about fat. Cell. 2014;156(1–2):20–44. - PMC - PubMed
    1. Smith U, Kahn BB. Adipose tissue regulates insulin sensitivity: role of adipogenesis, de novo lipogenesis and novel lipids. J Intern Med. 2016;280(5):465–475. doi: 10.1111/joim.12540. - DOI - PMC - PubMed
    1. Després JP, Lemieux I. Abdominal obesity and metabolic syndrome. Nature. 2006;444(7121):881–887. doi: 10.1038/nature05488. - DOI - PubMed
    1. Zamarron BF, et al. Macrophage proliferation sustains adipose tissue inflammation in formerly obese mice. Diabetes. 2017;66(2):392–406. - PMC - PubMed

Publication types