. 2019 Mar 7;4(5):e97903.
doi: 10.1172/jci.insight.97903.

PTHrP targets HDAC4 and HDAC5 to repress chondrocyte hypertrophy

Affiliations

PTHrP targets HDAC4 and HDAC5 to repress chondrocyte hypertrophy

Shigeki Nishimori et al. JCI Insight. .

Abstract

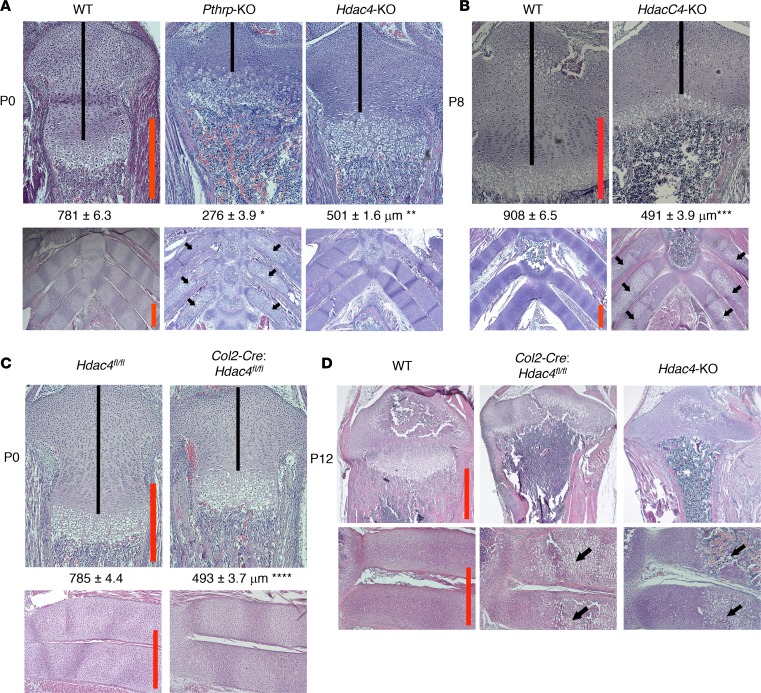
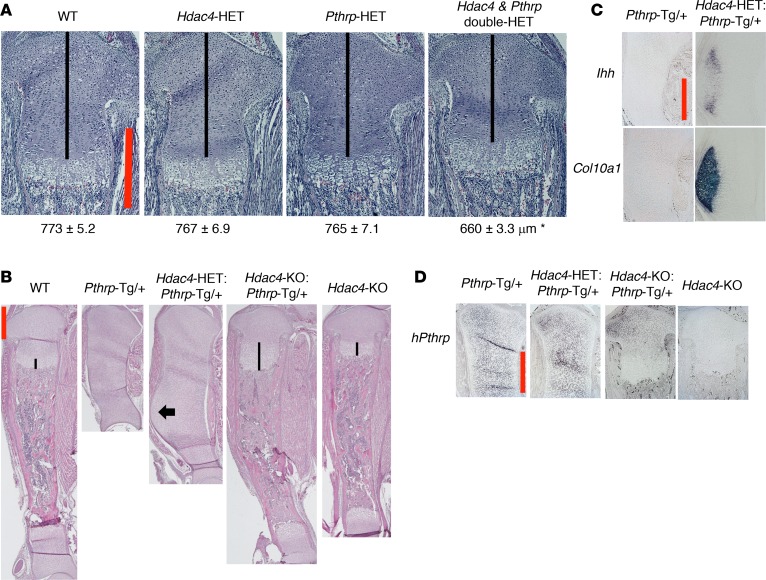
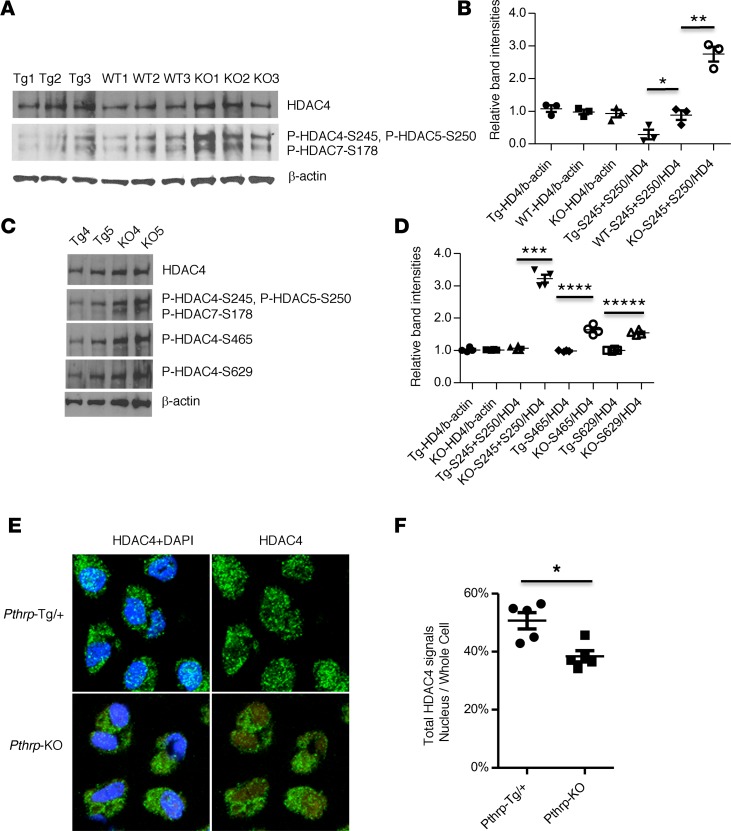
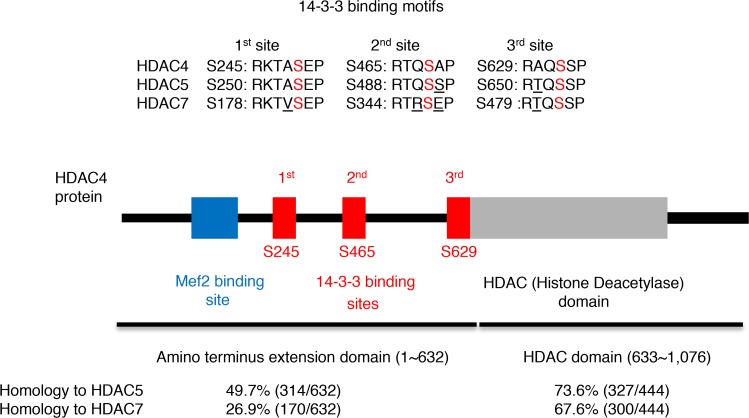
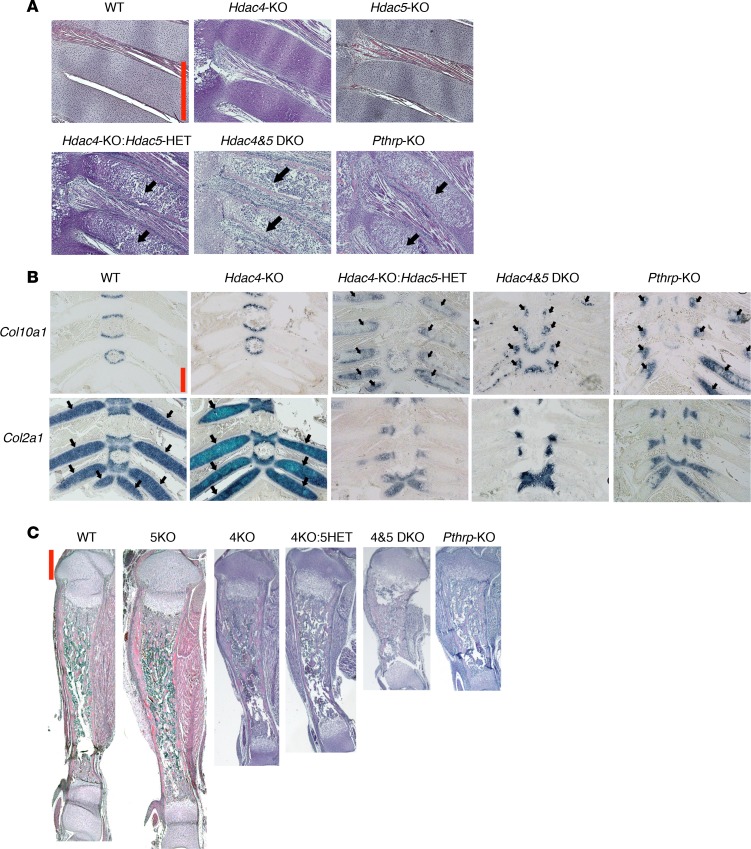
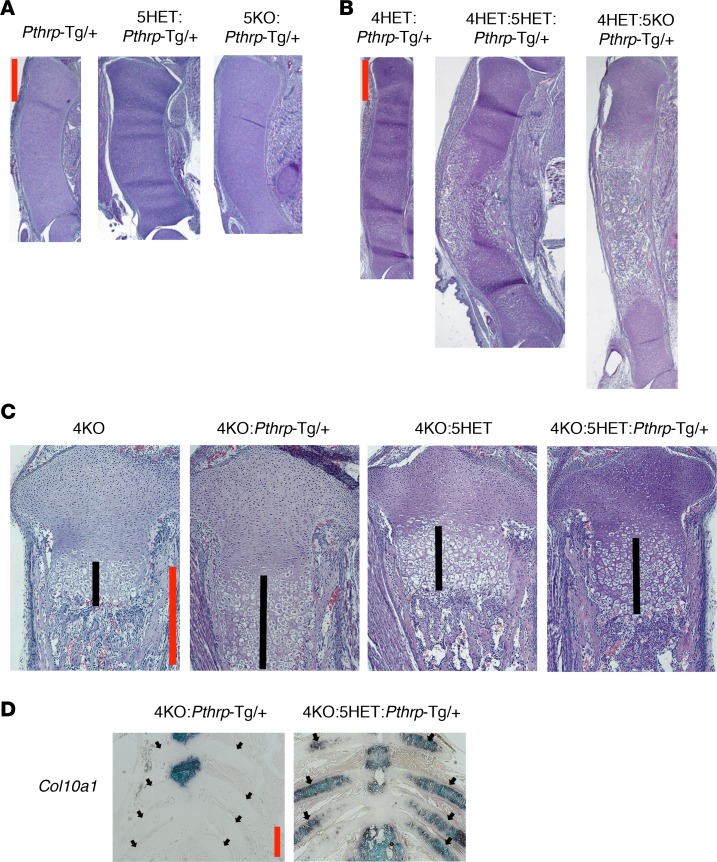
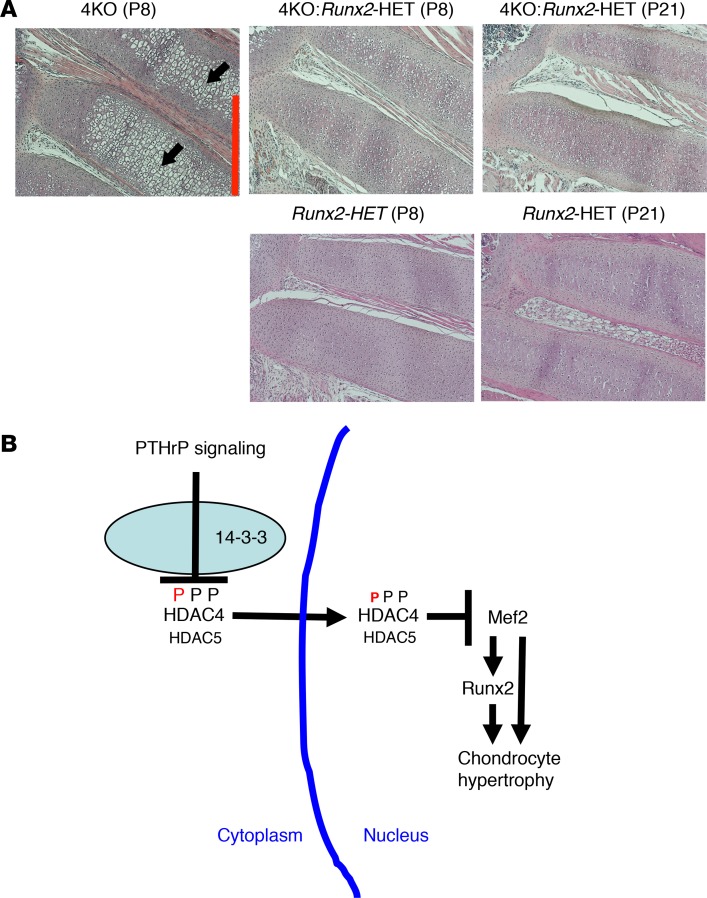
During endochondral bone formation, chondrocyte hypertrophy represents a crucial turning point from chondrocyte differentiation to bone formation. Both parathyroid hormone-related protein (PTHrP) and histone deacetylase 4 (HDAC4) inhibit chondrocyte hypertrophy. Using multiple mouse genetics models, we demonstrate in vivo that HDAC4 is required for the effects of PTHrP on chondrocyte differentiation. We further show in vivo that PTHrP leads to reduced HDAC4 phosphorylation at the 14-3-3-binding sites and subsequent HDAC4 nuclear translocation. The Hdac4-KO mouse shares a similar but milder phenotype with the Pthrp-KO mouse, indicating the possible existence of other mediators of PTHrP action. We identify HDAC5 as an additional mediator of PTHrP signaling. While the Hdac5-KO mouse has no growth plate phenotype at birth, the KO of Hdac5 in addition to the KO of Hdac4 is required to block fully PTHrP action on chondrocyte differentiation at birth in vivo. Finally, we show that PTHrP suppresses myocyte enhancer factor 2 (Mef2) action that allows runt-related transcription factor 2 (Runx2) mRNA expression needed for chondrocyte hypertrophy. Our results demonstrate that PTHrP inhibits chondrocyte hypertrophy and subsequent bone formation in vivo by allowing HDAC4 and HDAC5 to block the Mef2/Runx2 signaling cascade. These results explain the phenotypes of several genetic abnormalities in humans.

Keywords: Bone Biology; Bone development; Development; Genetic diseases; Molecular genetics.


Conflict of interest statement

Conflict of interest: The authors have declared that no conflict of interest exists.

Figures

Figure 1
Figure 1. Accelerated chondrocyte differentiation in the Hdac4-KO skeleton is a milder form of that in the Pthrp-KO skeleton.
H&E staining of the proximal tibial growth plate (original magnification, ×100 [AC, top]; ×40 [D, top]), the anterior rib cage (original magnification, ×40 [A and B, bottom]), and the anterior rib cartilage (original magnification, ×100 [C and D, bottom]) at birth (A and C), P8 (B), and P12 (D). The mice with the same ages are littermates, except the Hdac4-KO mouse in D. To compare the Pthrp-KO mouse and the Hdac4-KO mouse precisely within the same litter, we mated the Hdac4/Pthrp double-HET mouse with the Hdac4/Pthrp double-HET mouse. (A). Numbers represent the average length of the proliferating chondrocyte region (shown by black lines) (mean ± SEM, n = 3, biological triplicates). *P = 7 × 10⁻⁷, **P = 6 × 10⁻⁶, ***P = 8 × 10⁻⁷, ****P = 3 × 10⁻⁶ by the 2-tailed Student’s t test, when compared with its corresponding WT measurement. A P value of less than 0.05 was considered significant. Black arrows indicate rib chondrocyte hypertrophy and mineralization that do not occur in the WT controls. Scale bars (red lines): 500 μm.
Figure 2
Figure 2. PTHrP and HDAC4 work through a common pathway.
(A) H&E staining of the proximal tibial growth plate at birth (original magnification, ×100). The mice shown are littermates. Numbers represent the average length of the proliferating chondrocyte region (shown by black lines) (mean ± SEM, n = 3, biological triplicates). *P < 0.0003 by random intercept linear mixed-effects model (SAS Institute). A P value of less than 0.05 was considered significant. (B) H&E staining of the whole tibia at birth (original magnification, ×20). The mice shown are littermates from mating between the Hdac4-HET mouse and the Hdac4-HET-Pthrp-Tg/+ mouse. Black arrow indicates the flat columnar and hypertrophic chondrocyte region. Black lines indicate the length of hypertrophic chondrocyte layer. The reproducibility of the phenotype was confirmed by 3 independent litters. (C and D) ISH for Ihh mRNA and Col10a1 mRNA at the medial tibia and for human Pthrp mRNA at the proximal tibial growth plate (original magnification, ×100). Same mice as shown in B. Scale bars (red lines): 500 μm.
Figure 3
Figure 3. HDAC4 dephosphorylation and nuclear translocation by PTHrP signaling in vivo.
(A and C) Western blots for the 14-3-3–binding sites (see complete unedited blots in the supplemental material). Whole cell lysate from microdissected proliferating chondrocyte regions in the proximal tibial growth plates at birth. Different sets of animals were used (A, n = 3, biological triplicates; C, n = 2, biological duplicates). Tg, Pthrp-Tg/+; KO, Pthrp-KO. WT1 or WT2 and WT3 are derived from Tg litter or KO litter, respectively (A). Tg1 and Tg2 are littermates. The KO pups are derived from different litters. (B and D) Relative band intensities were calculated from the bands in A (n = 3) or C (n = 2) as well as Supplemental Figure 4A (n = 2). HDAC4 was normalized to β-actin. Phosphorylated HDACs were normalized to HDAC4. S245+S250, the sum of phospho HDAC4-Ser245 and phospho HDAC5-Ser250; S465, phospho HDAC4-Ser465; S629, phospho HDAC4-Ser629. *P = 0.03, **P = 0.002, ***P = 1 × 10⁻⁵, ****P = 4 × 10⁻⁴, *****P = 5 × 10⁻⁵ by the 2-tailed Student’s t test. (E) Representative IHC images by confocal microscopy (original magnification, ×620). Round chondrocytes in the proximal tibial growth plates at birth: green (HDAC4) and blue (DAPI, nuclear stain). (F) Average ratio of total HDAC4 intensities in nuclei to those in whole cells (mean ± SEM, n = 5, biological replicates). The ratio for Pthrp-Tg/+ cells was 50.7% ± 2.4% and for Pthrp-KO cells was 38.4% ± 1.3%. The detailed calculation is shown in Supplemental Figure 4B and Supplemental Table 1. *P < 0.0001 by random intercept linear mixed-effects model (SAS Institute). A P value of less than 0.05 was considered significant (B, D, and F).
Figure 4
Figure 4. HDAC5 as a candidate to complement HDAC4 action.
(Top) Homology of 14-3-3–binding motifs among HDAC4, HDAC5, and HDAC7 proteins. The red letter “S” represents phosphorylated serine. The underlined letters represent the mismatched amino acids. Theses motifs are conserved between mouse and human, except HDAC7-S479 (RAQSSP in human with one mismatch). (Middle) Protein domains of HDAC4. (Bottom) Homology of HDAC4 protein to HDAC5 or HDAC7 in the N-terminal extension domain or in the C-terminal HDAC domain. The protein sequences were analyzed by Clustal Omega, a multiple sequence alignment program.
Figure 5
Figure 5. Identification of HDAC5 as an additional mediator of PTHrP signaling.
(A) H&E staining of the anterior rib cartilage at birth (original magnification, ×100). The mice shown were born from the same parents, except the Pthrp-KO mouse. Black arrows indicate abnormal rib chondrocyte hypertrophy and mineralization. DKO, double KO. The reproducibility of the phenotype was confirmed by at least 2 independent animals. (B) ISH for Col10a1 mRNA and Col2a1 mRNA in the anterior rib cage at birth (original magnification, ×40). Black arrows indicate representative expression areas in the rib cartilage. (C) H&E staining of the whole tibia at birth (original magnification, ×20). 5KO, Hdac5-KO; 4KO, Hdac4-KO; 5HET, Hdac5-HET; 4&5 DKO, Hdac4 & 5 DKO. The same mice are shown in AC. Scale bars (red lines): 500 μm.
Figure 6
Figure 6. HDAC5 mediates PTHrP signaling when HDAC4 expression is low.
(A and B) H&E staining of the whole tibia at birth (original magnification, ×20). The mice shown are littermates (A) or were born from the same parents (B). 4HET, Hdac4-HET. (C) H&E staining of the proximal tibial growth plate at birth (original magnification, ×100). The mice in the first and second images and those in the third and fourth images are littermates, respectively. Black lines indicate the length of hypertrophic chondrocyte layer. (D) ISH for Col10a1 mRNA in the anterior rib cage at birth (original magnification, ×40). Black arrows in the image on the right indicate abnormal Col10a1 mRNA expression in the anterior rib cartilage. Col10a1 mRNA expression is not seen in the anterior rib cartilage in the image on the left (black arrows). Note that Col10a1 mRNA expression seen on the left is in the sternum. The reproducibility of the phenotype was confirmed by 2 independent animals for each genotype. Scale bars (red lines): 500 μm.
Figure 7
Figure 7. The Mef2/Runx2 signaling cascade is repressed by HDAC4/5 through PTHrP action.
(A) H&E staining of the anterior rib cartilage at P8 and P21 (original magnification, ×100). Mice at the same age are littermates. The Hdac4-KO mice die between P10 and P14. Black arrows indicate abnormal rib chondrocyte hypertrophy, which is cancelled by HET deletion of Runx2 (top images). Scale bar (red line): 500 μm. The Runx2-HET mouse exhibits normal rib phenotype (bottom images). (B) Proposed model for developmental regulation of chondrocyte hypertrophy. This model is derived from the data in this manuscript and those in previous reports (20, 21). PTHrP action increases HDAC4 nuclear translocation by decreasing phosphorylation of HDAC4 at the 14-3-3–binding sites. HDAC5 also mediates PTHrP signaling when HDAC4 expression is low. In the nucleus, HDAC4 and HDAC5 block the transcriptional activity of Mef2 through HDAC4/5’s Mef2-binding sites. Mef2 drives chondrocyte hypertrophy both by direct activation and through activation of Runx2 expression. Runx2 works downstream of HDAC4/Mef2 and HDAC5/Mef2 to drive chondrocyte hypertrophy.

References

    1. Kronenberg HM. Developmental regulation of the growth plate. Nature. 2003;423(6937):332–336. doi: 10.1038/nature01657. - DOI - PubMed
    1. Chung UI, Schipani E, McMahon AP, Kronenberg HM. Indian hedgehog couples chondrogenesis to osteogenesis in endochondral bone development. J Clin Invest. 2001;107(3):295–304. doi: 10.1172/JCI11706. - DOI - PMC - PubMed
    1. Kobayashi T, et al. PTHrP and Indian hedgehog control differentiation of growth plate chondrocytes at multiple steps. Development. 2002;129(12):2977–2986. - PubMed
    1. Ono N, Ono W, Nagasawa T, Kronenberg HM. A subset of chondrogenic cells provides early mesenchymal progenitors in growing bones. Nat Cell Biol. 2014;16(12):1157–1167. doi: 10.1038/ncb3067. - DOI - PMC - PubMed
    1. Ono N, Ono W, Mizoguchi T, Nagasawa T, Frenette PS, Kronenberg HM. Vasculature-associated cells expressing nestin in developing bones encompass early cells in the osteoblast and endothelial lineage. Dev Cell. 2014;29(3):330–339. doi: 10.1016/j.devcel.2014.03.014. - DOI - PMC - PubMed

Publication types

MeSH terms