. 2019 May 1;29(5):2211-2227.
doi: 10.1093/cercor/bhz026.

Spatial Patterns of Brain Activity Preferentially Reflecting Transient Pain and Stimulus Intensity

Affiliations

Spatial Patterns of Brain Activity Preferentially Reflecting Transient Pain and Stimulus Intensity

M Liang et al. Cereb Cortex. .

Abstract

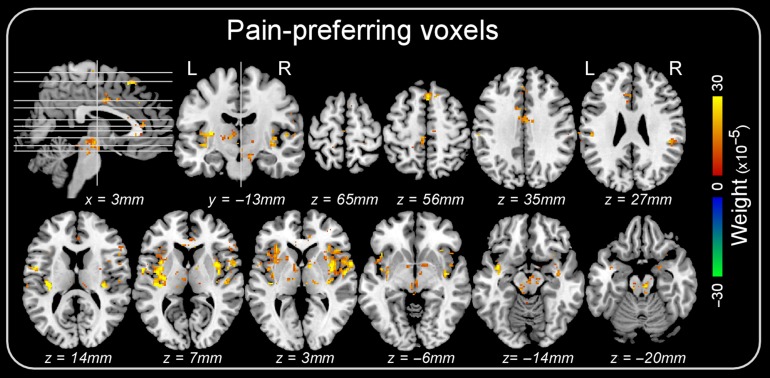
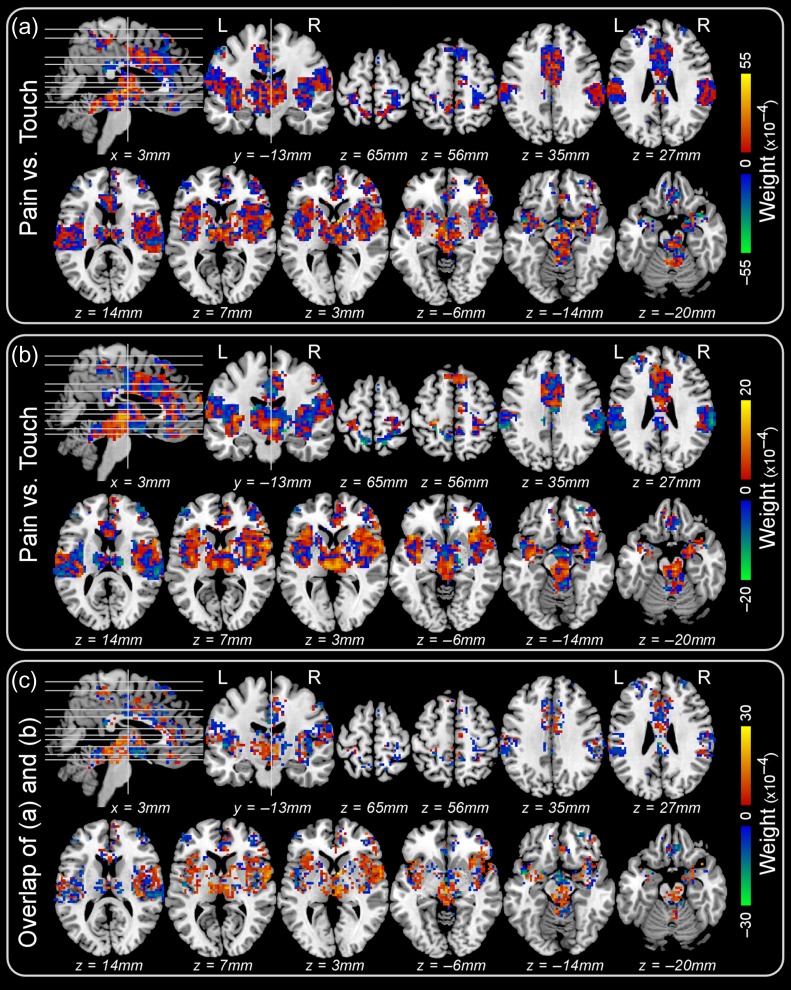
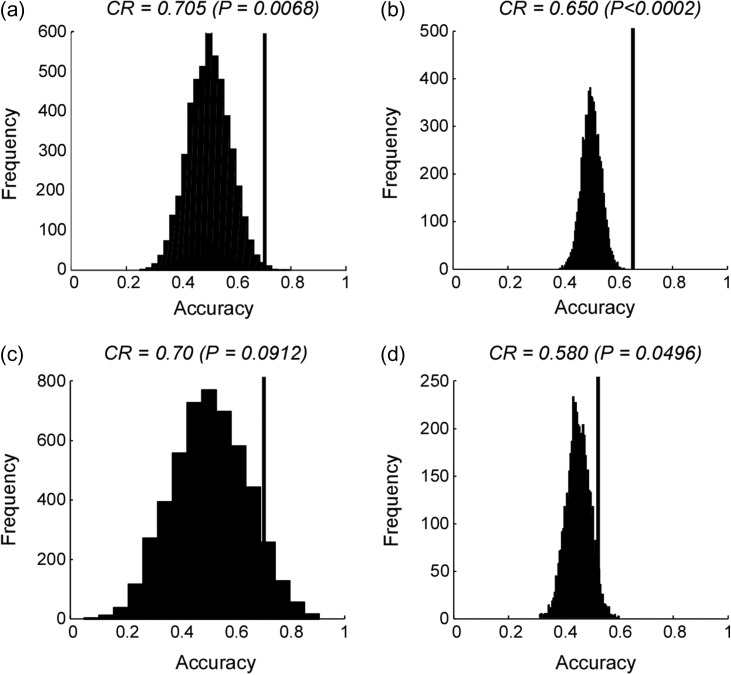
How pain emerges in the human brain remains an unresolved question. Neuroimaging studies have suggested that several brain areas subserve pain perception because their activation correlates with perceived pain intensity. However, painful stimuli are often intense and highly salient; therefore, using both intensity- and saliency-matched control stimuli is crucial to isolate pain-selective brain responses. Here, we used these intensity/saliency-matched painful and non-painful stimuli to test whether pain-selective information can be isolated in the functional magnetic resonance imaging responses elicited by painful stimuli. Using two independent datasets, multivariate pattern analysis was able to isolate features distinguishing the responses triggered by (1) intensity/saliency-matched painful versus non-painful stimuli, and (2) high versus low-intensity/saliency stimuli regardless of whether they elicit pain. This indicates that neural activity in the so-called "pain matrix" is functionally heterogeneous, and part of it carries information related to both painfulness and intensity/saliency. The response features distinguishing these aspects are spatially distributed and cannot be ascribed to specific brain structures.

Keywords: fMRI; multivariate pattern analysis; pain; pain matrix; saliency.


Figures

Figure 1.
Figure 1.
The “pain matrix” areas used in the mass-univariate GLM analyses and in the MVPA. L: left; R: right; S1: primary somatosensory cortex; S2: secondary somatosensory cortex; Ins: insula; ACC: anterior cingulate cortex; Th: thalamus.
Figure 2.
Figure 2.
Results of univariate GLM analysis (a) and ROI-wise analysis (b) obtained from Dataset 2. Panel a: five clusters in the bilateral insula (including both anterior and posterior part) and the right operculum (S2) were detected by GLM analysis to have stronger responses to painful stimuli than to tactile stimuli, and no voxel was detected to have higher responses to tactile stimuli than to painful stimuli. Panel b: BOLD signals and corresponding P-values of “pain vs. touch” comparison (paired t-test) for all explored brain regions. All regions except the bilateral ACC showed significantly higher responses to painful stimuli than to tactile stimuli. The BOLD signal amplitudes are shown as the average and standard deviation across participants. P-values < 0.05 are indicated by asterisks. L: left; R: right; aInsula: anterior insula; pInsula: posterior insula.
Figure 3.
Figure 3.
BOLD signal amplitude in all explored brain regions, along with their corresponding P-values for the three comparisons between the modalities of the eliciting stimuli: pain vs. touch (a), pain vs. audition (b) and pain vs. vision (c). The BOLD signal amplitude are shown as the average and the standard deviation across participants. P-values < 0.05 are indicated by asterisks. L: left; R: right.
Figure 4.
Figure 4.
Within-dataset (a–d) and across-datasets (e, f) classification accuracies of “pain vs. non-pain” classifications obtained from normalized data, along with the corresponding null distributions. Panels a–c: results obtained from Dataset 1 for the three classifications, respectively. Panel d: result obtained from Dataset 2 for the “pain vs. touch” classification. Panel e: result obtained using Dataset 2 as training dataset and Dataset 1 as test dataset. Panel f: result obtained using Dataset 1 as training dataset and Dataset 2 as test dataset. Classification accuracies (correct rate, CR) are indicated by black vertical lines and corresponding null distributions (obtained from 5 000 permutations) are indicated by black bell shapes centered around chance level accuracy of 0.5. P-values were calculated as the proportion of how many (out of 5 000) permutations generated accuracy greater than or equal to the actual classification accuracy. If none out of 5 000 permutations reached the actual accuracy, the P-value is labeled as P < 0.0002 (i.e., <1/5 000).
Figure 5.
Figure 5.
Voxels consistently showing higher BOLD signal during pain across all three classifications (“pain vs. touch,” “pain vs. audition” and “pain vs. vision”) in Dataset 1. Colors code the average weight across the three classifications.
Figure 6.
Figure 6.
Sensitivity maps obtained from the “pain vs. touch” classification across-datasets. Panel a: sensitivity map obtained when the classifier was trained using Dataset 2 and tested on Dataset 1. Panel b: sensitivity map obtained when the classifier was trained using Dataset 1 and tested on Dataset 2. Panel c: overlap (i.e., the voxels of which the weights have consistent sign) between the two sensitivity maps (a) and (b).
Figure 7.
Figure 7.
Within-datasets (a, b) and across-datasets (c, d) classification accuracies of “high vs. low-intensity/saliency” classification obtained from normalized data, along with the corresponding null distributions. Panels a and b: results obtained from Dataset 1 and Dataset 2, respectively. Panel c: result obtained using Dataset 2 as training dataset and Dataset 1 as test dataset. Panel d: result obtained using Dataset 1 as training dataset and Dataset 2 as test dataset. Classification accuracies (correct rate, CR) are indicated by black vertical lines and corresponding null distributions (obtained from 5 000 permutations) are indicated by black bell shapes centered around chance level accuracy of 0.5. P-values were calculated as the proportion of how many (out of 5 000) permutations generated accuracy greater than or equal to the actual classification accuracy. If none out of 5 000 permutations reached the actual accuracy, the P-value is labeled as P < 0.0002 (i.e., <1/5 000).

References

    1. Afif A, Minotti L, Kahane P, Hoffmann D. 2010. Anatomofunctional organization of the insular cortex: a study using intracerebral electrical stimulation in epileptic patients. Epilepsia. 51:2305–2315. - PubMed
    1. Apkarian AV, Bushnell MC, Treede RD, Zubieta JK. 2005. Human brain mechanisms of pain perception and regulation in health and disease. Eur J Pain. 9:463–484. - PubMed
    1. Baliki MN, Chialvo DR, Geha PY, Levy RM, Harden RN, Parrish TB, Apkarian AV. 2006. Chronic pain and the emotional brain: specific brain activity associated with spontaneous fluctuations of intensity of chronic back pain. J Neurosci. 26:12165–12173. - PMC - PubMed
    1. Birn RM, Cornejo MD, Molloy EK, Patriat R, Meier TB, Kirk GR, Nair VA, Meyerand ME, Prabhakaran V. 2014. The influence of physiological noise correction on test-retest reliability of resting-state functional connectivity. Brain Connect. 4:511–522. - PMC - PubMed
    1. Boly M, Faymonville ME, Schnakers C, Peigneux P, Lambermont B, Phillips C, Lancellotti P, Luxen A, Lamy M, Moonen G, et al. . 2008. Perception of pain in the minimally conscious state with PET activation: an observational study. Lancet Neurol. 7:1013–1020. - PubMed

Publication types