

Perfluoroalkyl substances, metabolomic profiling, and alterations in glucose homeostasis among overweight and obese Hispanic children: A proof-of-concept analysis
- PMID: 30844580
- PMCID: PMC6555482
- DOI: 10.1016/j.envint.2019.02.047
Perfluoroalkyl substances, metabolomic profiling, and alterations in glucose homeostasis among overweight and obese Hispanic children: A proof-of-concept analysis
Abstract
Objective: To examine the prospective associations between exposure to perfluoroalkyl substances (PFASs) and longitudinal measurements of glucose metabolism in high-risk overweight and obese Hispanic children.
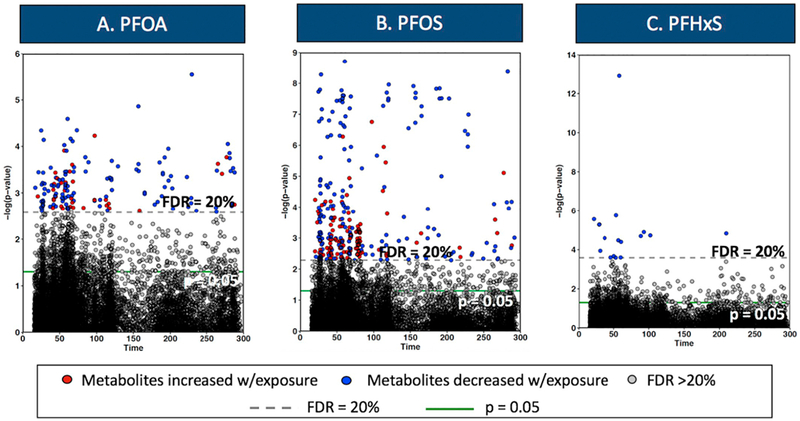
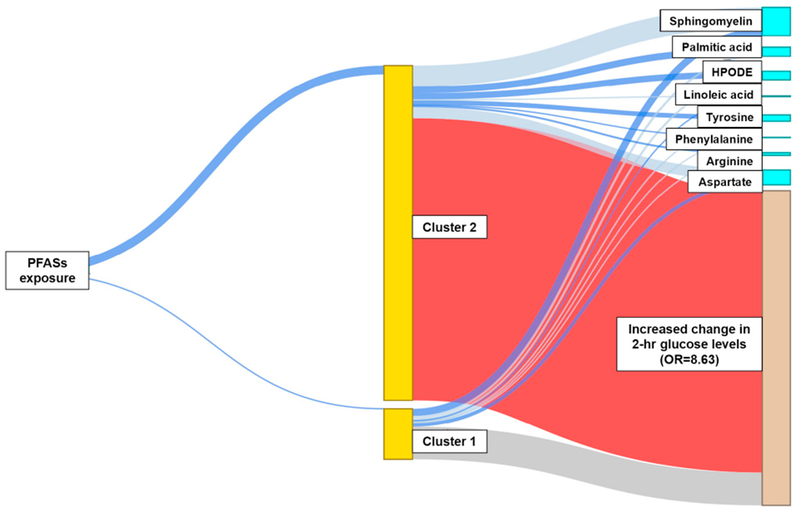
Methods: Forty overweight and obese Hispanic children (8-14 years) from urban Los Angeles underwent clinical measures and 2-hour oral glucose tolerance tests (OGTT) at baseline and a follow-up visit (range: 1-3 years after enrollment). Baseline plasma perfluorooctanoic acid (PFOA), perfluorooctane sulfonate (PFOS), perfluorohexane sulfonic acid (PFHxS), and the plasma metabolome were measured by liquid-chromatography with high-resolution mass spectrometry. Multiple linear regression models were used to assess the association between baseline PFASs and changes in glucose homeostasis over follow-up. A metabolome-wide association study coupled with pathway enrichment analysis was performed to evaluate metabolic dysregulation associated with plasma PFASs concentrations. We performed a structural integrated analysis aiming to characterize the joint impact of all factors and to identify latent clusters of children with alterations in glucose homeostasis, based on their exposure and metabolomics profile.
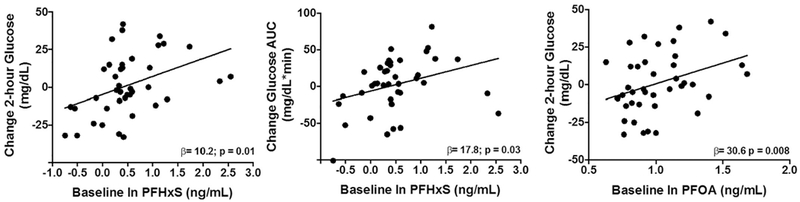
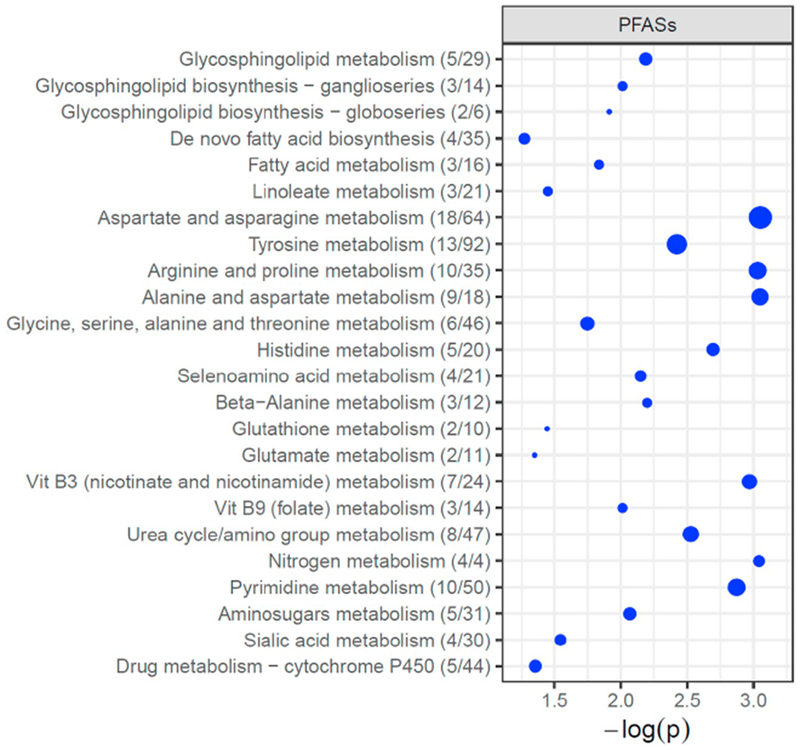
Results: Each ln (ng/ml) increase in PFOA and PFHxS concentrations was associated with a 30.6 mg/dL (95% CI: 8.8-52.4) and 10.2 mg/dL (95% CI: 2.7-17.7) increase in 2-hour glucose levels, respectively. A ln (ng/ml) increase in PFHxS concentrations was also associated with 17.8 mg/dL increase in the glucose area under the curve (95% CI: 1.5-34.1). Pathway enrichment analysis showed significant alterations of lipids (e.g., glycosphingolipids, linoleic acid, and de novo lipogenesis), and amino acids (e.g., aspartate and asparagine, tyrosine, arginine and proline) in association to PFASs exposure. The integrated analysis identified a cluster of children with increased 2-h glucose levels over follow up, characterized by increased PFAS levels and altered metabolite patterns.
Conclusions: This proof-of-concept analysis shows that higher PFAS exposure was associated with dysregulation of several lipid and amino acid pathways and longitudinal alterations in glucose homeostasis in Hispanic youth. Larger studies are needed to confirm these findings and fully elucidate the underlying biological mechanisms.
Keywords: Children; Glucose metabolism; Metabolomics; Perfluoroalkyl substances; Type 2 diabetes.
Copyright © 2019 The Authors. Published by Elsevier Ltd.. All rights reserved.
Conflict of interest statement
Conflict of interest
The authors declare that they have no conflict of interest.
Figures
References
-
- Aerts JM, Boot RG, van Eijk M, Groener J, Bijl N, Lombardo E, et al. , 2011. Glycosphingolipids and insulin resistance. Adv. Exp. Med. Biol 721, 99–119. - PubMed
-
- Alonso-Magdalena P, Quesada I, Nadal A, 2011. Endocrine disrupters in the etiology of type 2 diabetes mellitus. Nat. Rev. Endocrinol 7 (6), 346–353. - PubMed
-
- Andrianou XD, Charisiadis P, Makris KC, 2017. Coupling urinary trihalomethanes and metabolomic profiles of type II diabetes: a case-control study. J. Proteome Res 16 (8), 2743–2751. - PubMed
Publication types
MeSH terms
Substances
Grants and funding
- K99 ES027870/ES/NIEHS NIH HHS/United States
- P30 ES007048/ES/NIEHS NIH HHS/United States
- R01 DK059211/DK/NIDDK NIH HHS/United States
- U2C ES026560/ES/NIEHS NIH HHS/United States
- F32 ES029828/ES/NIEHS NIH HHS/United States
- R00 ES027870/ES/NIEHS NIH HHS/United States
- R01 MH107205/MH/NIMH NIH HHS/United States
- P30 ES019776/ES/NIEHS NIH HHS/United States
- P01 CA196569/CA/NCI NIH HHS/United States
- R00 ES027853/ES/NIEHS NIH HHS/United States
- P30 ES000002/ES/NIEHS NIH HHS/United States
- T32 ES012870/ES/NIEHS NIH HHS/United States
- R21 ES028903/ES/NIEHS NIH HHS/United States
- R01 ES016813/ES/NIEHS NIH HHS/United States
- R01 CA140561/CA/NCI NIH HHS/United States
- S10 OD018006/OD/NIH HHS/United States
LinkOut - more resources
Full Text Sources
