Thermopneumatic suction integrated microfluidic blood analysis system
- PMID: 30845239
- PMCID: PMC6405101
- DOI: 10.1371/journal.pone.0208676
Thermopneumatic suction integrated microfluidic blood analysis system
Abstract
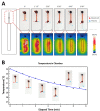
Blood tests provide crucial diagnostic information regarding several diseases. A key factor that affects the precision and accuracy of blood tests is the interference of red blood cells; however, the conventional methods of blood separation are often complicated and time consuming. In this study, we devised a simple but high-efficiency blood separation system on a self-strained microfluidic device that separates 99.7 ± 0.3% of the plasma in only 6 min. Parameters, such as flow rate, design of the filter trench, and the relative positions of the filter trench and channel, were optimized through microscopic monitoring. Moreover, this air-difference-driven device uses a cost-effective and easy-to-use heater device that creates a low-pressure environment in the microchannel within minutes. With the aforementioned advantages, this blood separation device could be another platform choice for point-of-care testing.
Conflict of interest statement
The authors have declared that no competing interests exist.
Figures


Similar articles
-
Nano-Interstice Driven Powerless Blood Plasma Extraction in a Membrane Filter Integrated Microfluidic Device.Sensors (Basel). 2021 Feb 15;21(4):1366. doi: 10.3390/s21041366. Sensors (Basel). 2021. PMID: 33671983 Free PMC article.
-
A Microfluidic Device for Simultaneous Extraction of Plasma, Red Blood Cells, and On-Chip White Blood Cell Trapping.Sci Rep. 2018 Oct 18;8(1):15345. doi: 10.1038/s41598-018-33738-8. Sci Rep. 2018. PMID: 30337656 Free PMC article.
-
Design and preparation of centrifugal microfluidic chip integrated with SERS detection for rapid diagnostics.Talanta. 2019 Mar 1;194:903-909. doi: 10.1016/j.talanta.2018.11.014. Epub 2018 Nov 5. Talanta. 2019. PMID: 30609623
-
Nucleic acid diagnostics on the total integrated lab-on-a-disc for point-of-care testing.Biosens Bioelectron. 2019 Sep 15;141:111466. doi: 10.1016/j.bios.2019.111466. Epub 2019 Jun 24. Biosens Bioelectron. 2019. PMID: 31254863 Review.
-
Point of care testing: The impact of nanotechnology.Biosens Bioelectron. 2017 Jan 15;87:373-387. doi: 10.1016/j.bios.2016.08.084. Epub 2016 Aug 26. Biosens Bioelectron. 2017. PMID: 27589400 Review.
Cited by
-
Rapid and Safe Isolation of Human Peripheral Blood B and T Lymphocytes through Spiral Microfluidic Channels.Sci Rep. 2019 May 31;9(1):8145. doi: 10.1038/s41598-019-44677-3. Sci Rep. 2019. PMID: 31148602 Free PMC article.
-
A Noninvasive Wearable Device for Real-Time Monitoring of Secretion Sweat Pressure by Digital Display.iScience. 2020 Oct 8;23(11):101658. doi: 10.1016/j.isci.2020.101658. eCollection 2020 Nov 20. iScience. 2020. PMID: 33117969 Free PMC article.
-
Flow analysis on microcasting with degassed polydimethylsiloxane micro-channels for cell patterning with cross-linked albumin.PLoS One. 2020 May 20;15(5):e0232518. doi: 10.1371/journal.pone.0232518. eCollection 2020. PLoS One. 2020. PMID: 32433673 Free PMC article.
-
Blood Plasma Self-Separation Technologies during the Self-Driven Flow in Microfluidic Platforms.Bioengineering (Basel). 2021 Jul 3;8(7):94. doi: 10.3390/bioengineering8070094. Bioengineering (Basel). 2021. PMID: 34356201 Free PMC article. Review.
-
Disposable Polymeric Nanostructured Plasmonic Biosensors for Cell Culture Adhesion Monitoring.Front Bioeng Biotechnol. 2021 Dec 6;9:799325. doi: 10.3389/fbioe.2021.799325. eCollection 2021. Front Bioeng Biotechnol. 2021. Retraction in: Front Bioeng Biotechnol. 2025 Feb 27;13:1581078. doi: 10.3389/fbioe.2025.1581078. PMID: 34938725 Free PMC article. Retracted.
References
-
- Chen KI, Li BR, Chen YT. Silicon nanowire field-effect transistor-based biosensors for biomedical diagnosis and cellular recording investigation. Nano Today. 2011;6(2):131–54. 10.1016/j.nantod.2011.02.001 ISI:000290507200007. - DOI
Publication types
MeSH terms
LinkOut - more resources
Full Text Sources

