

Sample size calculation for estimating key epidemiological parameters using serological data and mathematical modelling
- PMID: 30845904
- PMCID: PMC6407263
- DOI: 10.1186/s12874-019-0692-1
Sample size calculation for estimating key epidemiological parameters using serological data and mathematical modelling
Abstract
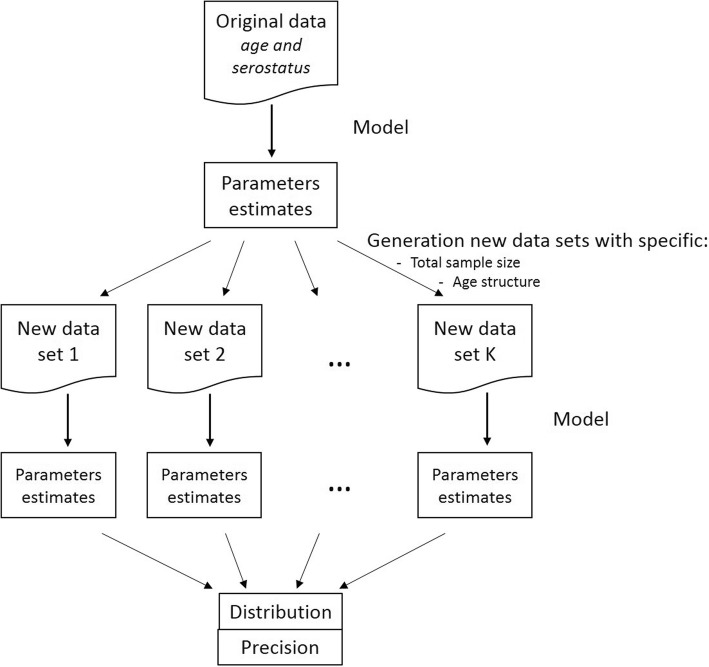
Background: Our work was motivated by the need to, given serum availability and/or financial resources, decide on which samples to test in a serum bank for different pathogens. Simulation-based sample size calculations were performed to determine the age-based sampling structures and optimal allocation of a given number of samples for testing across various age groups best suited to estimate key epidemiological parameters (e.g., seroprevalence or force of infection) with acceptable precision levels in a cross-sectional seroprevalence survey.
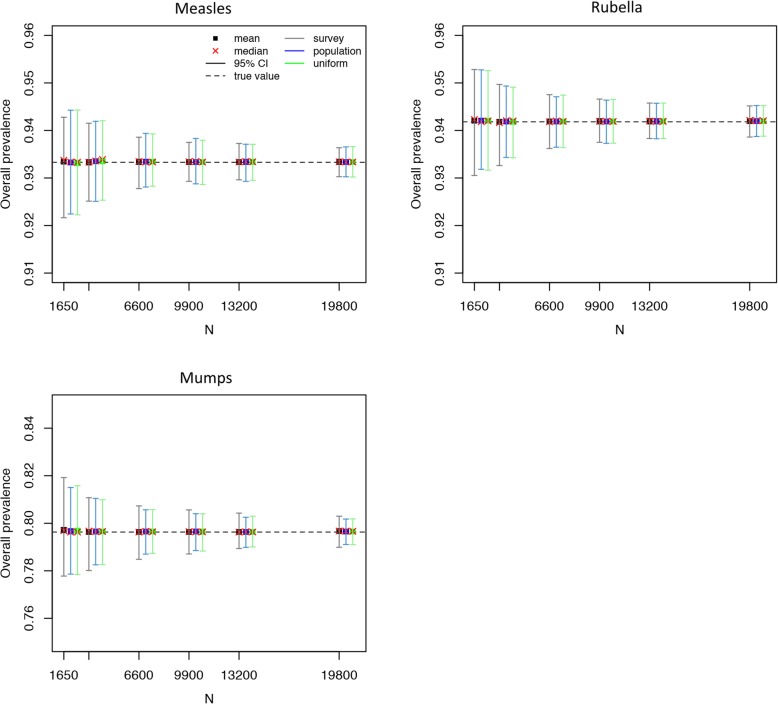
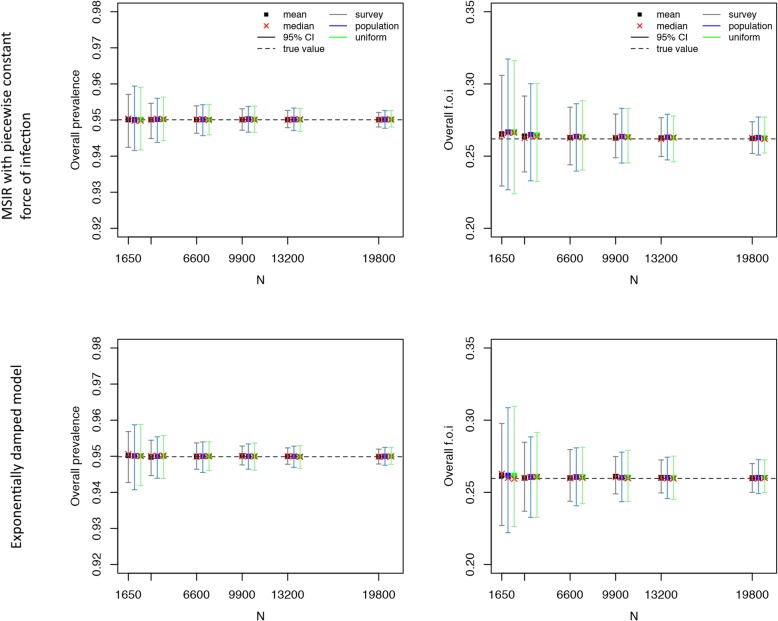
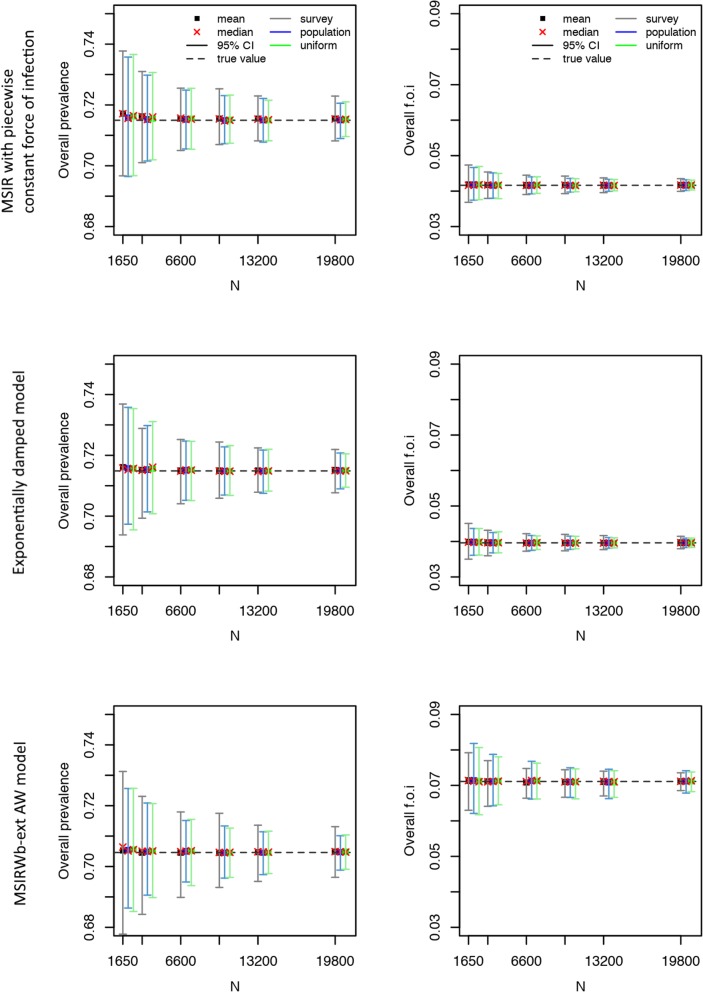
Methods: Statistical and mathematical models and three age-based sampling structures (survey-based structure, population-based structure, uniform structure) were used. Our calculations are based on Belgian serological survey data collected in 2001-2003 where testing was done, amongst others, for the presence of Immunoglobulin G antibodies against measles, mumps, and rubella, for which a national mass immunisation programme was introduced in 1985 in Belgium, and against varicella-zoster virus and parvovirus B19 for which the endemic equilibrium assumption is tenable in Belgium.
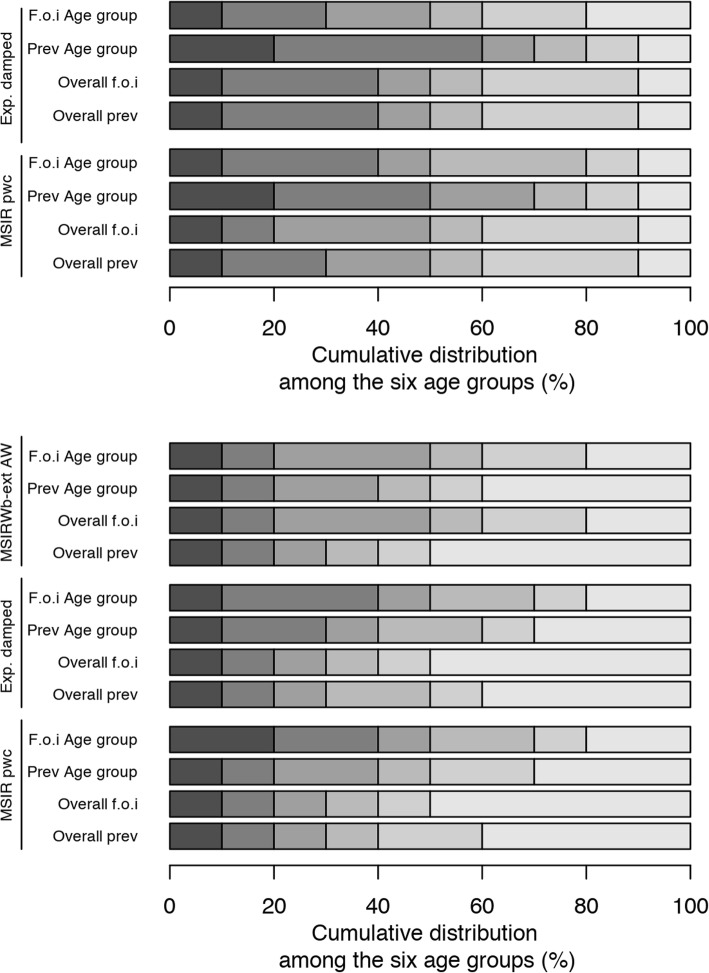
Results: The optimal age-based sampling structure to use in the sampling of a serological survey as well as the optimal allocation distribution varied depending on the epidemiological parameter of interest for a given infection and between infections.
Conclusions: When estimating epidemiological parameters with acceptable levels of precision within the context of a single cross-sectional serological survey, attention should be given to the age-based sampling structure. Simulation-based sample size calculations in combination with mathematical modelling can be utilised for choosing the optimal allocation of a given number of samples over various age groups.
Keywords: Allocation; Infectious diseases; Mathematical models; Precision; Sample size; Study design.
Conflict of interest statement
Ethics approval and consent to participate
Ethical approval for the setup of the 2002 serum set was obtained from the Ethics Committee of the University of Antwerp. Since the samples were de-identified, consent was deemed unnecessary according to national regulations (decrees KB 13/02/2001 and KB 17/12/2003).
Consent for publication
Not applicable.
Competing interests
The authors declare that they have no competing interests.
Publisher’s Note
Springer Nature remains neutral with regard to jurisdictional claims in published maps and institutional affiliations.
Figures
Similar articles
-
Seroprevalence of measles, mumps and rubella antibodies in Luxembourg: results from a national cross-sectional study.Epidemiol Infect. 2004 Jan;132(1):11-8. doi: 10.1017/s0950268803001584. Epidemiol Infect. 2004. PMID: 14979584 Free PMC article.
-
Seroprevalence of measles, rubella, and mumps antibodies in Catalonia, Spain: results of a cross-sectional study.Eur J Clin Microbiol Infect Dis. 2006 May;25(5):310-7. doi: 10.1007/s10096-006-0133-z. Eur J Clin Microbiol Infect Dis. 2006. PMID: 16786377
-
[Seroprevalence of antibodies against measles, rubella, mumps and varicella among school children in Madrid].An Esp Pediatr. 1999 May;50(5):459-62. An Esp Pediatr. 1999. PMID: 10394183 Spanish.
-
[Evolution of measles, rubella and mumps from the third seroepidemiological survey in the autonomous region of Madrid, Spain].Rev Esp Salud Publica. 2009 Sep-Oct;83(5):625-37. Rev Esp Salud Publica. 2009. PMID: 20111811 Spanish.
-
Serodynamics: A primer and synthetic review of methods for epidemiological inference using serological data.Epidemics. 2024 Dec;49:100806. doi: 10.1016/j.epidem.2024.100806. Epub 2024 Nov 30. Epidemics. 2024. PMID: 39647462 Free PMC article. Review.
Cited by
-
Seroprevalence of Measles Antibodies in a Highly MMR-Vaccinated Population.Vaccines (Basel). 2022 Nov 3;10(11):1859. doi: 10.3390/vaccines10111859. Vaccines (Basel). 2022. PMID: 36366367 Free PMC article.
-
Prevalence and predictors of anti-SARS-CoV-2 serology in a highly vulnerable population of Rio de Janeiro: A population-based serosurvey.Lancet Reg Health Am. 2022 Nov;15:100338. doi: 10.1016/j.lana.2022.100338. Epub 2022 Jul 30. Lancet Reg Health Am. 2022. PMID: 35936224 Free PMC article.
-
Ovine Neosporosis: The Current Global Situation.Animals (Basel). 2022 Aug 15;12(16):2074. doi: 10.3390/ani12162074. Animals (Basel). 2022. PMID: 36009665 Free PMC article. Review.
-
A simulation-based method to inform serosurvey design for estimating the force of infection using existing blood samples.PLoS Comput Biol. 2023 Nov 27;19(11):e1011666. doi: 10.1371/journal.pcbi.1011666. eCollection 2023 Nov. PLoS Comput Biol. 2023. PMID: 38011203 Free PMC article.
-
Systematic review and meta-analysis of clinical outcomes comparison between different initial dialysis modalities in end-stage renal disease patients due to lupus nephritis prior to renal transplantation.BMC Nephrol. 2020 May 1;21(1):156. doi: 10.1186/s12882-020-01811-y. BMC Nephrol. 2020. PMID: 32357924 Free PMC article.
References
-
- Hens N, Shkedy Z, Aerts M, Faes C, Van Damme P, Beutels P. Modeling infectious disease parameters based on serological and social contact data: a modern statistical perspective. New York: Springer; 2012.
-
- Keiding N. Age-specific incidence and prevalence - a statistical perspective. J R Stat Soc Ser A Stat Soc. 1991;154:371–412. doi: 10.2307/2983150. - DOI
Publication types
MeSH terms
Substances
LinkOut - more resources
Full Text Sources
Medical
