

De novo comparative transcriptome analysis of a rare cicada, with identification of candidate genes related to adaptation to a novel host plant and drier habitats
- PMID: 30845906
- PMCID: PMC6407286
- DOI: 10.1186/s12864-019-5547-y
De novo comparative transcriptome analysis of a rare cicada, with identification of candidate genes related to adaptation to a novel host plant and drier habitats
Abstract
Background: Although the importance of host plant chemistry in plant-insect interactions is widely recognized, our understanding about the genetic basis underlying the relationship between changes in midgut proteins and adaptation of plant-feeding insects to novel host plants and habitats is very limited. To address this knowledge gap, the transcriptional profiles of midguts among three populations of the cicada Subpsaltria yangi Chen were compared. Among which, the Hancheng (HC) and Fengxiang (FX) populations occurring in the Loess Plateau feed on Ziziphus jujuba Mill. var. spinosa (Bunge) Hu ex H. F. Chow, while the population occurring in a much drier habitat in the Helan (HL) Mountains is locally specialized on a chemically divergent plant, Ephedra lepidosperma C. Y. Cheng.
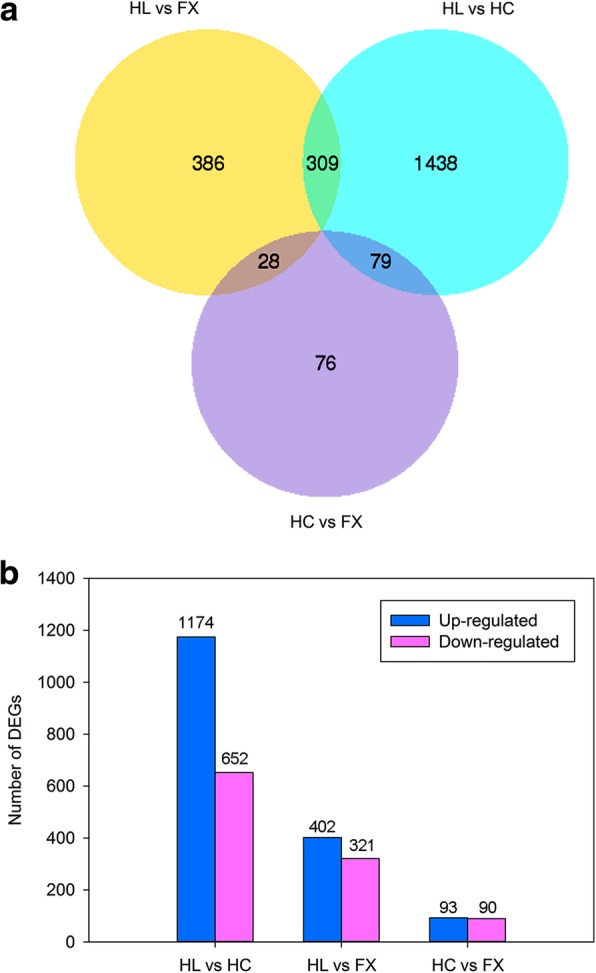
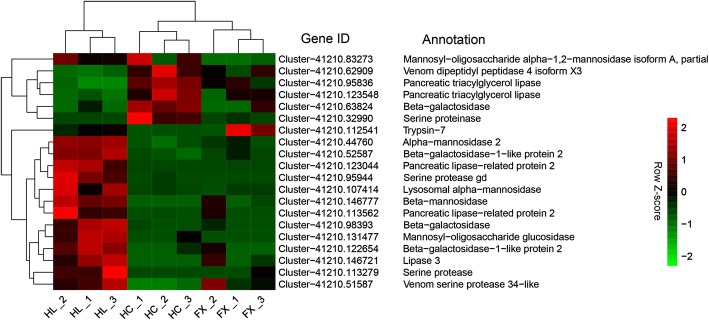
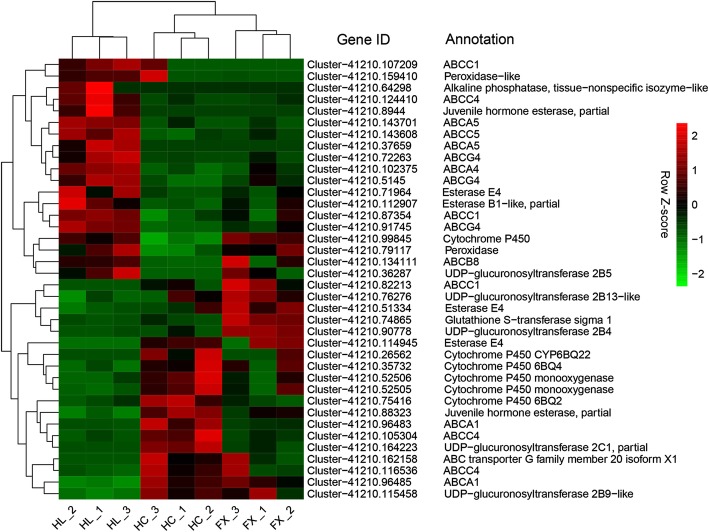
Results: Based on comparative analysis, 1826 (HL vs HC) differentially expressed genes (DEGs) and 723 DEGs (HL vs FX) were identified between the populations utilizing different host plants, including 20, 36, 2, 5 and 2 genes related to digestion, detoxification, oxidation-reduction, stress response and water-deprivation response, respectively, and 35 genes presumably associated with osmoregulation. However, only 183 DEGs were identified between the HC and FX populations, including two genes related to detoxification, two genes related to stress response, and one gene presumably associated with osmoregulation. These results suggest that the weakest expression differences were between the populations utilizing the same host plant and occurring in the closest habitats, which may help explain the metabolic mechanism of adaptation in S. yangi populations to novel host plants and new niches.
Conclusions: The observed differences in gene expression among S. yangi populations are consistent with the hypothesis that the host plant shift and habitat adaptation in the HL population was facilitated by differential regulation of genes related to digestion, detoxification, oxidation-reduction, stress response, water-deprivation response and osmoregulation. The results may inform future studies on the molecular mechanisms underlying the relationship between changes in midgut proteins and adaptation of herbivorous insects to novel host plants and new niches.
Keywords: Cicadidae; Host adaptation; Host shift; Midgut; Plasticity; RNA-Seq; Transcriptional variation.
Conflict of interest statement
Ethics approval and consent to participate
This study was carried out in full compliance with the laws of the People’s Republic of China. No specific permits were required for our field investigation. The study species is not included in the ‘List of Protected Animals in China’.
Consent for publication
Not applicable.
Competing interests
The authors declare that they have no competing interests.
Publisher’s Note
Springer Nature remains neutral with regard to jurisdictional claims in published maps and institutional affiliations.
Figures


Similar articles
-
Comparative sialotranscriptome analysis of the rare Chinese cicada Subpsaltria yangi, with identification of candidate genes related to host-plant adaptation.Int J Biol Macromol. 2019 Jun 1;130:323-332. doi: 10.1016/j.ijbiomac.2019.02.132. Epub 2019 Feb 23. Int J Biol Macromol. 2019. PMID: 30807802
-
The impact of geographic isolation and host shifts on population divergence of the rare cicada Subpsaltria yangi.Mol Phylogenet Evol. 2024 Oct;199:108146. doi: 10.1016/j.ympev.2024.108146. Epub 2024 Jul 8. Mol Phylogenet Evol. 2024. PMID: 38986756
-
Genetic divergence, population differentiation and phylogeography of the cicada Subpsaltria yangi based on molecular and acoustic data: an example of the early stage of speciation?BMC Evol Biol. 2019 Jan 8;19(1):5. doi: 10.1186/s12862-018-1317-8. BMC Evol Biol. 2019. PMID: 30621591 Free PMC article.
-
Genomics of adaptation to host-plants in herbivorous insects.Brief Funct Genomics. 2015 Nov;14(6):413-23. doi: 10.1093/bfgp/elv015. Epub 2015 Apr 6. Brief Funct Genomics. 2015. PMID: 25846754 Review.
-
Behavioral assays for studies of host plant choice and adaptation in herbivorous insects.Annu Rev Entomol. 2014;59:263-78. doi: 10.1146/annurev-ento-011613-161945. Epub 2013 Oct 18. Annu Rev Entomol. 2014. PMID: 24160429 Review.
Cited by
-
Genomic insight into the scale specialization of the biological control agent Novius pumilus (Weise, 1892).BMC Genomics. 2022 Jan 31;23(1):90. doi: 10.1186/s12864-022-08299-w. BMC Genomics. 2022. PMID: 35100986 Free PMC article.
-
Behavioral and Physiological Plasticity Provides Insights into Molecular Based Adaptation Mechanism to Strain Shift in Spodoptera frugiperda.Int J Mol Sci. 2021 Sep 24;22(19):10284. doi: 10.3390/ijms221910284. Int J Mol Sci. 2021. PMID: 34638623 Free PMC article.
-
Gene expression profiles in Malpighian tubules of the vector leafhopper Psammotettix striatus (L.) revealed regional functional diversity and heterogeneity.BMC Genomics. 2022 Jan 21;23(1):67. doi: 10.1186/s12864-022-08300-6. BMC Genomics. 2022. PMID: 35057738 Free PMC article.
-
Females prefer males producing a high-rate song with shorter timbal-stridulatory sound intervals in a cicada species.Curr Zool. 2021 Jul 28;68(1):103-112. doi: 10.1093/cz/zoab061. eCollection 2022 Feb. Curr Zool. 2021. PMID: 35169633 Free PMC article.
-
Role of Genes in Regulating Host Plants Expansion in Tephritid Fruit Flies (Diptera) and Potential for RNAi-Based Control.J Insect Sci. 2022 Jul 1;22(4):10. doi: 10.1093/jisesa/ieac047. J Insect Sci. 2022. PMID: 35983691 Free PMC article. Review.
References
-
- Cronin JT, Abrahamson WG. Do parasitoids diversify in response to host-plant shifts by herbivorous insects. Ecol Entomol. 2001;26:347–355.
-
- Vogel H, Musser RO, Celorio-Mancera M. Transcriptome responses in herbivorous insects towards host plant and toxin feeding. Annu Plant Rev. 2014;47:197–233.
-
- Tilmon KJ. Specialization, speciation, and radiation: the evolutionary biology of herbivorous insects. Berkeley: University of California Press; 2008.
-
- Chen KF. New genera and species of Chinese cicadas with synonymical and nomenclatorial notes. J New York Entomol Soc. 1943;51:19–52.
-
- Chou I, Lei Z, Li L, Lu X, Yao W. The Cicadidae of China (Homoptera: Cicadoidea) Hong Kong: Tianze Press; 1997.
Publication types
MeSH terms
Grants and funding
LinkOut - more resources
Full Text Sources
Miscellaneous
