

Deprivation-specific life tables using multivariable flexible modelling - trends from 2000-2002 to 2010-2012, Portugal
- PMID: 30845935
- PMCID: PMC6407195
- DOI: 10.1186/s12889-019-6579-6
Deprivation-specific life tables using multivariable flexible modelling - trends from 2000-2002 to 2010-2012, Portugal
Abstract
Background: Completing mortality data by information on possible socioeconomic inequalities in mortality is crucial for policy planning. The aim of this study was to build deprivation-specific life tables using the Portuguese version of the European Deprivation Index (EDI) as a measure of area-level socioeconomic deprivation, and to evaluate mortality trends between the periods 2000-2002 and 2010-2012.
Methods: Statistics Portugal provided the counts of deaths and population by sex, age group, calendar year and area of residence (parish). A socioeconomic deprivation level was assigned to each parish according to the quintile of their national EDI distribution. Death counts were modelled within the generalised linear model framework as a function of age, deprivation level and calendar period. Mortality Rate Ratios (MRR) were estimated to evaluate variations in mortality between deprivation groups and periods.
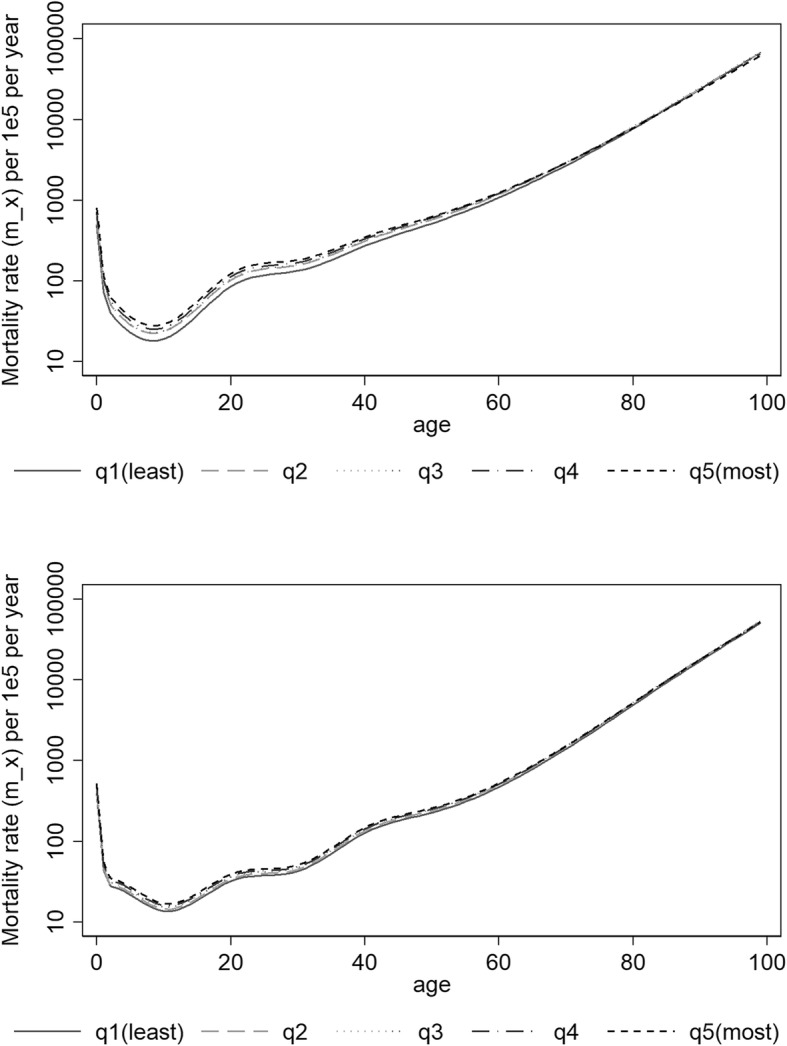
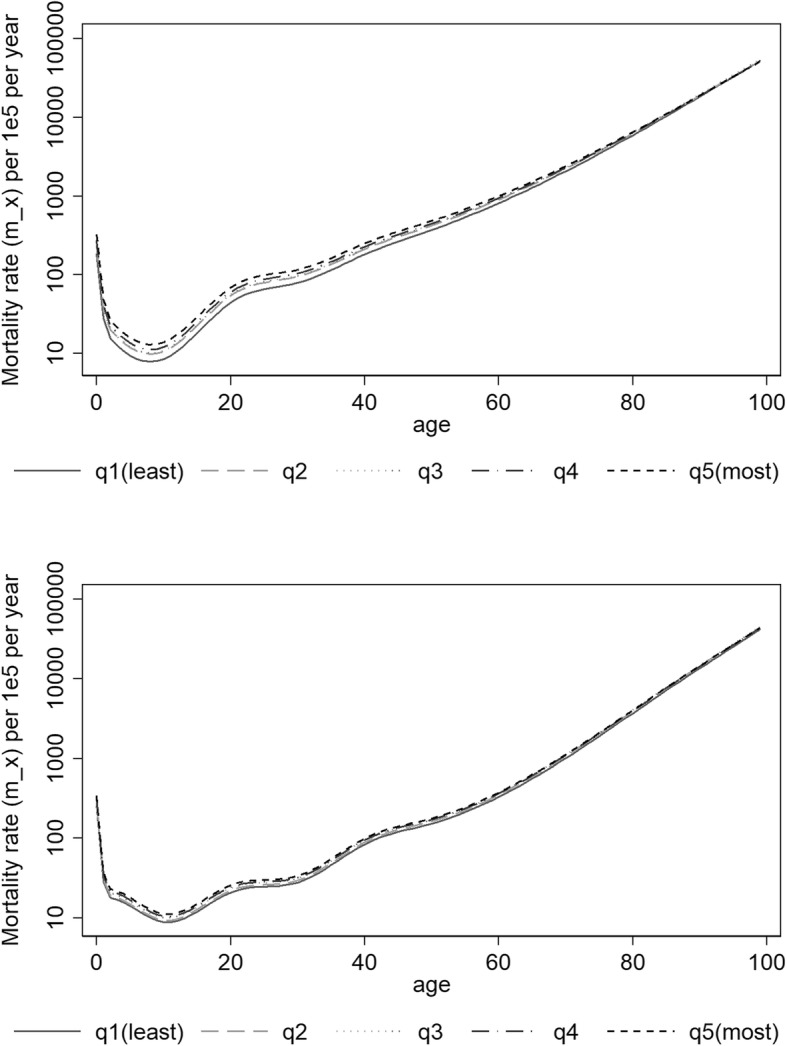
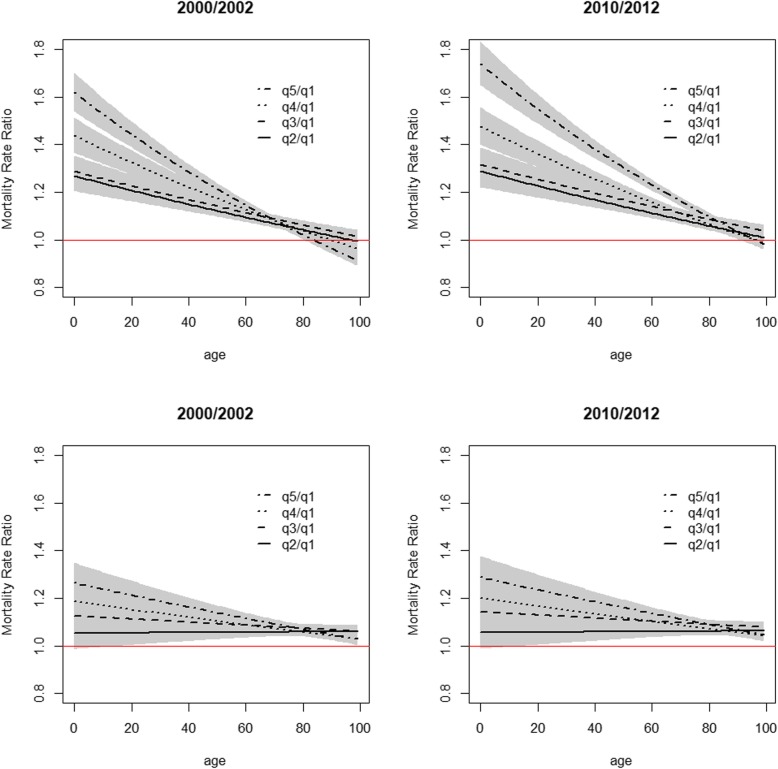
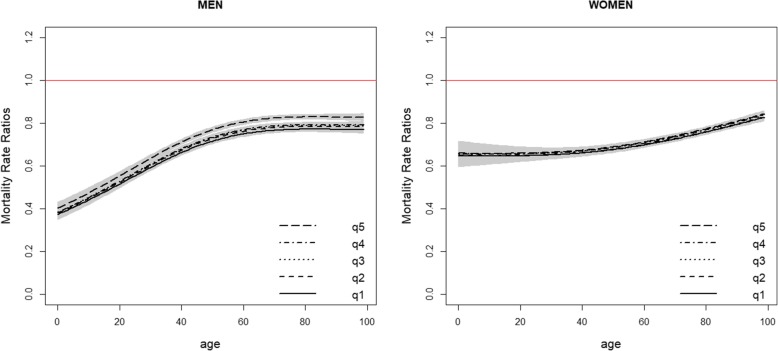
Results: Life expectancy at birth increased from 74.0 and 80.9 years in 2000-2002, for men and women, respectively, and to 77.6 and 83.8 years in 2010-2012. Yet, life expectancy at birth differed by deprivation, with, compared to least deprived population, a deficit of about 2 (men) and 1 (women) years among most deprived in the whole study period. The higher mortality experienced by most deprived groups at birth (in 2010-2012, mortality rate ratios of 1.74 and 1.29 in men and women, respectively) progressively disappeared with increasing age.
Conclusions: Persistent differences in mortality and life expectancy were observed according to ecological socioeconomic deprivation. These differences were larger among men and mostly marked at birth for both sexes.
Keywords: Deprivation; Health inequalities; Life-tables; Multivariable modelling; Socioeconomic factors.
Conflict of interest statement
Ethics approval and consent to participate
Only aggregated data publicly available from the Statistics Portugal office was used exempting special permissions for its use. No ethics approval was needed for this study.
Consent for publication
Not applicable.
Competing interests
The authors declare that they have no competing interests.
Publisher’s Note
Springer Nature remains neutral with regard to jurisdictional claims in published maps and institutional affiliations.
Figures
Similar articles
-
Global, regional, and national under-5 mortality, adult mortality, age-specific mortality, and life expectancy, 1970-2016: a systematic analysis for the Global Burden of Disease Study 2016.Lancet. 2017 Sep 16;390(10100):1084-1150. doi: 10.1016/S0140-6736(17)31833-0. Lancet. 2017. PMID: 28919115 Free PMC article.
-
A novel ecological methodology for constructing ethnic-majority life tables in the absence of individual ethnicity information.J Epidemiol Community Health. 2015 Apr;69(4):361-7. doi: 10.1136/jech-2014-204210. Epub 2015 Jan 6. J Epidemiol Community Health. 2015. PMID: 25563743 Free PMC article.
-
Life expectancy inequalities in Wales before COVID-19: an exploration of current contributions by age and cause of death and changes between 2002 and 2018.Public Health. 2021 Apr;193:48-56. doi: 10.1016/j.puhe.2021.01.025. Epub 2021 Mar 15. Public Health. 2021. PMID: 33735693
-
[SENTIERI - Epidemiological Study of Residents in National Priority Contaminated Sites. Sixth Report].Epidemiol Prev. 2023 Jan-Apr;47(1-2 Suppl 1):1-286. doi: 10.19191/EP23.1-2-S1.003. Epidemiol Prev. 2023. PMID: 36825373 Italian.
-
Area deprivation measures used in Brazil: a scoping review.Rev Saude Publica. 2018 Sep 3;52:83. doi: 10.11606/S1518-8787.2018052000933. Rev Saude Publica. 2018. PMID: 30183845 Free PMC article.
Cited by
-
Social determinants of mortality from COVID-19: A simulation study using NHANES.PLoS Med. 2021 Jan 11;18(1):e1003490. doi: 10.1371/journal.pmed.1003490. eCollection 2021 Jan. PLoS Med. 2021. PMID: 33428624 Free PMC article.
-
Area-based social inequalities in adult mortality: construction of French deprivation-specific life tables for the period 2016-2018.Front Public Health. 2023 Dec 19;11:1310315. doi: 10.3389/fpubh.2023.1310315. eCollection 2023. Front Public Health. 2023. PMID: 38174081 Free PMC article.
-
A national population-based study of patients, bystanders and contextual factors associated with resuscitation in witnessed cardiac arrest: insight from the french RéAC registry.BMC Public Health. 2021 Dec 2;21(1):2202. doi: 10.1186/s12889-021-12269-4. BMC Public Health. 2021. PMID: 34856969 Free PMC article.
-
Use of mortality tables by level of deprivation in the study of social inequalities in cancer survival.Eur J Epidemiol. 2025 Feb;40(2):213-223. doi: 10.1007/s10654-024-01199-1. Epub 2025 Feb 6. Eur J Epidemiol. 2025. PMID: 39912859 Free PMC article.
-
Can an Ecological Index of Deprivation Be Used at the Country Level? The Case of the French Version of the European Deprivation Index (F-EDI).Int J Environ Res Public Health. 2022 Feb 17;19(4):2311. doi: 10.3390/ijerph19042311. Int J Environ Res Public Health. 2022. PMID: 35206501 Free PMC article.
References
-
- Mackenbach JP, Bakker MJ. Tackling socioeconomic inequalities in health: analysis of European experiences. Lancet. 2003;362(9393):1409–1414. - PubMed
MeSH terms
Grants and funding
LinkOut - more resources
Full Text Sources
