

I-Boost: an integrative boosting approach for predicting survival time with multiple genomics platforms
- PMID: 30845957
- PMCID: PMC6404283
- DOI: 10.1186/s13059-019-1640-4
I-Boost: an integrative boosting approach for predicting survival time with multiple genomics platforms
Abstract
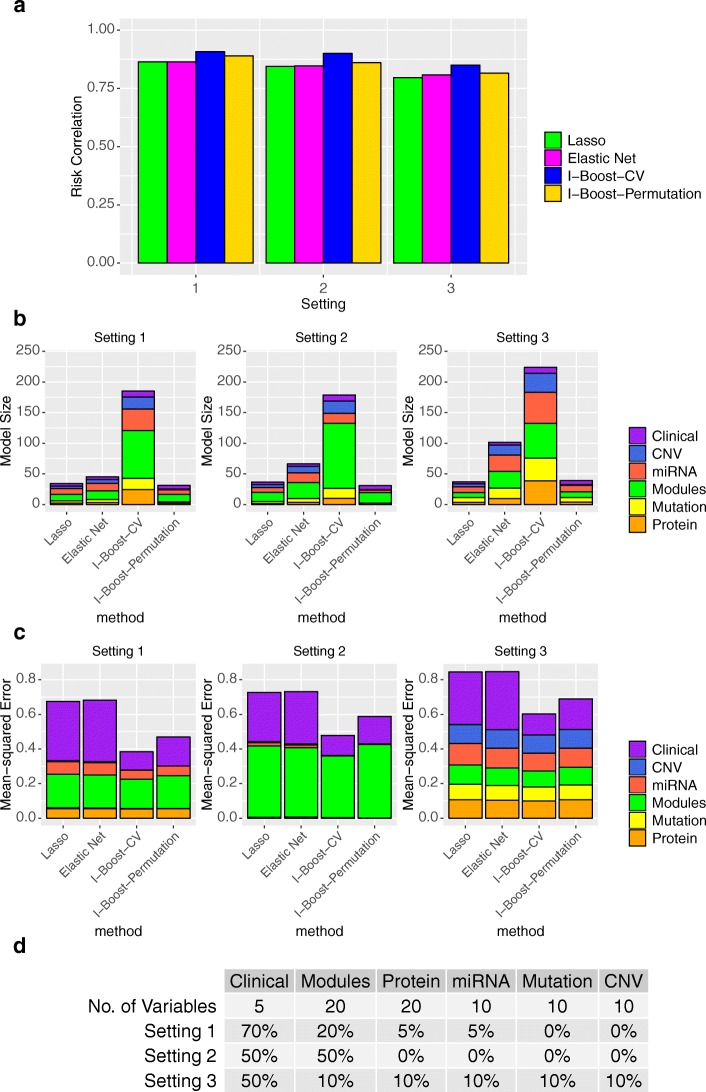
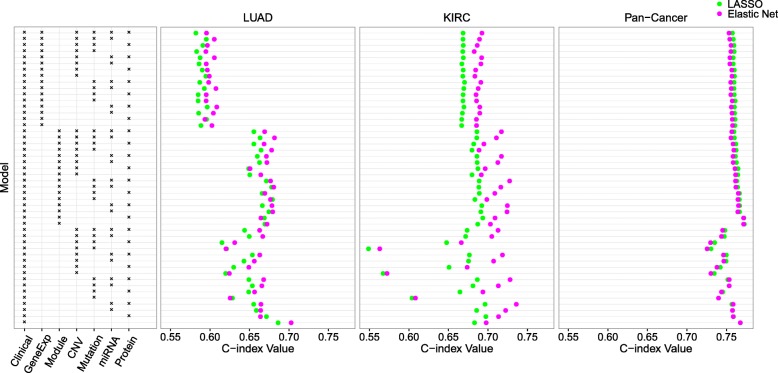
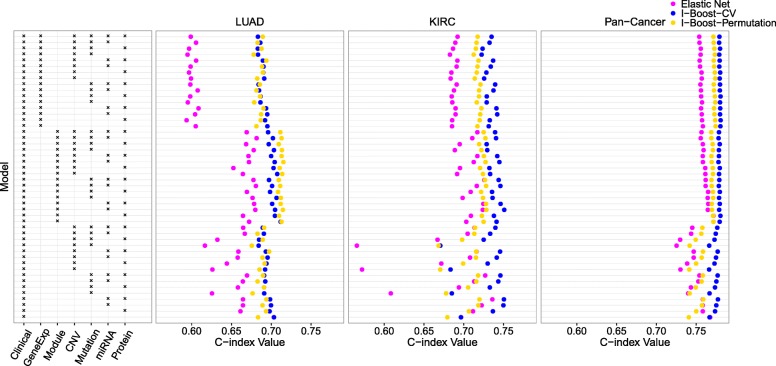
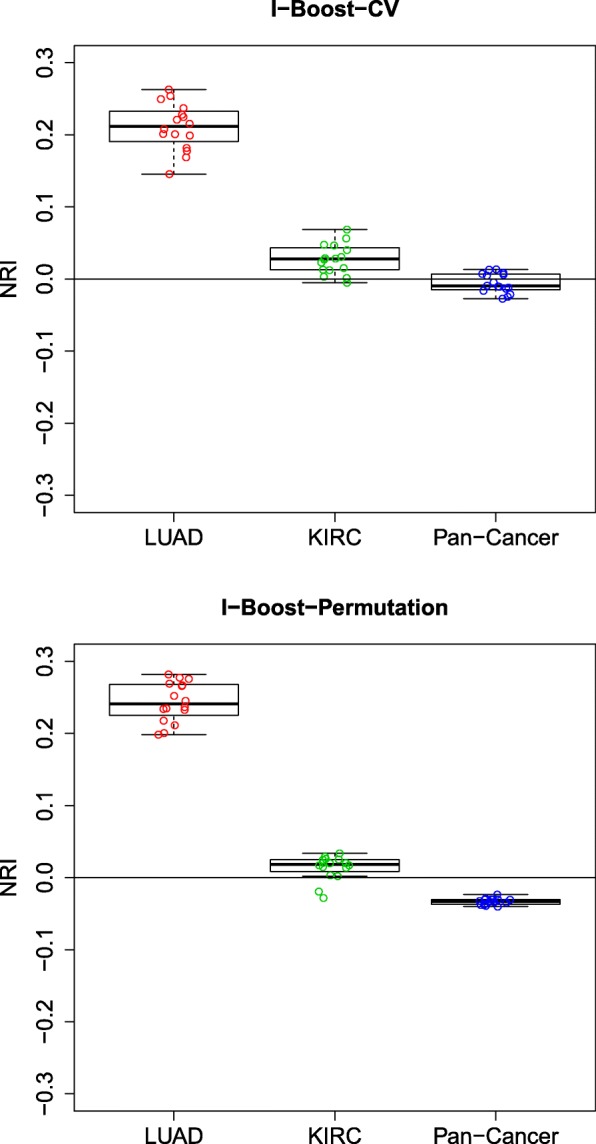
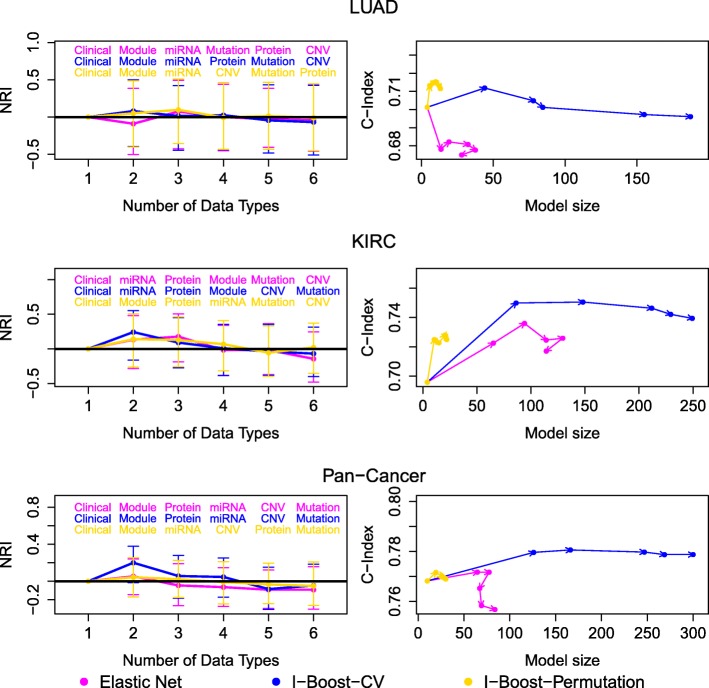
We propose a statistical boosting method, termed I-Boost, to integrate multiple types of high-dimensional genomics data with clinical data for predicting survival time. I-Boost provides substantially higher prediction accuracy than existing methods. By applying I-Boost to The Cancer Genome Atlas, we show that the integration of multiple genomics platforms with clinical variables improves the prediction of survival time over the use of clinical variables alone; gene expression values are typically more prognostic of survival time than other genomics data types; and gene modules/signatures are at least as prognostic as the collection of individual gene expression data.
Keywords: Cancer genomics; Data integration; Gene modules; Variable selection.
Conflict of interest statement
Ethics approval and consent to participate
Not applicable.
Consent for publication
Not applicable.
Competing interests
CMP is an equity stock holder, consultant, and Board of Director Member of BioClassifier LLC and GeneCentric Diagnostics. CMP is also listed as an inventor on patents on the Breast PAM50 and Lung Cancer Subtyping assays. The other authors declare that they have no competing interests.
Publisher’s Note
Springer Nature remains neutral with regard to jurisdictional claims in published maps and institutional affiliations.
Figures
Similar articles
-
canEvolve: a web portal for integrative oncogenomics.PLoS One. 2013;8(2):e56228. doi: 10.1371/journal.pone.0056228. Epub 2013 Feb 13. PLoS One. 2013. PMID: 23418540 Free PMC article.
-
Meta-analysis of Cancer Gene Profiling Data.Methods Mol Biol. 2016;1381:211-22. doi: 10.1007/978-1-4939-3204-7_12. Methods Mol Biol. 2016. PMID: 26667463
-
Integrated genomic analysis for prediction of survival for patients with liver cancer using The Cancer Genome Atlas.World J Gastroenterol. 2018 Jul 28;24(28):3145-3154. doi: 10.3748/wjg.v24.i28.3145. World J Gastroenterol. 2018. PMID: 30065560 Free PMC article.
-
Expression genomics in breast cancer research: microarrays at the crossroads of biology and medicine.Breast Cancer Res. 2007;9(2):206. doi: 10.1186/bcr1662. Breast Cancer Res. 2007. PMID: 17397520 Free PMC article. Review.
-
From description to causality: mechanisms of gene expression signatures in cancer.Cell Cycle. 2006 Jun;5(11):1148-51. doi: 10.4161/cc.5.11.2798. Epub 2006 Jun 1. Cell Cycle. 2006. PMID: 16721055 Review.
Cited by
-
A meta-learning approach for genomic survival analysis.Nat Commun. 2020 Dec 11;11(1):6350. doi: 10.1038/s41467-020-20167-3. Nat Commun. 2020. PMID: 33311484 Free PMC article.
-
CALGB 40603 (Alliance): Long-Term Outcomes and Genomic Correlates of Response and Survival After Neoadjuvant Chemotherapy With or Without Carboplatin and Bevacizumab in Triple-Negative Breast Cancer.J Clin Oncol. 2022 Apr 20;40(12):1323-1334. doi: 10.1200/JCO.21.01506. Epub 2022 Jan 19. J Clin Oncol. 2022. PMID: 35044810 Free PMC article. Clinical Trial.
-
A comprehensive review of cancer survival prediction using multi-omics integration and clinical variables.Brief Bioinform. 2025 Mar 4;26(2):bbaf150. doi: 10.1093/bib/bbaf150. Brief Bioinform. 2025. PMID: 40221959 Free PMC article. Review.
-
Elucidating the Influence of MPT-driven necrosis-linked LncRNAs on immunotherapy outcomes, sensitivity to chemotherapy, and mechanisms of cell death in clear cell renal carcinoma.Front Oncol. 2023 Dec 15;13:1276715. doi: 10.3389/fonc.2023.1276715. eCollection 2023. Front Oncol. 2023. PMID: 38162499 Free PMC article.
-
PENALIZED REGRESSION FOR MULTIPLE TYPES OF MANY FEATURES WITH MISSING DATA.Stat Sin. 2023 Apr;33(2):633-662. doi: 10.5705/ss.202020.0401. Stat Sin. 2023. PMID: 37197479 Free PMC article.
References
Publication types
MeSH terms
Grants and funding
LinkOut - more resources
Full Text Sources
