. 2019 Apr 4;74(1):45-58.e7.
doi: 10.1016/j.molcel.2019.01.037. Epub 2019 Mar 4.

CHP1 Regulates Compartmentalized Glycerolipid Synthesis by Activating GPAT4

Affiliations

CHP1 Regulates Compartmentalized Glycerolipid Synthesis by Activating GPAT4

Xiphias Ge Zhu et al. Mol Cell. .

Abstract

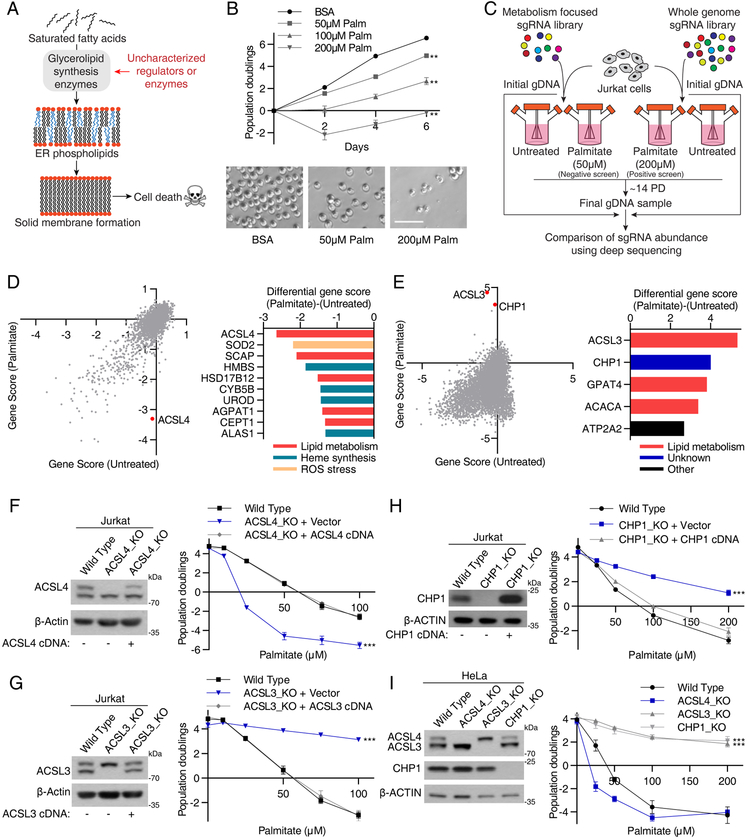
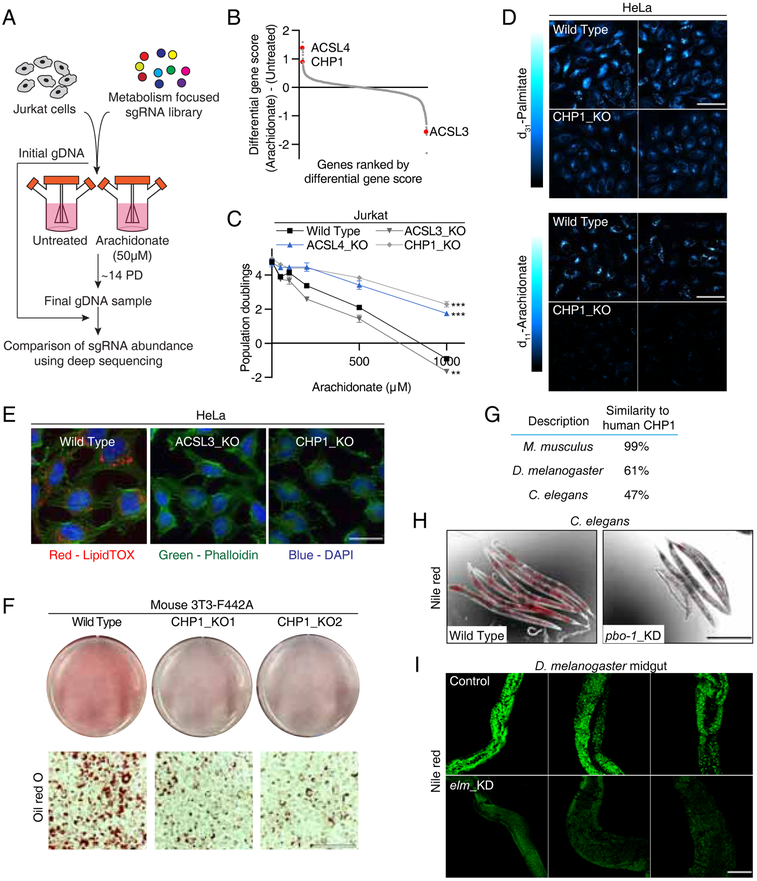
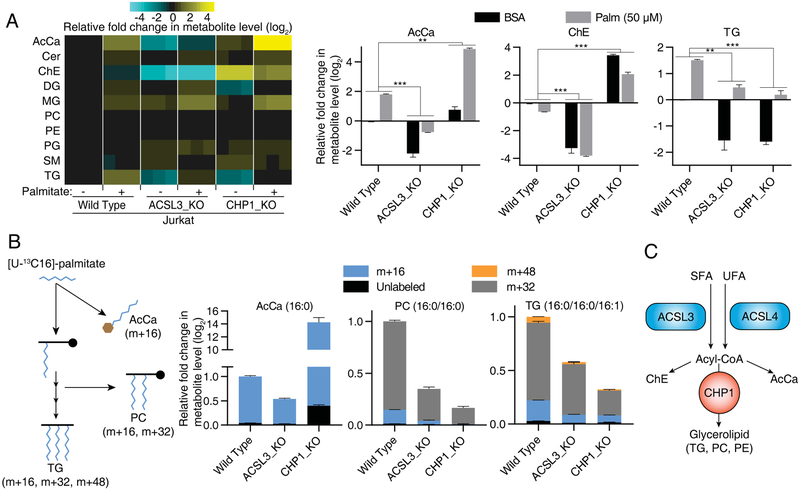
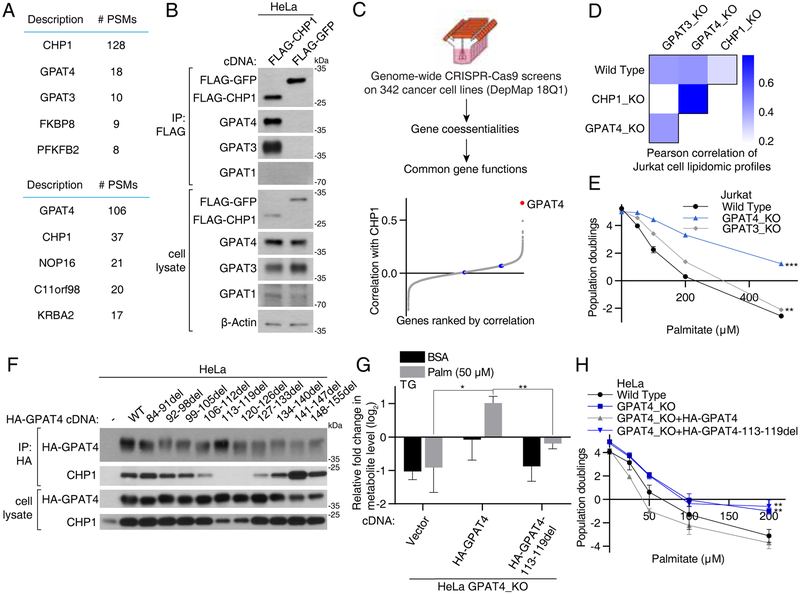
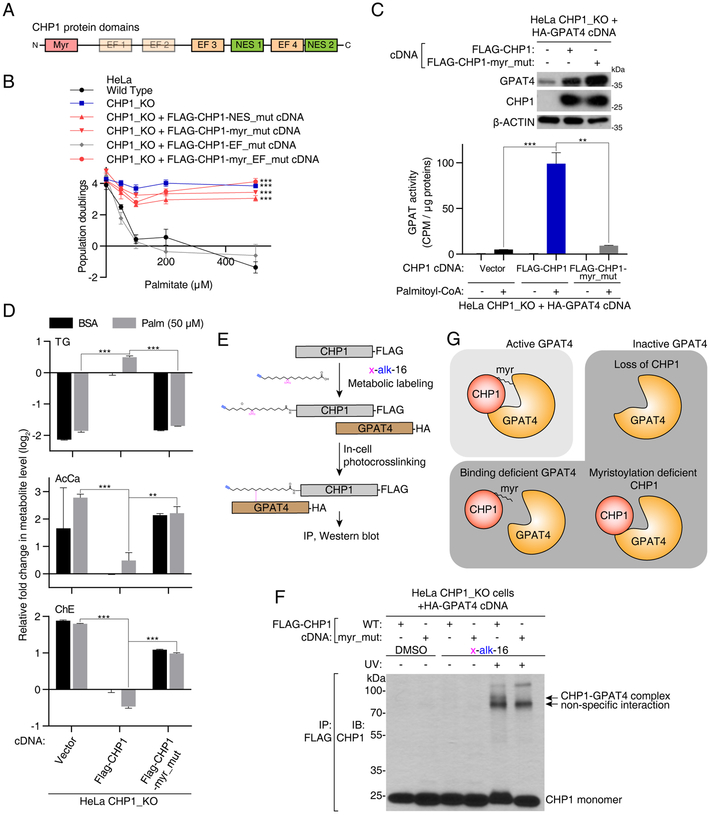
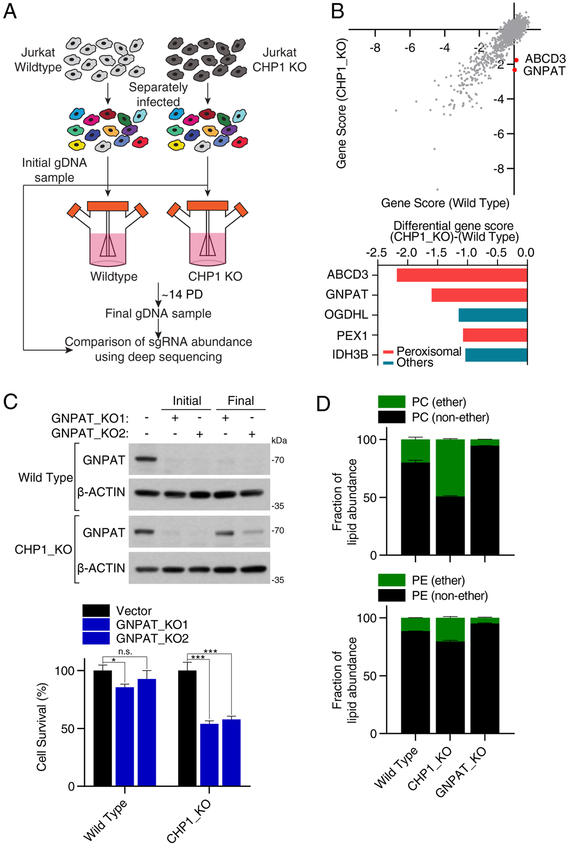
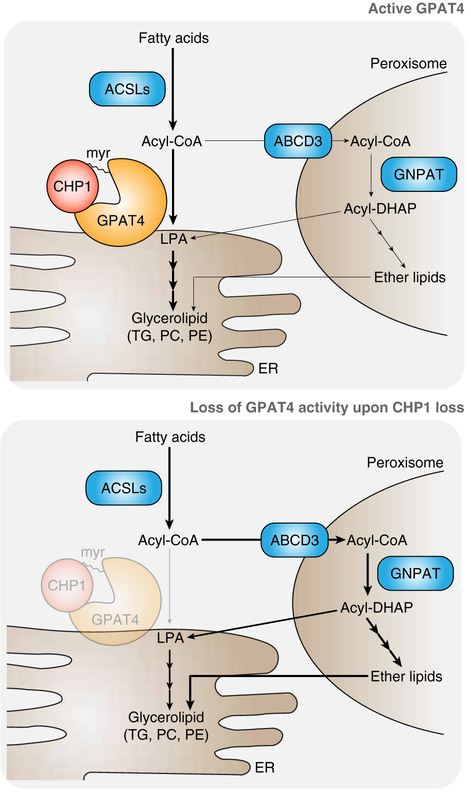
Cells require a constant supply of fatty acids to survive and proliferate. Fatty acids incorporate into membrane and storage glycerolipids through a series of endoplasmic reticulum (ER) enzymes, but how these enzymes are regulated is not well understood. Here, using a combination of CRISPR-based genetic screens and unbiased lipidomics, we identified calcineurin B homologous protein 1 (CHP1) as a major regulator of ER glycerolipid synthesis. Loss of CHP1 severely reduces fatty acid incorporation and storage in mammalian cells and invertebrates. Mechanistically, CHP1 binds and activates GPAT4, which catalyzes the initial rate-limiting step in glycerolipid synthesis. GPAT4 activity requires CHP1 to be N-myristoylated, forming a key molecular interface between the two proteins. Interestingly, upon CHP1 loss, the peroxisomal enzyme, GNPAT, partially compensates for the loss of ER lipid synthesis, enabling cell proliferation. Thus, our work identifies a conserved regulator of glycerolipid metabolism and reveals plasticity in lipid synthesis of proliferating cells.

Keywords: CHP1; CRISPR; GPAT4; cellular metabolism; fatty acids; genetic screens; glycerolipid synthesis; lipid metabolism; lipidomics; triacylglycerol accumulation.


Conflict of interest statement

Declaration of Interests

The authors declare no competing interests.

Figures

Figure 1:
Figure 1:. A CRISPR genetic screen identifies metabolic regulators of glycerolipid synthesis
(A) Approach to identify regulators of glycerolipid metabolism. Saturated fatty acids incorporate into ER phospholipids through glycerolipid synthesis pathway and ultimately result in cell death due to ER membrane solidification. (B) Dose-dependent effects of palmitate on Jurkat cell proliferation (mean ± SD, n=3). ***p < 0.001 versus BSA control (top). Representative bright-field micrographs of Jurkat cells after a 6-day treatment with the indicated palmitate concentrations. Scale bar, 100 μm (bottom). (C) Schematic depicting the negative and positive CRISPR based screens with palmitate. (D) Gene scores in untreated versus palmitate-treated (50 uM) Jurkat cells (left). Top 10 genes scoring as differentially required upon palmitate treatment. Genes linked to lipid metabolism are indicated in red, heme synthesis and desaturation in green, and ROS stress in yellow (right). (E) Gene scores in untreated versus palmitate-treated (200 uM) Jurkat cells. Top 5 genes scoring as differentially required upon palmitate treatment. Genes linked to lipid metabolism are indicated in red. The second gene in the list, CHP1 (blue), does not have metabolism related annotations (right). (F) Immunoblot analysis of wild type, ACSL4_KO, and rescued KO cells. β-actin was used as a loading control (left). Fold change in cell number (log2) of wild type (black), ACSL4_KO (blue), and rescued ACSL4_KO (gray) cells after a 4-day treatment with the indicated palmitate concentrations (mean ± SD, n=3). ***p < 0.001 versus wild type (right). (G) Immunoblot analysis of wild type, ACSL3_KO, and rescued KO cells. β-actin was used as a loading control (left). Fold change in cell number (log2) of wild type (black), ACSL3_KO (blue), and rescued ACSL3_KO (gray) cells after a 4-day treatment with the indicated palmitate concentrations (mean ± SD, n=3). ***p < 0.001 versus wild type (right). (H) Immunoblot analysis of wild type, CHP1_KO, and rescued KO cells. β-actin was used as a loading control (left). Fold change in cell number (log2) of wild type (black), CHP1_KO (blue), and rescued CHP1_KO (gray) cells after a 4-day treatment with the indicated palmitate concentrations (mean ± SD, n=3). ***p < 0.001 versus wild type (right). (I) Palmitate sensitivity of HeLa cells upon loss of indicated genes. Immunoblot analysis of wild type, ACSL4_KO, ACSL3_KO and CHP1_KO HeLa cells. β-actin was used as a loading control (left). Fold change in cell number (log2) of wild type (black), ACSL4_KO (blue), ACSL3_KO and CHP1_KO (gray) cells after a 4-day treatment with the indicated palmitate concentrations (mean ± SD, n=3). ***p < 0.001 versus wild type (right). See also Figure S1.
Figure 2.
Figure 2.. CHP1 is essential for glycerolipid synthesis and lipid storage in metazoa
(A) Schematic depicting the negative CRISPR based screen with arachidonate. (B) Ranked differential gene scores of arachidonate-treated (50 uM) Jurkat cells relative to untreated controls. Gene scores for ACSL4, CHP1 and ACSL3 are indicated in red. (C) Fold change in cell number (log2) of Jurkat wild type (black), ACSL4_KO (blue), ACSL3_KO and CHP1_KO (gray) cells after a 4-day treatment under the indicated arachidonate concentrations (mean ± SD, n=3). **p < 0.01, ***p < 0.001 versus wild type. (D) Representative Stimulated Raman scattering imaging of deuterium-labeled palmitate (top) and arachidonate (bottom) treated HeLa wild type and CHP1_KO cells. Intensity indicates the relative concentrations of labeled fatty acid metabolites. Scale bar, 80 μm. (E) Representative fluorescence images of lipid droplet content in HeLa wild type, ACSL3_KO and CHP1_KO cells treated with 1mM oleate. Stains for neutral lipid (red), nucleus (blue) and cytoskeleton (green) were used. Scale bar, 30 μm. (F) Oil red O staining of mouse 3T3-F442A adipocytes. Pre-adipocytes were infected with a control or CHP1 sgRNA plasmids. Cells were then differentiated with a standard hormone cocktail and stained with oil red O. Images of wells (top) and representative micrographs (bottom) were shown. Scale bar, 150 μm. (G) Protein sequence comparison of human CHP1 to its closest orthologue or paralogue in mouse, fruit fly and nematode. (H) C. elegans were fed with bacteria containing a control or knockdown plasmid of the CHP1 paralogue pbo-1. Worms were fixed in isopropanol and stained with Nile red. Nile red fluorescence signals (red) were merged with brightfield micrographs (n=5). Scale bar, 200 μm. (I) Representative images of Nile red fluorescence (green) in the anterior midguts of indicated flies were shown (n=3). CHP1 orthologue Drosophila elm was knocked-down by UAS-elm RNAi under Actin5C Gal4 driver. White RNAi served as control. Scale bar, 200 μm. See also Figure S2.
Figure 3.
Figure 3.. CHP1 regulates glycerolipid synthesis downstream of ACSLs
(A) Heatmap (left) and bar graphs (right) indicating the relative change in abundance (log2) of individual lipid species of Jurkat wild type, ACSL3_KO and CHP1_KO cells to untreated wild type controls. Cells were treated with control BSA or 50μM palmitate for 24 hrs prior to lipid extraction. (mean ± SD, n=3). **p < 0.01, ***p < 0.001. (B) Schematic depicting metabolic tracing of [U-13C]-palmitate incorporation (left). Relative abundance of the labeled lipid species of the indicated Jurkat cell lines. Values were normalized to the average of the untreated controls (mean ± SD, n=3) (right). (C) CHP1 functions downstream of ACSLs, as its loss causes an increase in cholesteryl esters and acylcarnitines, but a decrease in glycerolipids. See also Figure S3.
Figure 4.
Figure 4.. CHP1 interacts with ER GPATs and its interaction is essential for GPAT4 function
(A) Mass spectrometric analyses identified GPAT4 and GPAT3-derived peptides in immunoprecipitates prepared from HeLa cells expressing FLAG-tagged CHP1 (top). A reciprocal co-immunoprecipitation with HA-GPAT4 identified CHP1-derived peptides (bottom). Top 5 proteins in each experiment were shown. Peptide spectrum mass (PSM) indicates the total number of identified peptide spectra matched for the protein. (B) Recombinant FLAG-tagged CHP1 immunoprecipitates endogenous ER GPATs, GPAT4 and GPAT3. Anti-FLAG immunoprecipitates were prepared from HeLa cells expressing FLAG-CHP1 or FLAG-GFP. Cell lysates and immunoprecipiates were analyzed by immunoblotting for the indicated proteins. β-actin was used as a loading control. (C) Schematic depicting co-essentiality analysis using CRISPR screens in Meyers et al. (2017) (top). Correlations of gene essentialities of CHP1 with other genes were calculated and ranked. GPAT4 is indicated in red and other GPATs (GPAT1, GPAT2 and GPAT3) in blue (bottom). (D) Correlation of total lipid profiles of Jurkat wild type, CHP1_KO, GPAT4_KO and GPAT3_KO cells treated with control BSA or 50μM palmitate for 24 hrs prior to lipid extraction. Pearson correlation coefficients of the relative abundance of all lipid species among each cell line were compared. Changes in lipid profiles are shown in Figure S4D. (E) Fold change in cell number (log2) of Jurkat wild type (black), GPAT4_KO (blue) and GPAT3_KO (gray) cells after a 4-day treatment with the indicated palmitate concentrations (mean ± SD, n=3). **p < 0.01, ***p < 0.001 versus wild type. (F) Interaction of CHP1 with HA-tagged GPAT4 lacking regions between amino acids 84–156. Indicated deletions and full length HA-tagged GPAT4 cDNA were expressed in HeLa cells. Anti-HA immunoprecipitates were prepared from cell lysates and analyzed by immunoblotting for levels of indicated proteins. (G) Fold change (log2) in the abundance of triacylglycerols of HeLa GPAT4_KO cells expressing vector, HA-GPAT4 and HA-GPAT4-113-119del cDNA treated with 50μM palmitate for 24 hrs prior to lipid extraction. Values were normalized to the average of the untreated GPAT4_KO cells expressing HA-GPAT4 (mean ± SD, n=3). *p < 0.05, **p < 0.01. (I) Fold change in cell number (log2) of HeLa wild type (black), GPAT4_KO (blue), GPAT4_KO expressing HA-GPAT4 (gray) and HA-GPAT4-113-119del (blue) cells after a 4-day treatment with the indicated palmitate concentrations (mean ± SD, n=3). **p < 0.01 versus wild type. See also Figures S4 & S5.
Figure 5.
Figure 5.. CHP1 activates GPAT4 through its myristoyl moiety
(A) Schematic of functional protein domains of CHP1. (B) Identification of functionally relevant residues of CHP1 in glycerolipid metabolism. Fold change in cell number (log2) of HeLa wild type (black), CHP1_KO (blue), CHP1_KO expressing FLAG-CHP1-EF_mut (D123A/D125A/D127A/D164A/D166A/D168A) (gray), FLAG-CHP1-NES_mut (V138A/L139A/V179A/L180A), FLAG-CHP1-myr_mut (G2A/S6A) and FLAG-CHP1-myr_EF_mut (G2A/S6A/D123A/D125A/D127A/D164A/D166A/D168A) (red) cells after a 4-day treatment with the indicated palmitate concentrations (mean ± SD, n=3). ***p < 0.001 versus wild type. (C) GPAT activity assay of HeLa CHP1_KO cells expressing vector, FLAG-CHP1 and FLAG-CHP1-myr_mut cDNAs. All cell lines are additionally infected with an HA-GPAT4 virus. Immunoblotting analysis of the indicated proteins. β-actin was used as a loading control (top). Cell lysates were incubated with [14C]-glycerol-3-phosphate and with or without palmitoyl-CoA. GPAT activity was quantified as the CPM in the non-polar fraction (mean ± SD, n=3). **p < 0.01, ***p < 0.001 versus CHP1_KO expressing FLAG-CHP1 (bottom). (D) Fold change (log2) in indicated lipid groups of HeLa CHP1_KO cells expressing vector, FLAG-CHP1 and FLAG-CHP1-myr_mut cDNAs treated with 50μM palmitate for 24 hrs prior to lipid extraction. Lipid species of the same group were summed. Values were normalized to the average of the untreated CHP1_KO cells expressing FLAG-CHP1 cDNA (mean ± SD, n=3). **p < 0.01, ***p < 0.001 versus CHP1_KO expressing FLAG-CHP1 cDNA. (E) Schematic depicting steps to crosslink CHP1 and GPAT4 through a bifunctional fatty acyl group on the myristoylation site of CHP1. (F) Immunoblot using an antibody against CHP1 on immunoprecipitates with FLAG-CHP1 or FLAG-CHP1-myr_mut in the presence or absence of x-alk-16 photo-crosslinking. Crosslinked complex of CHP1-GPAT4 appeared as a higher band with a combined molecular weight of these two proteins (~80 kDa). (G) Schematic depicting active and inactive forms of GPAT4. Interaction of CHP1 with GPAT4 alone is necessary but not sufficient for GPAT4 activity. Full GPAT4 activity requires CHP1 to be myristoylated. See also Figure S6.
Figure 6.
Figure 6.. Upon CHP1 loss, cells depend on peroxisomal GNPAT to proliferate
(A) Schematic depicting the CRISPR based screens of wild type and CHP1_KO Jurkat cells using a metabolism focused sgRNA library. (B) Gene scores in wild type versus CHP1_KO Jurkat cells (top). Top 5 genes scoring as differentially required in the CHP1_KO cells. Genes linked to peroxisomes are indicated in red (bottom). (C) Immunoblot analysis of Jurkat wild type and CHP1_KO cells infected with control and GNPAT targeting sgRNAs. Lysates from the first and ninth day of culture were compared. β-actin was used as a loading control (top). Relative cell numbers of the indicated cell lines to vector controls (mean ± SD, n=3). *p < 0.05, ***p < 0.001 versus vector control (bottom). (D) Fraction of ether phosphatidylcholine (PC) and phosphatidylethanolamine (PE) species of wild type, GNPAT_KO and CHP1_KO Jurkat cells. Lipid species of the same group were summed (mean ± SD, n=3). See also Figure S7.
Figure 7.
Figure 7.. Loss of CHP1 rewires glycerolipid metabolism in proliferating cells
(A) Schematic depicting CHP1/GPAT4-catalyzed ER glycerolipid synthesis and the alternative peroxisomal pathway upon CHP1-GPAT4 loss. Under normal circumstances, CHP1 binds to and activates the major ER GPAT, (GPAT4), enabling the synthesis of membrane lipids and triacylglycerols at the endoplasmic reticulum. Upon CHP1 loss, peroxisomal GNPAT compensates for the loss of ER glycerolipid synthesis by generating acyl-DHAP, which in turn generates lysophosphatidic acid and glycerolipids.

References

    1. Agarwal AK, Sukumaran S, Cortés VA, Tunison K, Mizrachi D, Sankella S, Gerard RD, Horton JD, and Garg A (2011). Human 1-acylglycerol-3-phosphate O-acyltransferase isoforms 1 and 2: biochemical characterization and inability to rescue hepatic steatosis in Agpat2(−/−) gene lipodystrophic mice. J. Biol. Chem 286, 37676–37691. - PMC - PubMed
    1. Alwarawrah Y, Hughes P, Loiselle D, Carlson DA, Darr DB, Jordan JL, Xiong J, Hunter LM, Dubois LG, Thompson JW, et al. (2016). Fasnall, a selective FASN inhibitor, shows potent anti-tumor activity in the MMTV-Neu model of HER2(+) breast cancer. Cell Chem. Biol 23, 678–688. - PMC - PubMed
    1. Bell RM, and Coleman RA (1980). Enzymes of glycerolipid synthesis in eukaryotes. Annu. Rev. Biochem 49, 459–487. - PubMed
    1. Bird SS, Marur VR, Sniatynski MJ, Greenberg HK, and Kristal BS (2011). Serum lipidomics profiling using LC-MS and high-energy collisional dissociation fragmentation: focus on triglyceride detection and characterization. Anal. Chem 83, 6648–6657. - PMC - PubMed
    1. Birsoy K, Possemato R, Lorbeer FK, Bayraktar EC, Thiru P, Yucel B, Wang T, Chen WW, Clish CB, and Sabatini DM (2014). Metabolic determinants of cancer cell sensitivity to glucose limitation and biguanides. Nature 508, 108–112. - PMC - PubMed

Publication types

MeSH terms