. 2019 Apr 4;74(1):32-44.e8.
doi: 10.1016/j.molcel.2019.01.036. Epub 2019 Mar 4.

Probing the Global Cellular Responses to Lipotoxicity Caused by Saturated Fatty Acids

Affiliations

Probing the Global Cellular Responses to Lipotoxicity Caused by Saturated Fatty Acids

Manuele Piccolis et al. Mol Cell. .

Abstract

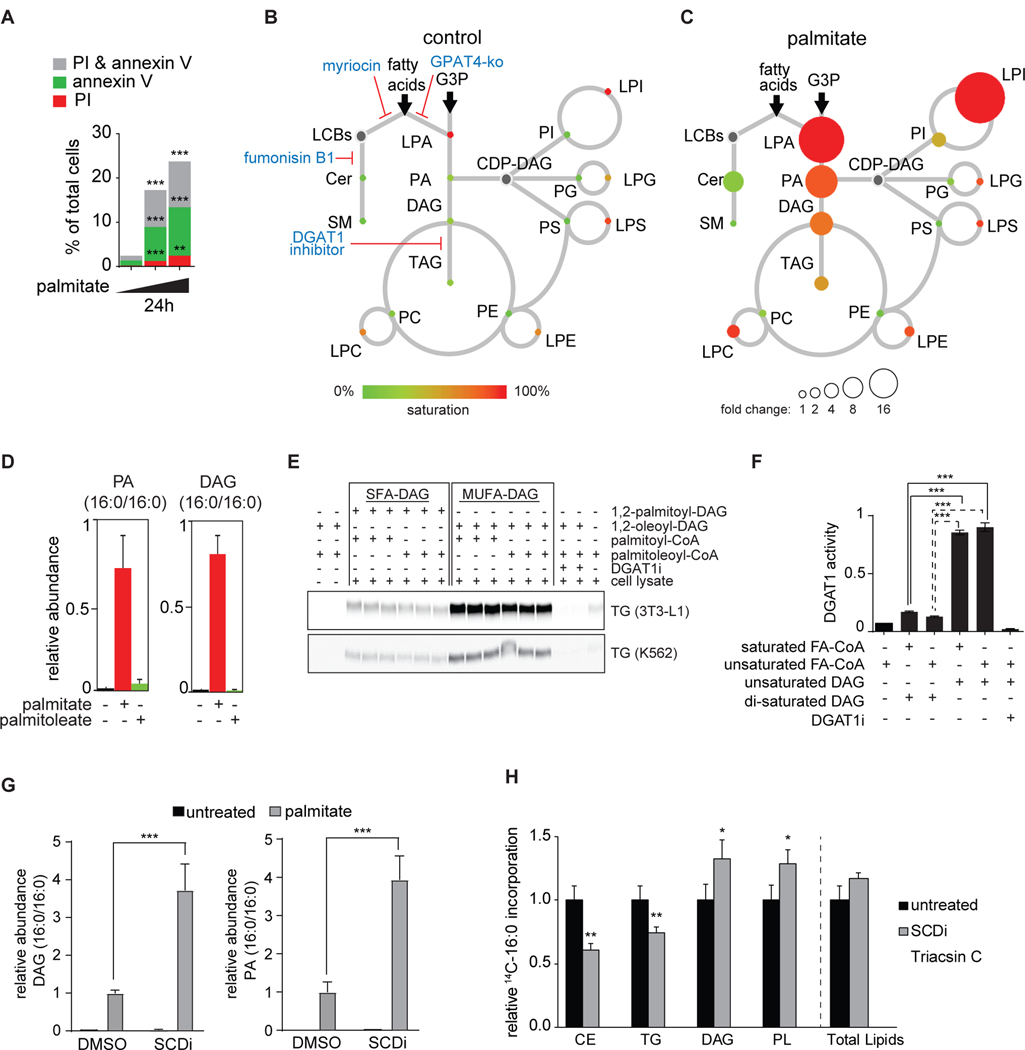
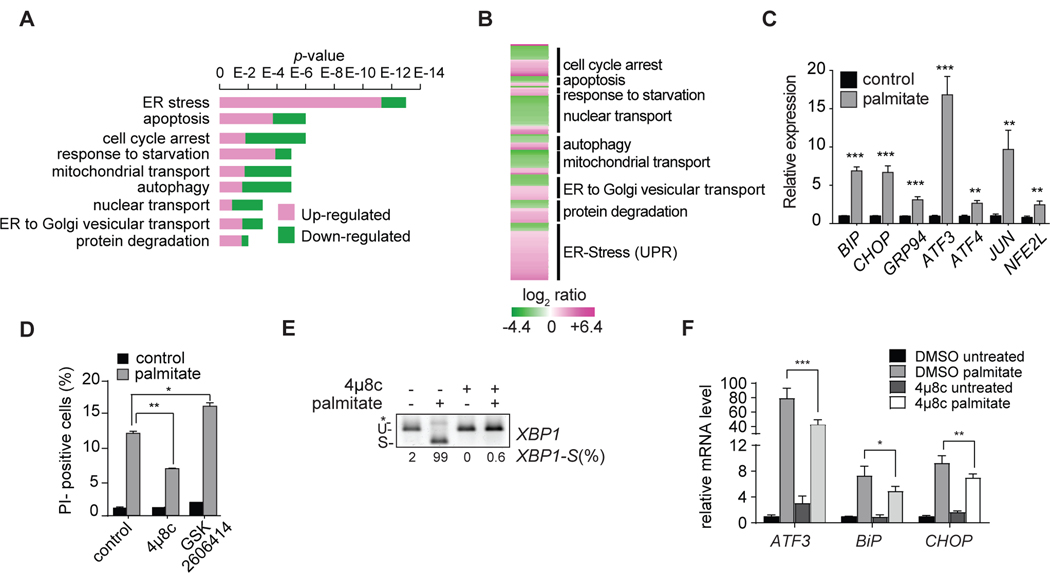
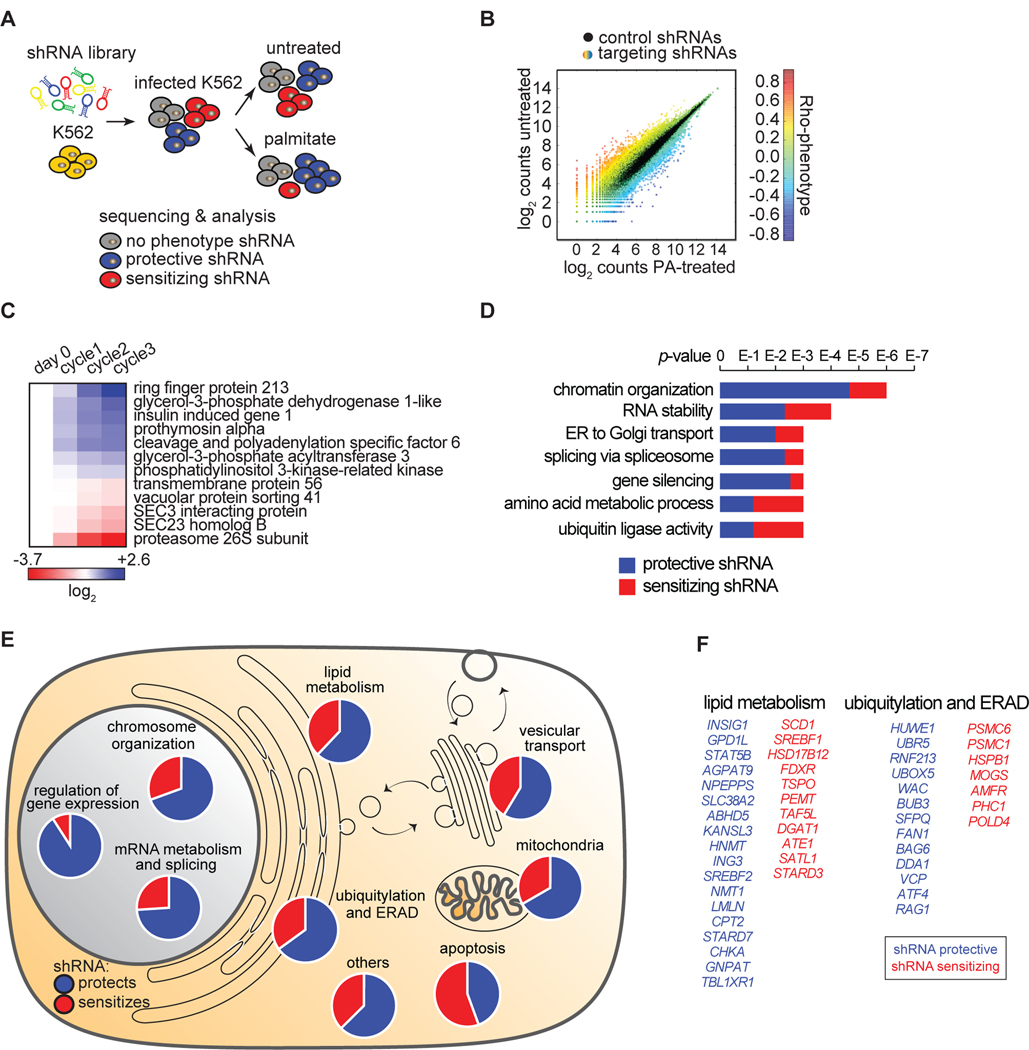
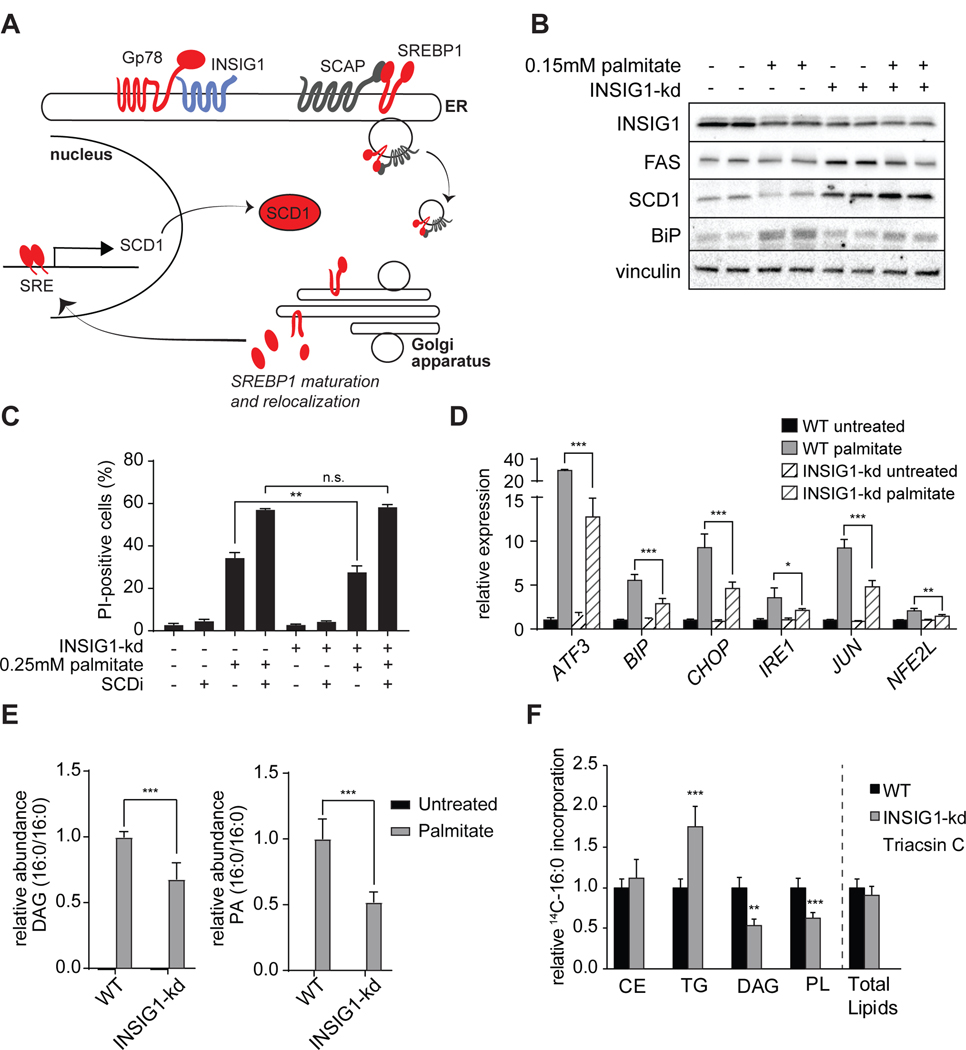
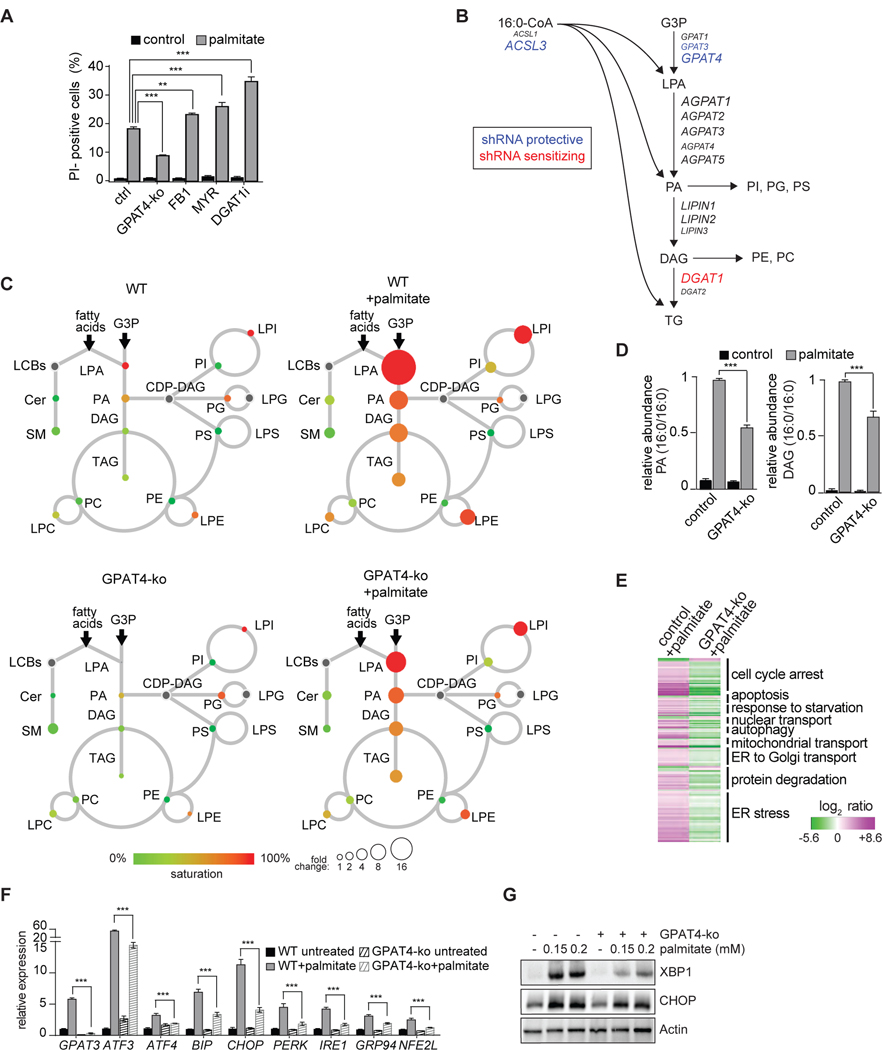
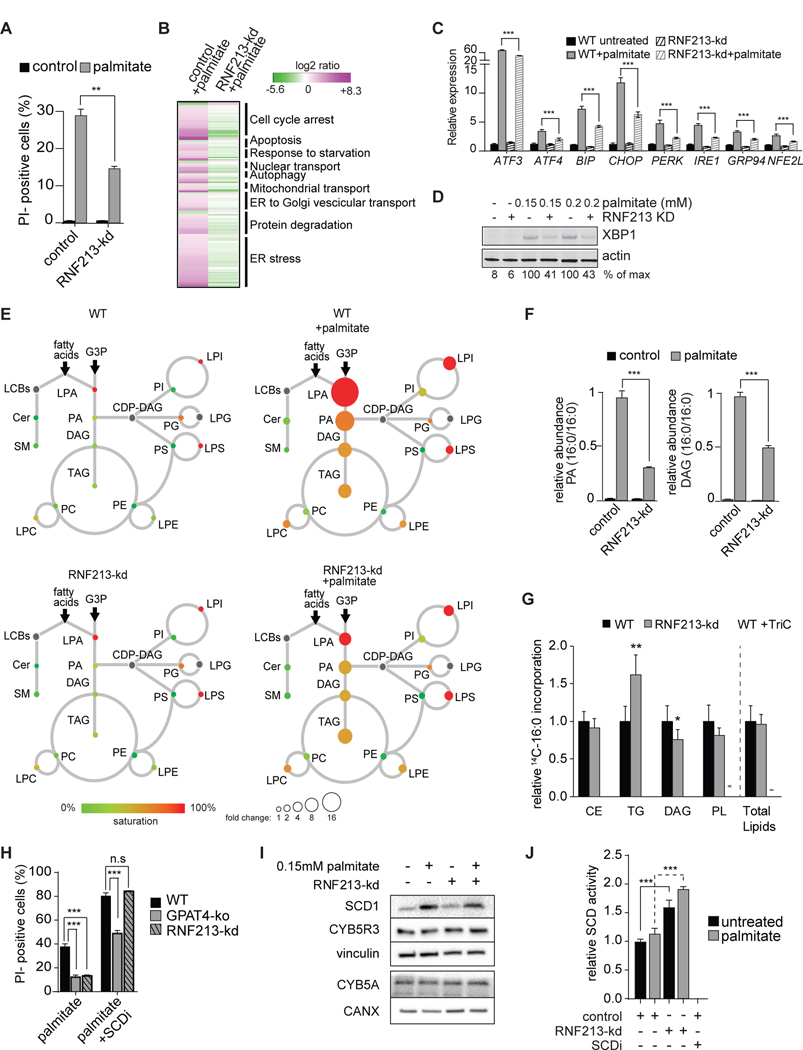
Excessive levels of saturated fatty acids are toxic to cells, although the basis for this lipotoxicity remains incompletely understood. Here, we analyzed the transcriptome, lipidome, and genetic interactions of human leukemia cells exposed to palmitate. Palmitate treatment increased saturated glycerolipids, accompanied by a transcriptional stress response, including upregulation of the endoplasmic reticulum (ER) stress response. A comprehensive genome-wide short hairpin RNA (shRNA) screen identified >350 genes modulating lipotoxicity. Among previously unknown genetic modifiers of lipotoxicity, depletion of RNF213, a putative ubiquitin ligase mutated in Moyamoya vascular disease, protected cells from lipotoxicity. On a broader level, integration of our comprehensive datasets revealed that changes in di-saturated glycerolipids, but not other lipid classes, are central to lipotoxicity in this model. Consistent with this, inhibition of ER-localized glycerol-3-phosphate acyltransferase activity protected from all aspects of lipotoxicity. Identification of genes modulating the response to saturated fatty acids may reveal novel therapeutic strategies for treating metabolic diseases linked to lipotoxicity.

Keywords: Moyamoya disease; glycerolipid; lipotoxicity; palmitate; saturated fatty acid.


Conflict of interest statement

DECLARATION OF INTERESTS

J.W.H. is a consultant and founder of Rheostat Therapeutics and a consultant for X-Chem Inc.

Figures

Figure 1.
Figure 1.. Lipidome of Palmitate-Induced Lipotoxicity in Human K562 Leukemia cells.
(A) Palmitate induces apoptotic cell death in K562 cells. Cell viability assay of K562 cells treated with increasing concentration of palmitate (0, 0.2 and 0.25 mM) for 24 h. Apoptotic cells were identified by propidium iodide (PI) and annexin V staining. n=3 for each treatment. **p < 0.01; ***p < 0.001. (B) Lipidome of K562 cells in basal conditions. The scheme shows the relative levels of incorporation of exogenous fatty acids into sphingolipids and glycerophospholipids. Lipid classes identified by LC-MS2 analysis are presented as color-coded circles. The lipid species was designated as saturated if all of its fatty acid chains were saturated, or unsaturated if it had at least one unsaturated fatty acid chain. The percentage of saturated lipid species is shown for each class from green (low saturation) to red (high saturation). Lipid classes not identified are shown in grey. The size of the circles is set to the arbitrary unit of 1 for the control cells. G3P: glycerol-3-phosphate; LPA: lyso-phosphatidic acids; PA: phosphatidic acids; DAG: diacylglycerol; TAG: triacylglycerol; PC: phosphatidylcholine: PE: phosphatidylethanolamine; LPE: lyso-phosphatidylethanolamine; LPC: lyso-phosphatidylcholine; PS: phosphatidylserine; LPS: lyso-phosphatidylserine; PI: phosphatidylinositol; LPI: lyso-phosphatidylinositol; PG: phosphatidylglycerol; LPG: lyso-phosphatidylglycerol; Cer: ceramide; SM: sphingomyelin; LCB: long-chain base; CDP: cytidine diphosphate. (C) As in Figure 1B, the lipidome of K562 cells treated with 0.2 mM palmitate for 20 h. The size of the circle is proportional to the change in abundance relative to the control sample. The complete dataset is provided in Table 1 “Lipidomics data”. (D) Palmitate, but not palmitoleate, increases the number of di-saturated lipid species. Relative quantification for phosphatidic acid (PA, left panel) and diacylglycerol (DAG, right panel) identified by LC-MS2. K562 cells treated with control, 0.2 mM palmitate or 0.2 palmitoleate for 20 h. Lipid species changing the most upon palmitate treatment is shown for each class. n=3 for each treatment. (E) Di-saturated diacylglycerol does not sustain DGAT1 activity in vitro. DGAT1 enzymatic activities were measured at Vmax in total cell lysate from differentiated 3T3-l1 adipocytes (upper panel) and K562 cells (lower panel). Each reaction contained 1,2-dioleoyl-glycerol or 1,2-dipalmitoyl-glycerol as diacyl-glycerol source. The DGAT1 inhibitor (15uM) was included as a control. (F) Quantification of the TLC plates shown in E. n=3 for each treatment; ***p < 0.001. (G) SCD inhibition (4uM) increases the accumulation of di-saturated PA and DAG compared to DMSO control cells. Relative quantification for phosphatidic acid (PA, left panel) and diacylglycerol (DAG, right panel) identified by LC-MS2. K562 cells treated with control or 0.2 mM palmitate. n=4 for each treatment. ***p < 0.001. (H) Decreased partitioning of 14C-palmitate towards TG and CE. Cells were treated for 6 h with 0.2 mM nonradiolabeled palmitate and 0.15uCi 14C-palmitate. Triacsin C (10uM, an inhibitor of ACSL1, ACSL3 and ACSL4) was added to confirm ACSL-specific fatty acid uptake. Untreated and triascin C values are also shown in Figure 4F. n=5–6 for each treatment. *p < 0.05; **p < 0.01. See also Figures S1.
Figure 2.
Figure 2.. The Transcriptome of Palmitate-Induced Lipotoxicity in Human K562 Leukemia Cells.
(A) RNAseq analysis of genes expressed in K562 cells in response to palmitate versus control. The figure shows the p-values corresponding to the categories of genes shown in Figure 2B. Genes upregulated by palmitate are shown in magenta, and genes downregulated by palmitate are shown in green (p < 0.005). GO term enrichment has been performed using ClueGo in Cytoscape. (B) RNAseq analysis of genes expressed in K562 cells in response to palmitate. Indicated are gene-expression categories as revealed by ClueGO analysis. Genes upregulated by palmitate are shown in magenta, and genes downregulated by palmitate are shown in green (p < 0.005). The complete dataset is provided in Table S2 “Gene expression profile data”. (C) Increased activation of UPR target genes in K562 cells in response to palmitate. Relative mRNA quantification for main UPR target genes in basal (control) and treated (0.2 mM palmitate) cells. n=3 for each treatment. **p < 0.01; ***p < 0.001. (D) Block of the IRE1 branch of the UPR protects K562 cells from palmitate-induced cell death. Propidium-iodide staining of K562 cells untreated or treated with 0.2 mM palmitate for 20 h. Cells were incubated with control vehicle or the IRE1 inhibitor 4μ8c (32 μM) or a PERK inhibitor GSK2606414 (15 nM) for 2 h before the incubation. n=3 for each treatment. *p < 0.05; **p < 0.01. (E) Treatment with IRE1 inhibitor, 4μ8c, blocks palmitate-induced cleavage of XBP1 mRNA. U, unspliced; S, spliced; * unspecific band. XBP1 splicing is quantified as percentage of the spliced form over the total detected (XBP1-S(%)). (F) IRE1 inhibition with 4μ8c mitigates induction of ER stress markers after palmitate treatment. n=3 for each treatment. *p < 0.05; **p < 0.01, ***p < 0.001; See also Figures S2.
Figure 3.
Figure 3.. Identification of Genes that Modify Lipotoxicity in K562 Human Leukemia Cells.
(A) Schematic of shRNA screen. K562 cells were infected with a complex lentiviral shRNA library (25 shRNAs/gene) as described in Methods. Cells were split into treated (0.2 mM palmitate) and untreated (control) samples. Upon five cycles of palmitate treatments, shRNAs were amplified by PCR and sequenced. Expected outcome: cells enriched in palmitate-treated sample (infected by protective shRNAs) are shown in blue, cells de-enriched in palmitate-treated sample (infected by sensitizing shRNAs) are shown in red, and cells equally present in treated and untreated samples (infected by shRNAs having no phenotype) are shown in grey. (B) The screen output is shown. The absolute count for each shRNA from sequencing is shown as a dot. Each dot is the average among the biological replicate screens. Black dots are control shRNAs. Color-coded dots are targeting shRNA. The color varies according to the different phenotype. (C) Screen candidates are confirmed by independent validation. The three shRNA-targeting sequences having the strongest phenotypes in the screen were cloned individually and then used to generate a stable knock-down for each of the 12 genes in the figure. To validate each candidate, we performed a growth competition assay between the knock-down cells (m-Cherry positive) and control cells (m-Cherry negative). The color code shows the enrichments in blue (for protective shRNAs) and de-enrichments in red (for sensitizing shRNAs) of knock-down cells compared to control cells upon three consecutive cycles of palmitate treatment. Flow cytometry was used to quantify each knockdown population. The variation, quantified after each individual palmitate treatment (cycle) compared to controls (day 0), is expressed as log2. (D) Annotation of overrepresented terms identified among the screen candidates. Candidates are designated as genes that sensitize (red) or protect (blue) cells from palmitate-induced cell death. The analysis was performed using ClueGO in Cytoscape. (E) Overview of screen results. The 355 genes targeted by the 234 protective shRNAs (in blue) and 121 sensitizing shRNAs (in red) are shown grouped by categories. Information on these genes is also presented in Table S3 “Screen result table”. (F) Of the 355 genes identified, 29 genes were involved in lipid metabolism and 20 were involved in ubiquitylation and ERAD. See also Figures S3.
Figure 4.
Figure 4.. SREBP-Related Pathway Regulates Fatty Acid Desaturase and Palmitate-Induced Lipotoxicity.
(A) Schematic representation of the SREBP pathway in which GP78 degrades INSIG1 to free the SCAP-SREBP1 complex for trafficking from the ER to the Golgi apparatus, where cleavage liberates the SREBP1 transcription factor fragment from the membrane. This, in turn, leads to induction of target genes that have a sterol-response element (SRE) sequence in their promoter, such as SCD1. Aggravating hits are shown in red, protective hits are shown in blue. (B) INSIG1 knockdown elevates FAS and SCD1 and reduces palmitate-induced upregulation of BIP. Western blot of WT and INSIG1-kd cells under basal condition or after palmitate treatment (0.15 mM, 20 h). (C) INSIG1 knockdown modestly protects cells from palmitate-induced cell death, as measured by PI staining, and this protection is lost with SCD inhibition (4 μM). **p < 0.001. (D) Unfolded protein response gene expression levels of WT and INSIG1-kd cells. (E) Relative quantification for phosphatidic acid (PA, left panel) and diacylglycerol (DAG, right panel) in INISIG1-kd cells compared to WT cells before after after palmitate treatment, as identified by LC-MS2. K562 cells untreated or treated with 0.2 mM palmitate. n=3–4 for each treatment. ***p < 0.001. (F) INSIG1-kd cells exhibit increased incorporation of radiolabeled palmitate into TG. Cells were treated for 6 h with 0.2 mM nonradiolabeled palmitate and 0.15μCi 14C-palmitate. Triacsin C (10uM, an inhibitor of ACSL1, ACSL3 and ACSL4) was added confirm ACSL-specific fatty acid uptake. Untreated and triacsin C values are also shown in Figure 1H. n=3 for each treatment. **p < 0.01; ***p < 0.001. See also Figures S4.
Figure 5.
Figure 5.. Glycerolipid Synthesis-Related Pathway Is a Major Modifier of Palmitate-Induced Lipotoxicity.
(A) Blocking sphingolipid or triacylglycerol synthesis does not protect K562 cells against palmitate-induced cell death. Propidium-iodide staining of K562 cells were treated with fumonisin B (10 μM), myriocin (25 μM) or DGAT1 inhibitor (25 μM), and untreated or treated with 0.2 mM palmitate for 20 h. n=3 for each treatment. **p < 0.01; ***p < 0.001. (B) Schematic representation of glycerolipid pathway. GPAT catalyzes the esterification of glycerol-3-phosphate and fatty acyl CoA to yield lysophosphatidic acid, which is further esterified by AGPAT to yield phosphatidic acid. In the next step the phosphate is hydrolyzed by lipin enzymes, yielding diacylglycerol (DAG). This can be used for the synthesis of glycerophospholipids, such as PC or PE, or for production of triacylglycerol by DGAT enzymes. Font size of proteins correlates to relative abundance (based on RNAseq data). (C) Lipidome of control (top) and GPAT4-ko (bottom) K562 cells untreated (left) or treated (right) with palmitate (0.2 mM) for 20 h, as described in Figure 1B. The size of the circles is proportional to the fold-change, compared to untreated control cells. The complete dataset is provided in Table 1 “Lipidomics data”. (D) Blocking glycerolipid synthesis by GPAT4 knockout reduces the palmitate-induced accumulation of di-saturated lipid species. Relative quantification for phosphatidic acid (PA, left panel) and DAG (right panel) identified by LC-MS2. Wild-type or GPAT4-ko K562 cells untreated or treated with 0.2 mM palmitate for 20 h. n=3 for each treatment. ***p < 0.001. (E) Blocking glycerolipid synthesis protects against palmitate-induced activation of the UPR. Left lane, RNAseq data of wild-type K562 cells treated with 0.2 mM palmitate for 20 h. Genes (p < 0.005) are shown as log2 ratio of palmitate compared to the control and designated as upregulated (magenta) and downregulated (green). Right lane, RNAseq data of GPAT4-ko K562 cells treated with 0.2 mM palmitate for 20 h. Genes are shown as log2 ratio, compared to the wild-type treated with palmitate. The annotation was performed using ClueGO in Cytoscape. The complete dataset is provided in Table S2 “Gene expression profile data”. (F) Blocking glycerophospholipid synthesis prevents palmitate-induced UPR target genes. Relative expression of main UPR target genes performed by qPCR. n=3 for each treatment; ***p < 0.001. (G) Block of glycerophospholipid synthesis prevents transcription of XBP1. Western blot of total cell lysate from control and GPAT4-ko cells untreated or treated for 16 h with 0.2 mM palmitate. See also Figures S5.
Figure 6.
Figure 6.. Depletion of the Putative E3 Ligase RNF213 Protects against Palmitate-Induced Lipotoxicity.
(A) Knockdown of RNF213 prevents palmitate-induced cell death. Propidium-iodide staining of control or RNF213-kd cells untreated or treated with 0.2 mM palmitate for 24 h. n=3 for each treatment. **p < 0.01. (B) Knockdown of RNF213 protects against palmitate-induced activation of the UPR. Left lane, RNAseq data of wild-type K562 cells treated with 0.2 mM palmitate for 20 h. Genes (p<0.005) are shown as log2 ratio of palmitate compared to the control and designated as being upregulated (magenta) or downregulated (green). Right lane, RNAseq data of RNF213-ko K562 cells treated with 0.2 mM palmitate for 20 h. Genes are shown as log2 ratio compared to the control treated with palmitate. The complete dataset is provided in Table S2 “Gene expression profile data”. (C) Knock-down of RNF213 prevents palmitate induction of UPR target genes. Relative expression of main UPR target genes performed by qPCR. n=3 for each treatment, ***p < 0.001. (D) RNF213-kd protects cells against palmitate-induced UPR. Western blot of total cell lysate from control and RNF213-kd cells treated with vehicle or palmitate (0.15 or 0.2 mM) for 16 h. XBP1 protein is quantified as percentage over the max signal (100%) detected among all conditions. (E) Lipidome of control K562 cells treated with palmitate (0.2 mM) for 20 h, as described in Figure 1B. The size of the circles is proportional to the fold-change, compared to untreated control cells. Lyso-phosphatidic acid (LPA) circle size was reduced 16-fold for visualization purposes. The complete dataset is provided in Table 1 “Lipidomics data”. (F) Knockdown of RNF213 reduces accumulation of palmitate-induced di-saturated lipid species. Relative quantification for phosphatidic acid (PA, left panel) and diacylglycerol (DAG, right panel) identified by LC-MS2. Control or RNF213-kd K562 cells untreated or treated with 0.2 mM palmitate for 24 h. The lipid species changing the most upon palmitate treatment is shown for each class. n=3 for each treatment. ***p < 0.001. (G) RNF213-kd cells exhibited unaltered total lipid synthesis but increased TG accumulation. Cells were treated for 6 h with 0.2 mM nonradiolabeled palmitate and 0.15uCi 14C-palmitate. Triacsin C (10uM, an inhibitor of ACSL1, ACSL3 and ACSL4) was added to confirm ACSL-specific fatty acid uptake. n=6 for each treatment. *p < 0.05, **p < 0.01. (H) Inhibition of SCD1 exacerbates palmitate-induced cell death, an effect that is suppressed by GPAT inhibition but not by RNF213 knockdown. Propidium-iodide staining of GPAT4-ko or RNF213-kd cells treated with 0.2 mM palmitate for 20 h with or without SCD inhibitor (4 μM). n=3 for each treatment. ***p < 0.001; n.s., non-significant. (I) SCD1 and cytochrome B5 reductase (CYB5R3) protein levels are not increased by RNF213 knockdown. Western blotting of total cell lysates from control and RNF213-kd cells untreated or treated for 16 h with 0.15 mM palmitate. J) SCD activity is elevated in RNF213-kd cells compared to wildtype cells. In vitro Δ9 desaturase activity was determined in microsomes collected from WT and RNF213-kd cells untreated or treated with 0.15mM palmitate for 16 h and was measured as release of 3H from [9, 10-3H]-stearoyl-CoA. SCD inhibitor (4 μM) was included as a control. n=3 for each treatment. ***p < 0.001. See also Figures S6.

References

    1. Agarwal AK, Sukumaran S, Cortes VA, Tunison K, Mizrachi D, Sankella S, Gerard RD, Horton JD, and Garg A. (2011). Human 1-acylglycerol-3-phosphate O-acyltransferase isoforms 1 and 2: biochemical characterization and inability to rescue hepatic steatosis in Agpat2(−/−) gene lipodystrophic mice. J Biol Chem 286, 37676–37691. - PMC - PubMed
    1. Banh RS, Iorio C, Marcotte R, Xu Y, Cojocari D, Rahman AA, Pawling J, Zhang W, Sinha A, Rose CM, et al. (2016). PTP1B controls non-mitochondrial oxygen consumption by regulating RNF213 to promote tumour survival during hypoxia. Nature cell biology 18, 803–813. - PMC - PubMed
    1. Bassik MC, Kampmann M, Lebbink RJ, Wang S, Hein MY, Poser I, Weibezahn J, Horlbeck MA, Chen S, Mann M, et al. (2013). A systematic mammalian genetic interaction map reveals pathways underlying ricin susceptibility. Cell 152, 909–922. - PMC - PubMed
    1. Beausoleil SA, Villen J, Gerber SA, Rush J, and Gygi SP (2006). A probability-based approach for high-throughput protein phosphorylation analysis and site localization. Nat Biotechnol 24, 1285–1292. - PubMed
    1. Borradaile NM, Han X, Harp JD, Gale SE, Ory DS, and Schaffer JE (2006). Disruption of endoplasmic reticulum structure and integrity in lipotoxic cell death. J Lipid Res 47, 2726–2737. - PubMed

Publication types

MeSH terms

LinkOut - more resources