. 2019 Mar 27;146(12):dev173807.
doi: 10.1242/dev.173807.

Single cell transcriptomics reveals spatial and temporal dynamics of gene expression in the developing mouse spinal cord

Affiliations

Single cell transcriptomics reveals spatial and temporal dynamics of gene expression in the developing mouse spinal cord

Julien Delile et al. Development. .

Abstract

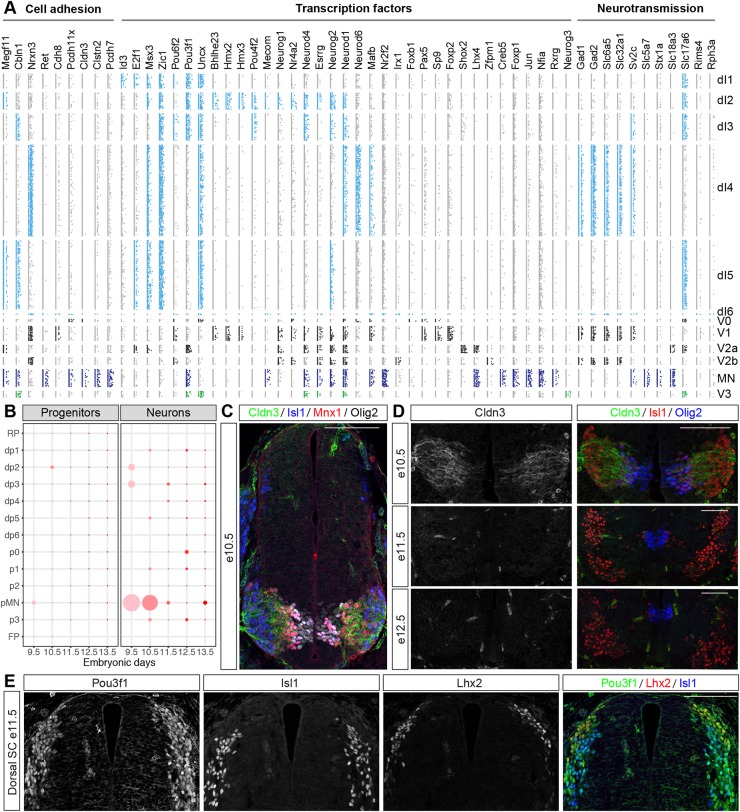
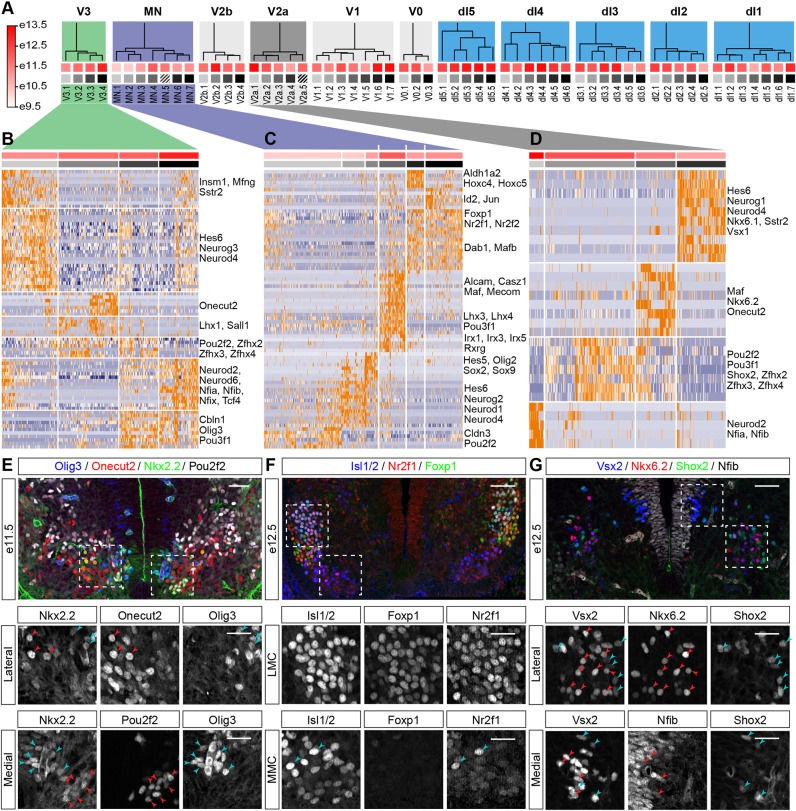
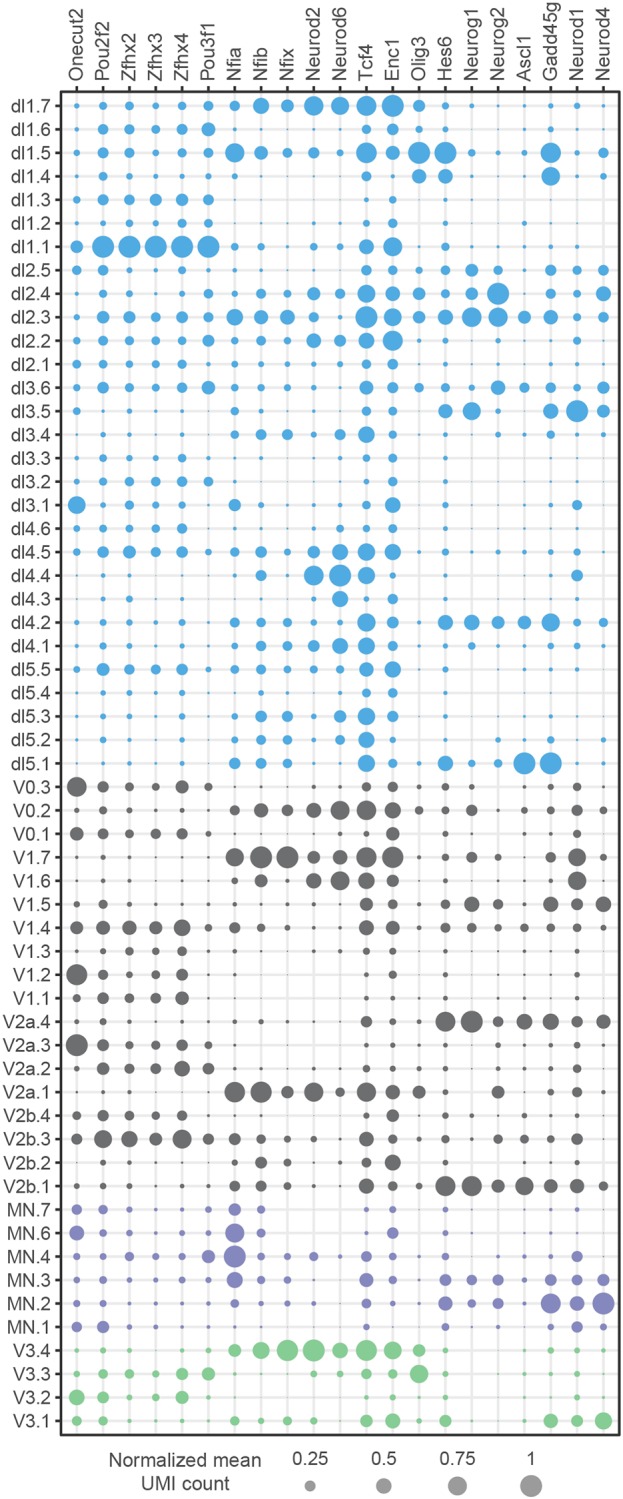
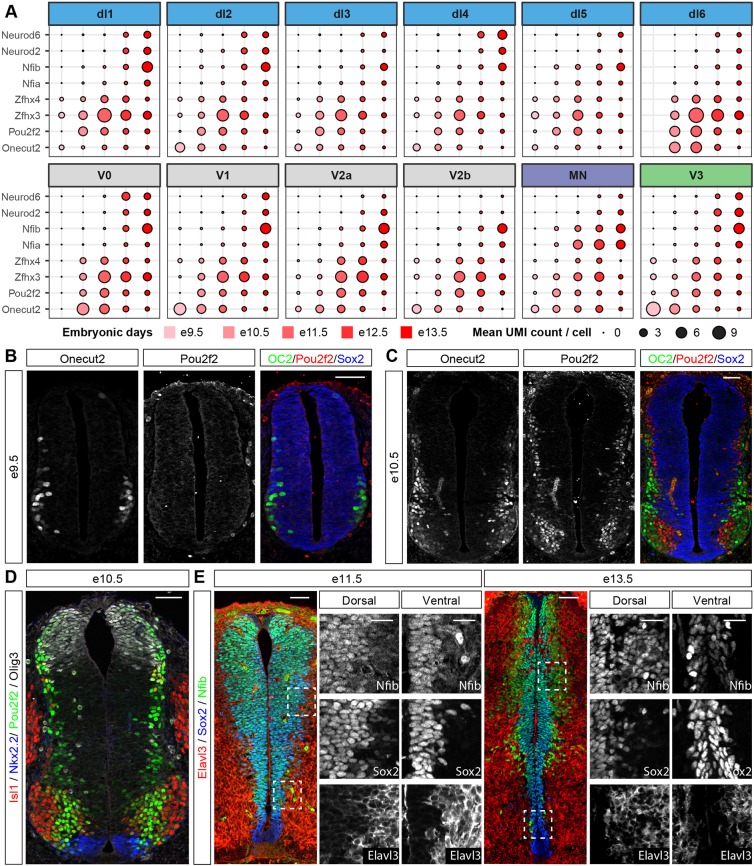
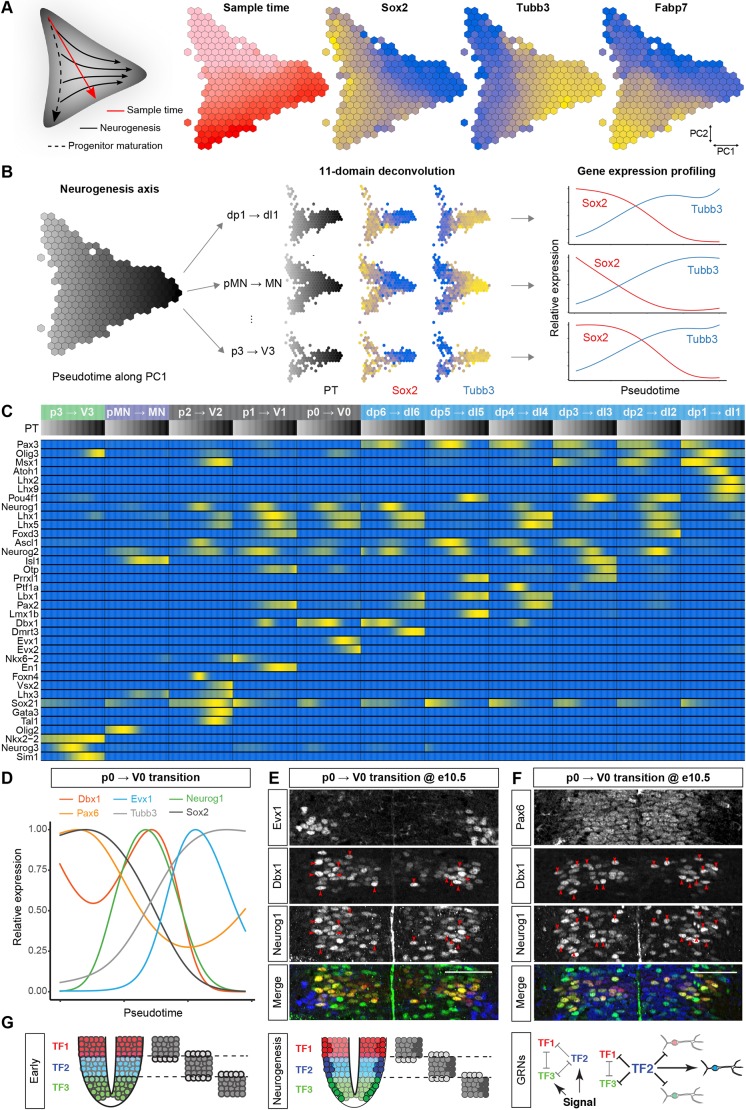
The coordinated spatial and temporal regulation of gene expression in the vertebrate neural tube determines the identity of neural progenitors and the function and physiology of the neurons they generate. Progress has been made deciphering the gene regulatory programmes that are responsible for this process; however, the complexity of the tissue has hampered the systematic analysis of the network and the underlying mechanisms. To address this, we used single cell mRNA sequencing to profile cervical and thoracic regions of the developing mouse neural tube between embryonic days 9.5-13.5. We confirmed that the data accurately recapitulates neural tube development, allowing us to identify new markers for specific progenitor and neuronal populations. In addition, the analysis highlighted a previously underappreciated temporal component to the mechanisms that generate neuronal diversity, and revealed common features in the sequence of transcriptional events that lead to the differentiation of specific neuronal subtypes. Together, the data offer insight into the mechanisms that are responsible for neuronal specification and provide a compendium of gene expression for classifying spinal cord cell types that will support future studies of neural tube development, function and disease.

Keywords: Neural development; Neural tube; ScRNA-seq; Single cell transcriptomics; Spinal cord.


Conflict of interest statement

Competing interestsThe authors declare no competing or financial interests.

Figures

Fig. 1.
Fig. 1.
High throughput scRNA-seq from the developing spinal cord. (A) Cervical (orange) and thoracic (blue) regions of the spinal cord of mouse embryos from stage e9.5 to e13.5 were dissected, dissociated and sequenced using the 10x Genomics Chromium system. (B) Partitioning of cells to specific tissue types based on the combinatorial expression of known markers. (C,E) Bubble charts that depict the expression of markers used to identify DV domains of progenitors (C) and neuronal classes (E). Circle size indicates normalised gene expression levels. Genes selected for cell categorisation are coloured; grey circles correspond to markers not used for the selection of a specific population. (D) tSNE plot of the entire dataset based on transcriptional similarity using the same markers as B, coloured by assigned cell type. Neural progenitors (yellow) and neurons (orange) were selected for further analysis.
Fig. 2.
Fig. 2.
Dynamics of domain sizes based on the single cell sequencing data. (A-D) Changes in the fraction of progenitors (A,C) and neurons (B,D) between e9.5 and e13.5. For A and B, the data are normalised to the sum of neurons and progenitors detected at each timepoint. C and D show fractions within progenitors (C) or neurons (D). (E) Comparison of the ratio of progenitors from our dataset (solid lines) with those of Kicheva et al. (2014) (dashed lines). The broader domains pI and pD are composed of p0-p2 and pd1-pd6 progenitors, respectively. hph, hours post headfold.
Fig. 3.
Fig. 3.
Spatial and temporal patterns of gene expression in neural progenitors and neurons. (A) Identification of differentially expressed genes that encode cell adhesion molecules, TFs, and proteins that are involved in neurotransmission. Genes used in the initial partitioning of cell types are not shown. (B) Spatial and temporal expression of Cldn3 in neural progenitors and neurons in the dataset. Cldn3 is specifically expressed in MNs until e10.5. (C) Immunostaining at e10.5 for Cldn3 (green), Isl1 (blue), Mnx1 (red) and Olig2 (grey). (D) Cldn3 expression is specific to MNs at e10.5, and lost in MNs at e11.5 and e12.5. (E) Pou3f1 is expressed in dorsal d1-3 neurons at e11.5. dI1 neurons are labelled by Lhx2 expression and dI3 neurons by Isl1 expression. Scale bars: 100 µm.
Fig. 4.
Fig. 4.
Hierarchical clustering identifies neuronal subtypes and implicates TFs in determining their identity. (A) Hierarchical clustering of the cardinal types of spinal cord neurons reveals 59 neuronal subtypes. Dendrograms for each neuronal domain are depicted. Squares under the dendrogram indicate average age (red) and neuronal subtype identity (grey). Colours of squares correspond to those shown on top of the heatmaps in panels B-D and Fig. S4. Striped squares correspond to incorrectly classified cells that were discarded from further analysis. (B-D) Identification of neuronal subtypes by clustering of gene expression profiles in V3 (B), MNs (C) and V2a interneurons (D). Hierarchical clustering was performed using the indicated gene modules (Table S2). A subset of the genes that are included in the modules is indicated on the right-hand side. (E-G) Validation of predicted gene expression patterns obtained from the hierarchical clustering in B-D. Boxed areas are magnified in the middle and bottom rows. Expression of Pou2f2 is detected in Nkx2.2-expressing V3 neurons at e11.5. Pou2f2 expression does not overlap with Onecut2 in more dorsal V3 neurons or Olig3 in V3 neurons abutting the p3 domain (E). Nr2f1 expression is seen in Foxp1-positive LMC neurons at e12.5 (F, middle row). A few Nr2f1-positive cells are also detected in Foxp1-negative MNs within the MMC (F, bottom row). Nkx6.2 expression in lateral Vsx2-expressing V2a neurons does not overlap Shox2 expression at e12.5 (G, middle row). Nfib expression is confined to medial V2a neurons at this stage (G, bottom row). Red arrowheads indicate cells expressing markers in the middle column; blue arrowheads indicate cells expressing markers in the right column. Scale bars: 50 µm; 25 µm in magnified boxed areas.
Fig. 5.
Fig. 5.
Subdivision of neuronal classes by a shared set of TFs. Gene expression profiles of TFs that define subpopulations of neurons in multiple domains. Circle size indicates normalised gene expression levels. Colour indicates domain identities according to Fig. 1E.
Fig. 6.
Fig. 6.
Temporal stratification of neuronal subtypes by shared sets of TFs. (A) Temporal expression of a shared set of TFs in different neuronal populations identifies two waves of neurogenesis. The size of the circles indicates the mean expression of genes per stage and domain, and the colour indicates the age of the sample. (B) Onecut2 (OC2), but not Pou2f2, is expressed in neurons at e9.5. (C) Mutually exclusive expression of Onecut2 and Pou2f2 in spinal cord neurons at e10.5. Note that Onecut2-expressing neurons are typically located more laterally than Pou2f2-positive neurons. (D) Widespread expression of Pou2f2 at e10.5 in differentiating neurons close to the ventricular zone. Pou2f2 expression colocalises with Olig3, Nkx2.2 and Isl1. (E) Increased expression of Nfib in differentiating neurons at late developmental stages. Boxed areas are magnified in the middle and right rows for each developmental stage. Nfib is expressed at low levels at e11.5 in progenitors that are labelled with Sox2 and is not detected in neurons. By contrast, at e13.5 Nfib expression is observed in neurons that also express the neuronal marker Elavl3. Scale bars: 50 µm; 25 µm in in magnified boxed areas.
Fig. 7.
Fig. 7.
Pseudotemporal ordering reveals gene expression dynamics during neurogenesis. (A) PCA projection of all neural cells, shown on a hexagonal heatmap, from a 100-dimensional space that was defined by genes expressed in all DV domains during progenitor maturation and neurogenesis. The schematic on the left depicts progenitor maturation (top to bottom), and neurogenesis (left to right). The hexagonal heatmaps indicate the number of cells from different developmental stages and the expression pattern of the pan-progenitor marker Sox2, the neuronal marker Tubb3, and the gliogenic marker Fabp7 (blue, low; yellow, high). (B) The first principal component of the cell state graph was used to independently reconstruct neurogenesis in each DV domain. Cells allocated to specific DV domains were plotted along the differentiation trajectory, and the expression profile of genes were independently reconstructed. (C) Upregulation of domain-specific TFs coincides with neurogenesis in multiple domains. Heatmap, including the normalised expression pattern (blue, low; yellow, high) of genes that are involved in neurogenesis per domain along the pseudotemporal (PT) axis (grey, early; black, late). (D) Smoothed expression profile of the neurogenic trajectory from p0 to V0 shows a transient upregulation of Dbx1 before neurogenesis that coincides with the maximal expression of Neurog1. (E,F) Upregulation of Dbx1 coincides with Neurog1 expression. Co-expression of Dbx1 and Neurog1 in cells in the differentiation zone of the ventricular layer in the p0 domain at eE10.5 (E). V0 neurons are identified by the expression of Evx1. Although Dbx1 expression is maximal in differentiating progenitors at e10.5, Pax6 expression is homogeneous in all p0 progenitors (F). Red arrowheads indicate cells expressing Neurog1 and high levels of Dbx1. (G) Domain-specific TFs are upregulated before neurogenesis. Initially, domain-specific TFs specify progenitor identity. Upon neurogenesis, domain-specific TF expression is transiently upregulated to reinforce the subtype identity of the differentiating neurons. Scale bars: 50 µm.

References

    1. Alaynick W. A., Jessell T. M. and Pfaff S. L. (2011). SnapShot: spinal cord development. Cell 146, 178.e1 10.1016/j.cell.2011.06.038 - DOI - PMC - PubMed
    1. Bikoff J. B., Gabitto M. I., Rivard A. F., Drobac E., Machado T. A., Miri A., Brenner-Morton S., Famojure E., Diaz C., Alvarez F. J. et al. (2016). Spinal inhibitory interneuron diversity delineates variant motor microcircuits. Cell 165, 207-219. 10.1016/j.cell.2016.01.027 - DOI - PMC - PubMed
    1. Borowska J., Jones C. T., Zhang H., Blacklaws J., Goulding M. and Zhang Y. (2013). Functional subpopulations of V3 interneurons in the mature mouse spinal cord. J. Neurosci. 33, 18553-18565. 10.1523/JNEUROSCI.2005-13.2013 - DOI - PMC - PubMed
    1. Briggs J. A., Li V. C., Lee S., Woolf C. J., Klein A. and Kirschner M. W. (2017). Mouse embryonic stem cells can differentiate via multiple paths to the same state. eLife 6, e26945 10.7554/eLife.26945 - DOI - PMC - PubMed
    1. Briscoe J. and Small S. (2015). Morphogen rules: design principles of gradient-mediated embryo patterning. Development 142, 3996-4009. 10.1242/dev.129452 - DOI - PMC - PubMed

Publication types