. 2019 Mar 7;146(5):dev172361.
doi: 10.1242/dev.172361.

Kidney micro-organoids in suspension culture as a scalable source of human pluripotent stem cell-derived kidney cells

Affiliations

Kidney micro-organoids in suspension culture as a scalable source of human pluripotent stem cell-derived kidney cells

Santhosh V Kumar et al. Development. .

Abstract

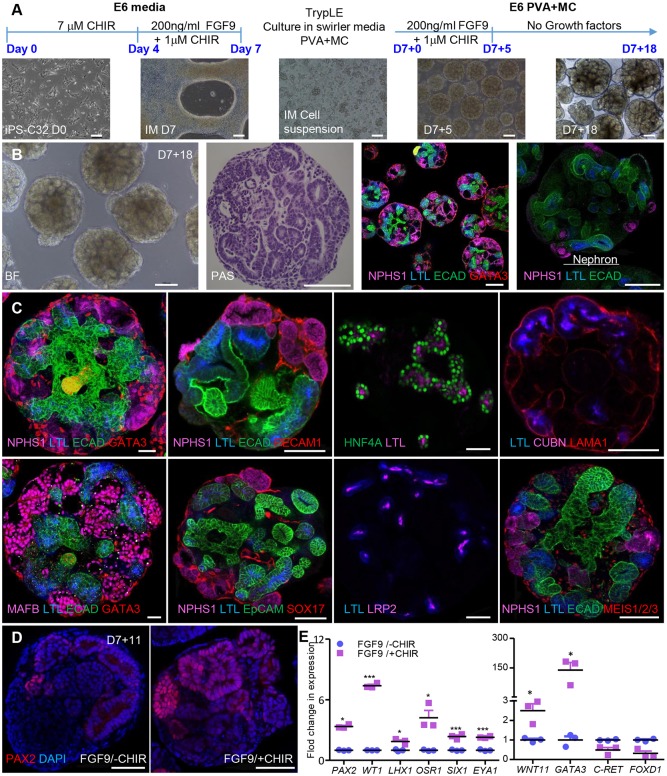
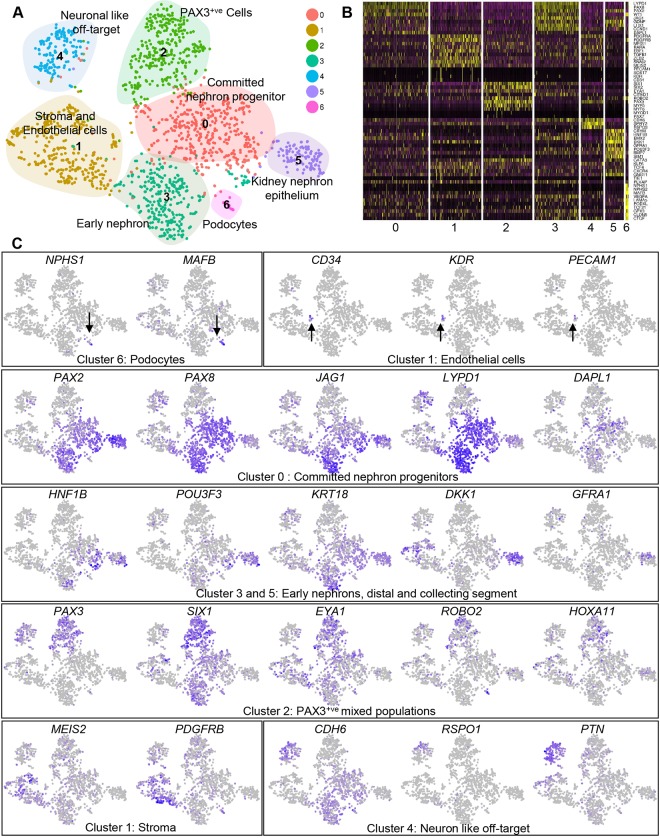
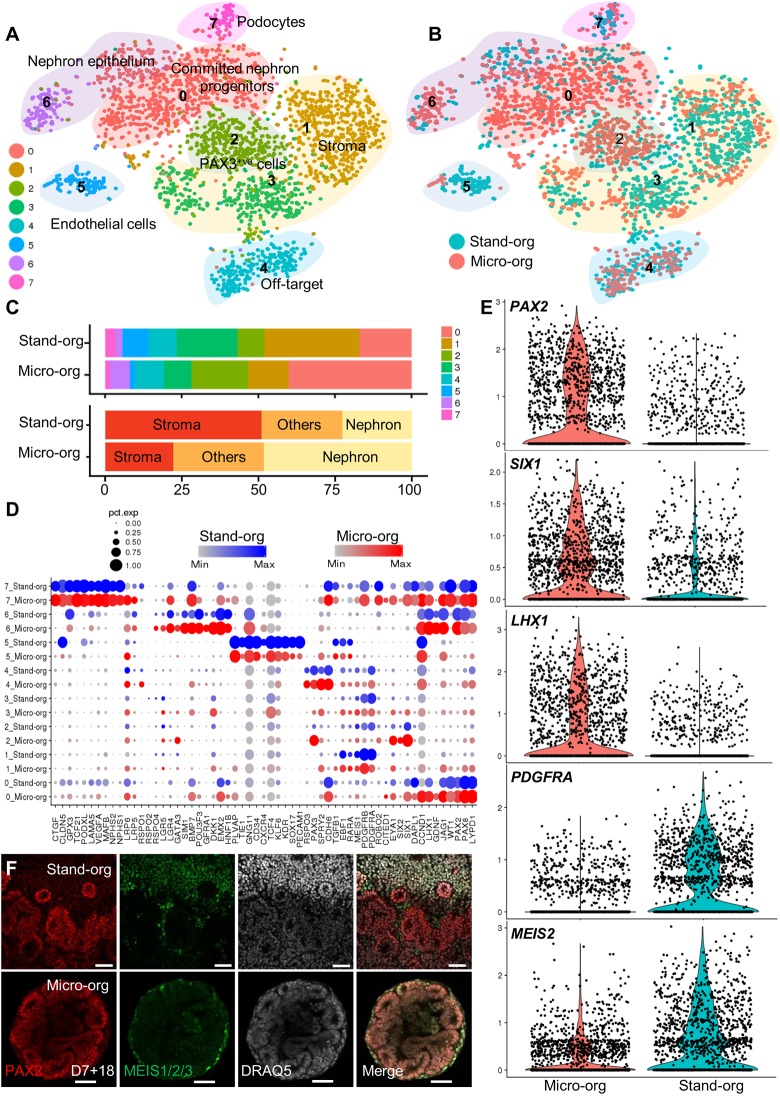
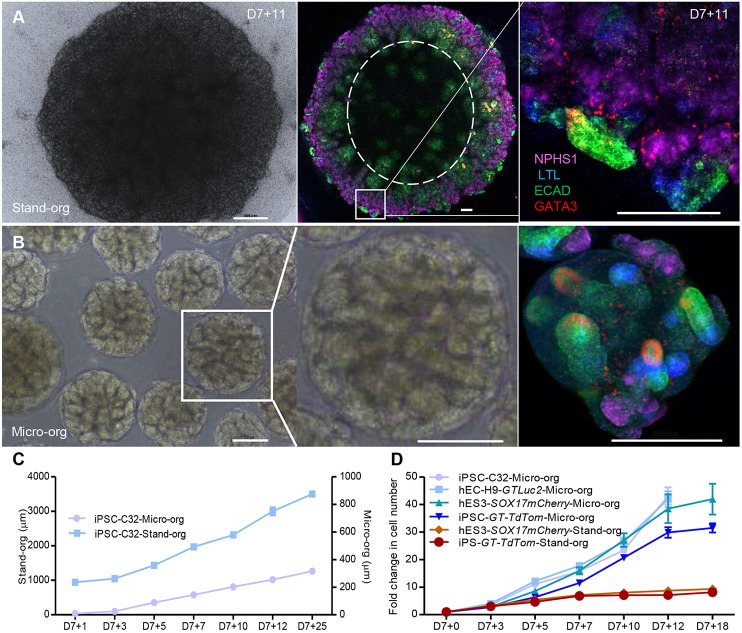
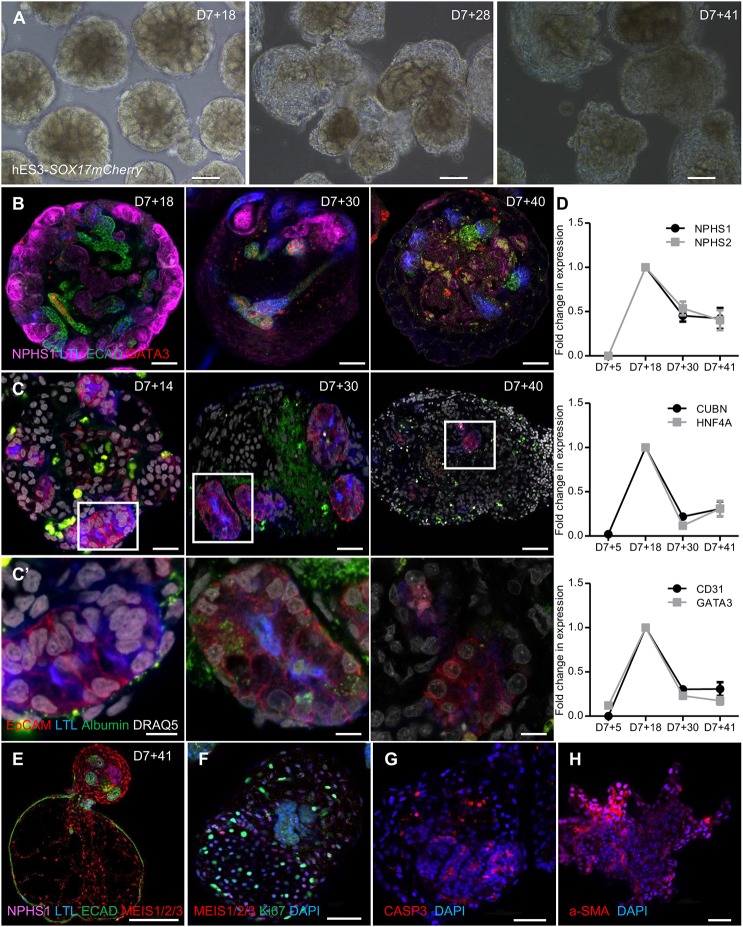
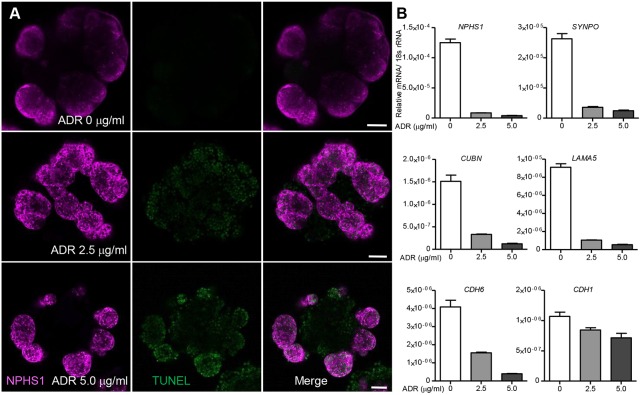
Kidney organoids have potential uses in disease modelling, drug screening and regenerative medicine. However, novel cost-effective techniques are needed to enable scaled-up production of kidney cell types in vitro We describe here a modified suspension culture method for the generation of kidney micro-organoids from human pluripotent stem cells. Optimisation of differentiation conditions allowed the formation of micro-organoids, each containing six to ten nephrons that were surrounded by endothelial and stromal populations. Single cell transcriptional profiling confirmed the presence and transcriptional equivalence of all anticipated renal cell types consistent with a previous organoid culture method. This suspension culture micro-organoid methodology resulted in a three- to fourfold increase in final cell yield compared with static culture, thereby representing an economical approach to the production of kidney cells for various biological applications.

Keywords: Kidney; Kidney micro-organoid; Nephron; Organoid; Pluripotent stem cell; Single cell profiling; Suspension culture.


Conflict of interest statement

Competing interestsM.H.L. and S.V.K. hold a patent for the described protocol.

Figures

Fig. 1.
Fig. 1.
Generation of kidney micro-organoids in suspension culture. (A) Outline of the kidney micro-organoid differentiation protocol with images from a differentiation performed using CRL1502.C32 cells. (B) Bright-field image and PAS staining of kidney micro-organoids in suspension on day 7+18 (left), and overview confocal immunofluorescence image showing the different nephron segments in multiple organoids and magnified confocal image showing the entire nephron structure within an organoid (right). (C) Confocal immunofluorescence images of nephron compartments within day 7+18 kidney micro-organoids; podocytes (NPHS1+ and MAFB+), proximal tubules (LTL+, CUBN+, LRP2+ and HNF4A+), distal tubules (ECAD), collecting duct (ECAD+ GATA3+) and endothelial cells (SOX17+ and PECAM1+) (scale 50 µm). (D) Confocal immunofluorescence for PAX2 for ±1 µM CHIR99021 treatment (scale 50 µm). (E) Bar graphs showing average fold change for IM gene expression profiling by qPCR on day 7+0 for ±1 µM CHIR99021. Data are mean±s.e.m. *P<0.05, ***P<0.001; determined using two-tailed unpaired t-test. Scale bars: 50 µm (A); 100 µm (B); 50 µm (C,D).
Fig. 2.
Fig. 2.
Transcriptional validation of kidney differentiation within micro-organoids. (A) t-SNE plot after Seurat clustering of single cell RNA-seq of day 7+18 CRL1502-C32 micro-organoids showing 7 different clusters. (B) Heat-map showing scaled gene expression of key marker genes within clusters. (C) t-SNE plots indicating the expression of key marker genes for selected nephron cell types. Colour intensity is scaled per gene, darker blue indicates higher expression. Arrows indicate podocytes and endothelial cells.
Fig. 3.
Fig. 3.
Comparative single cell transcriptional profiling of standard kidney organoids and micro-organoids demonstrates an equivalent nephrogenic patterning. (A) t-SNE plots after integrated Seurat analysis of kidney micro-organoid and standard organoid 10x scRNA-seq data from day 7+18 (CRL1502.32 cells) (Combes et al., 2019). (B) t-SNE plot representing micro-organoid (Micro-org; pink) and standard organoid (Stand-org; blue) contributions to cell types in each cluster. (C) Bar graph representing the proportion of each of the Micro-org or Stand-org datasets assigned to each transcriptional cluster and differentiation lineage type. (D) Split dot plots showing the gene expression of kidney markers in each cluster between kidney micro-organoids and standard organoid. (E) Violin and scatter plots showing the log-normalised counts per cell for nephron-related (PAX2, SIX1, LHX1) and stromal-related (PDGFRA, MEIS2) genes within Micro-org and Stand-org. (F) Immunofluorescence showing the expression of PAX2 and MEIS1/2/3 between kidney Micro-org and Stand-org. Scale bars: 50 µm.
Fig. 4.
Fig. 4.
Kidney micro-organoids provide a better platform for efficient hPSC-derived kidney cell scale-up. (A) Bright-field image of standard kidney organoid at day 7+11 (left), confocal immunofluorescence image (tile scan) of entire standard organoid showing the spatial restriction of nephron structures to the edge of the organoid (middle), and magnified image of the boxed area showing a nephron within that organoid (right). (B) Bright-field image of kidney micro-organoids (left) and magnified bright-field image of the boxed area, showing a single kidney micro-organoid (middle), and confocal immunofluorescence image of kidney micro-organoids at day 7+11 (right). (C) Change in size of the organoids at different stages of development. (D) Fold change in cell number (and scalable capacity) of micro-organoids compared with standard organoid over time. Scale bars: 500 µm (A, left); 200 µm (A, middle and right, B).
Fig. 5.
Fig. 5.
Extended micro-organoid culture. (A) Bright-field images of extended culture of kidney micro-organoids in suspension using hES3-SOX17 mCherry cells on day 7+18, day 7+28 and day 7+41. (B) Confocal immunofluorescence images of different nephron segments on day 7+18, day 7+30 and day 7+40. (C,C′) Confocal immunofluorescence images showing albumin (FITC) uptake at different stages of micro-organoid culture. C′ shows magnified images of the boxed areas in C above. (D) qPCR showing the fold change in gene expression for different nephron segments on day 7+5, day 7+18, day 7+30 and day 7+41 of kidney micro-organoid culture (n=3). Top, podocytes; middle, proximal tubules; bottom, distal tubules and endothelial cells. (E-H) Confocal immunofluorescence images of hES3-SOX17 mCherry micro-organoids after extended culture to day 7+41, illustrating morphological changes. Dysplastic organoids are stained for different segments of nephron and stoma (E), show proliferation within an expanding stromal population (F), and evidence of apoptotic cells (CASP3+) (G) and fibrotic (α-SMA) lesions (H). Scale bars: 100 µm (A); 50 µm (B,E-H); 20 µm (C); 5 µm (C′).
Fig. 6.
Fig. 6.
Adriamycin-induced toxicity in micro-organoids. (A) Confocal immunofluorescence image analysis of micro-organoids after treatment with Adriamycin (0, 2.5 and 5 µg/ml) for 24 h. Apoptotic cells were identified by TUNEL staining. (B) qPCR analysis showing dose-dependent toxicity induced by Adriamycin on kidney organoids by reduced expression for kidney marker genes (n=2). Scale bars: 50 µm.

References

    1. Briggs J. A., Sun J., Shepherd J., Ovchinnikov D. A., Chung T.-L., Nayler S. P., Kao L.-P., Morrow C. A., Thakar N. Y., Soo S.-Y. et al. (2013). Integration-free induced pluripotent stem cells model genetic and neural developmental features of down syndrome etiology. Stem Cells 31, 467-478. 10.1002/stem.1297 - DOI - PubMed
    1. Butler A., Hoffman P., Smibert P., Papalexi E. and Satija R. (2018). Integrating single-cell transcriptomic data across different conditions, technologies, and species. Nat. Biotechnol. 36, 411-420. 10.1038/nbt.4096 - DOI - PMC - PubMed
    1. Combes A. N., Zappia L., Er P. X., Oshlack A. and Little M. H. (2019). Single-cell analysis reveals congruence between kidney organoids and human fetal kidney. Genome Med. 11, 3 10.1186/s13073-019-0615-0 - DOI - PMC - PubMed
    1. Combes A. N., Phipson B., Zappia L., Lawlor K., Er P. X., Oshlack A. and Little M. (2017). High throughput single cell RNA-seq of developing mouse kidney and human kidney organoids reveals a roadmap for recreating the kidney. bioRxiv. 10.1101/235499 - DOI
    1. Cruz N. M., Song X., Czerniecki S. M., Gulieva R. E., Churchill A. J., Kim Y. K., Winston K., Tran L. M., Diaz M. A., Fu H. et al. (2017). Organoid cystogenesis reveals a critical role of microenvironment in human polycystic kidney disease. Nat. Mater. 16, 1112-1119. 10.1038/nmat4994 - DOI - PMC - PubMed

Publication types