. 2019 Jun 15;25(12):3689-3701.
doi: 10.1158/1078-0432.CCR-18-1515. Epub 2019 Mar 7.

Multi-omics Integration Analysis Robustly Predicts High-Grade Patient Survival and Identifies CPT1B Effect on Fatty Acid Metabolism in Bladder Cancer

Affiliations

Multi-omics Integration Analysis Robustly Predicts High-Grade Patient Survival and Identifies CPT1B Effect on Fatty Acid Metabolism in Bladder Cancer

Venkatrao Vantaku et al. Clin Cancer Res. .

Abstract

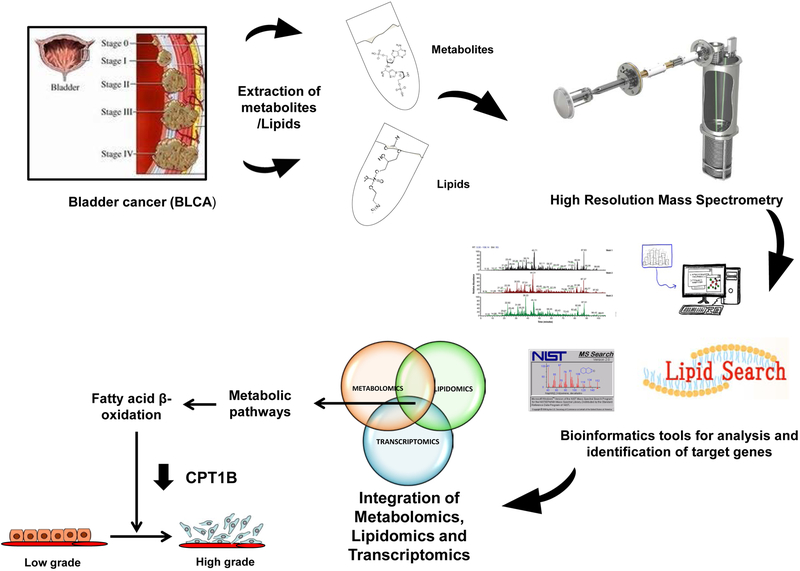
Purpose: The perturbation of metabolic pathways in high-grade bladder cancer has not been investigated. We aimed to identify a metabolic signature in high-grade bladder cancer by integrating unbiased metabolomics, lipidomics, and transcriptomics to predict patient survival and to discover novel therapeutic targets.

Experimental design: We performed high-resolution liquid chromatography mass spectrometry (LC-MS) and bioinformatic analysis to determine the global metabolome and lipidome in high-grade bladder cancer. We further investigated the effects of impaired metabolic pathways using in vitro and in vivo models.

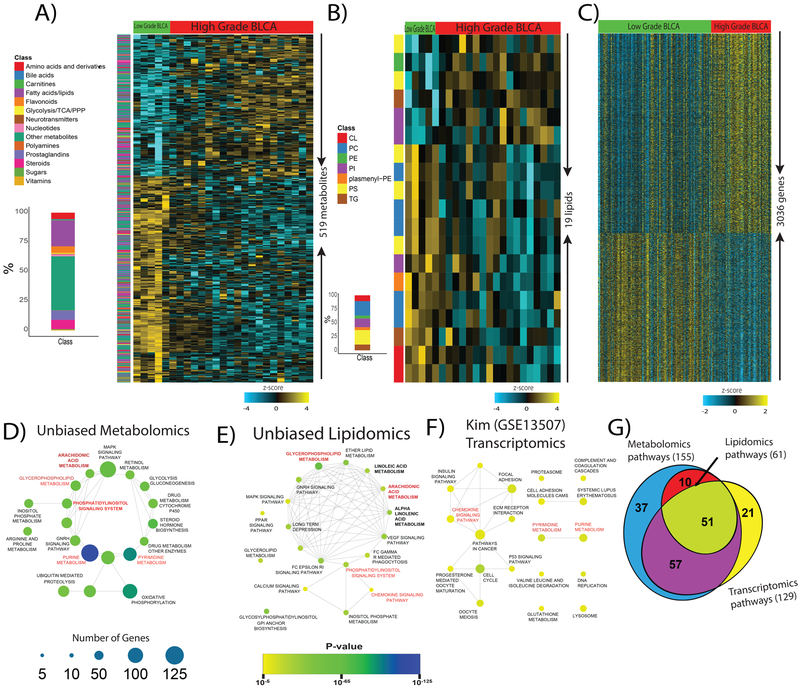
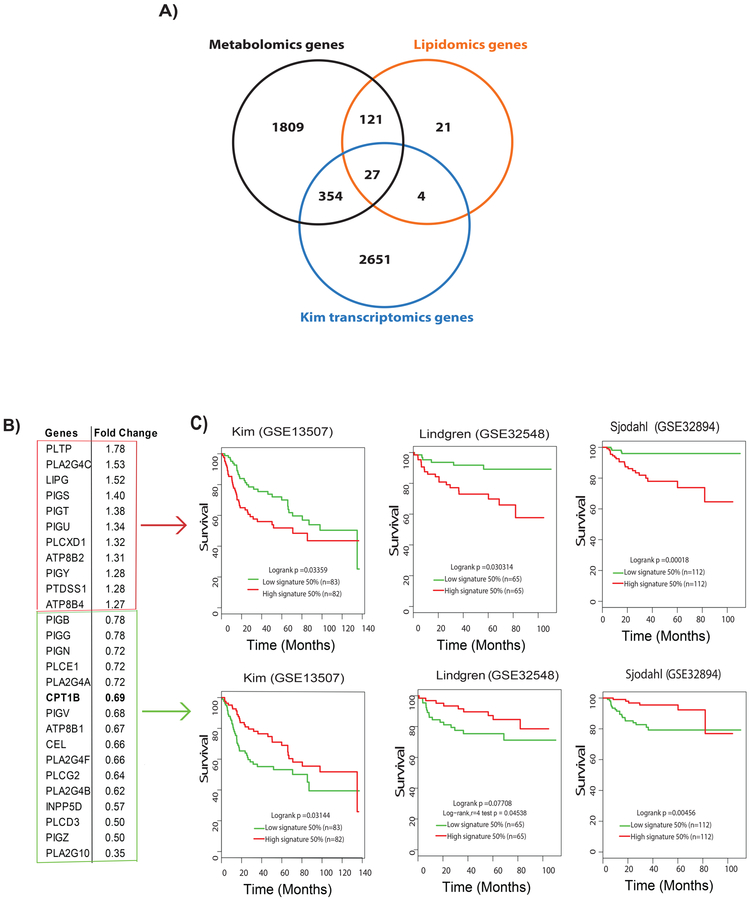
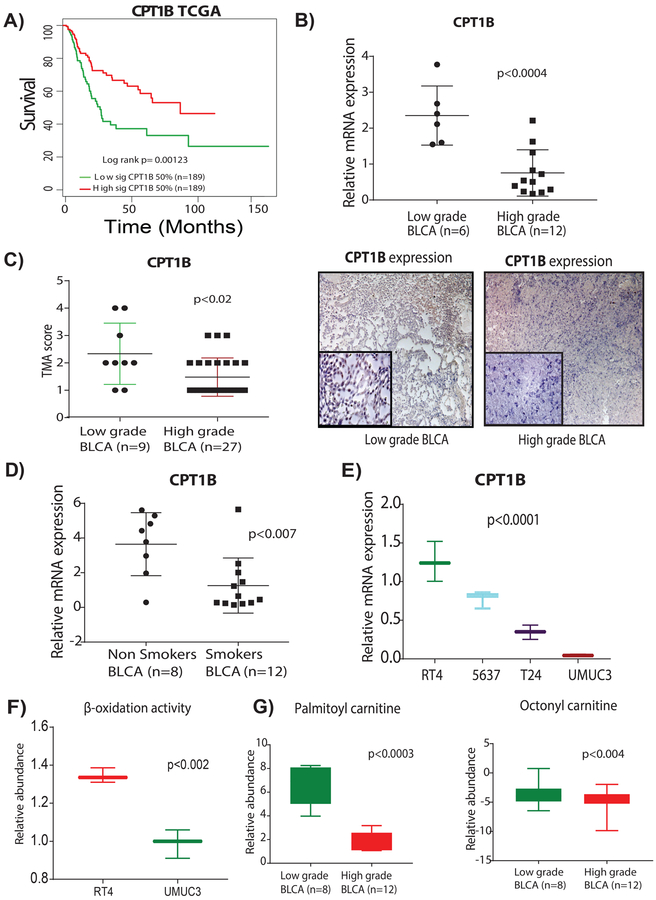
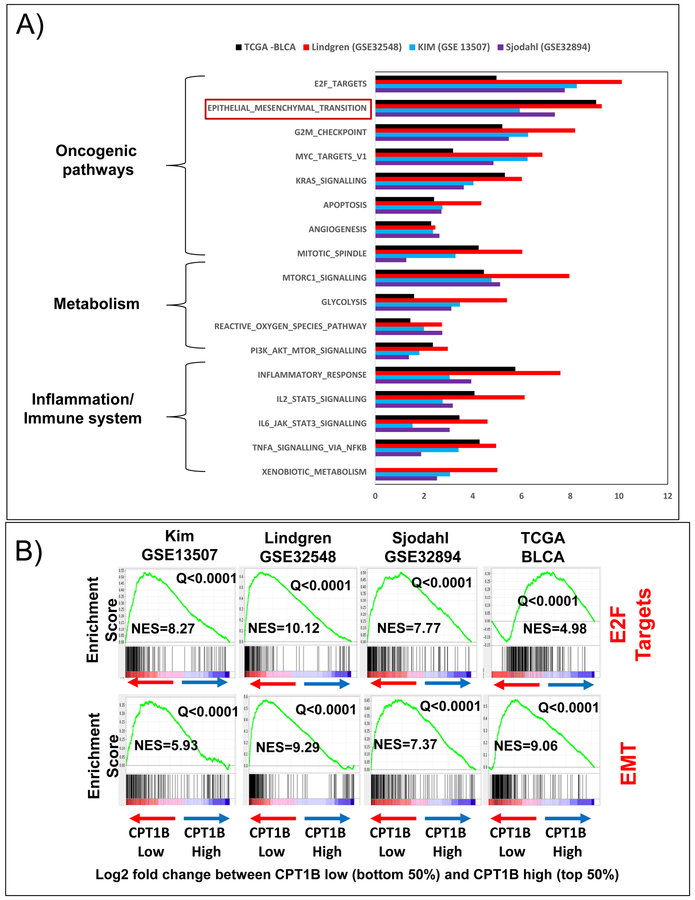
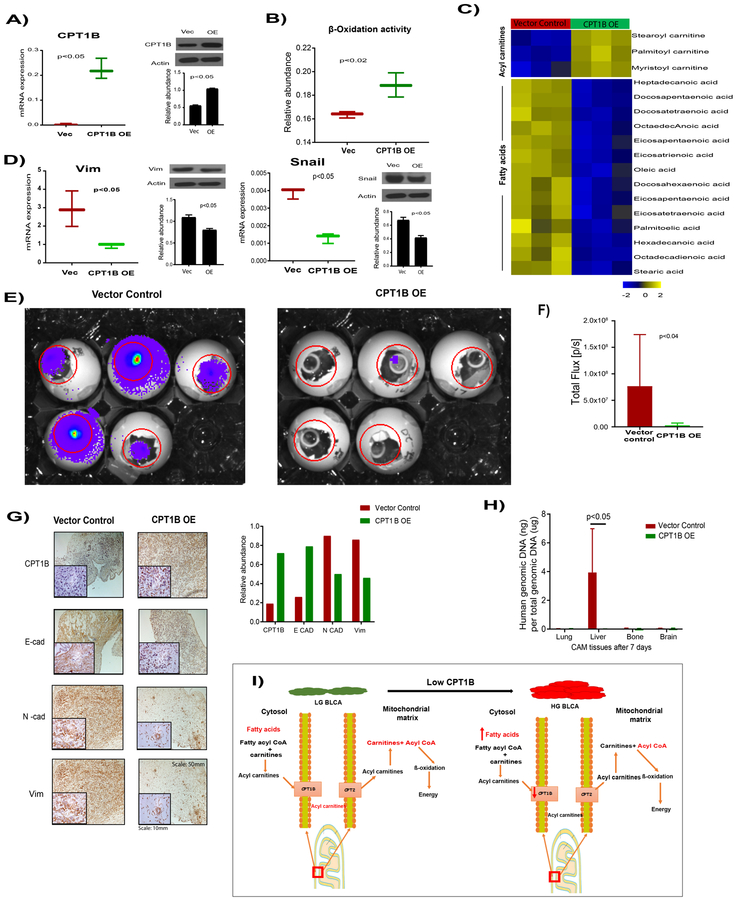
Results: We identified 519 differential metabolites and 19 lipids that were differentially expressed between low-grade and high-grade bladder cancer using the NIST MS metabolomics compendium and lipidblast MS/MS libraries, respectively. Pathway analysis revealed a unique set of biochemical pathways that are highly deregulated in high-grade bladder cancer. Integromics analysis identified a molecular gene signature associated with poor patient survival in bladder cancer. Low expression of CPT1B in high-grade tumors was associated with low FAO and low acyl carnitine levels in high-grade bladder cancer, which were confirmed using tissue microarrays. Ectopic expression of the CPT1B in high-grade bladder cancer cells led to reduced EMT in in vitro, and reduced cell proliferation, EMT, and metastasis in vivo.

Conclusions: Our study demonstrates a novel approach for the integration of metabolomics, lipidomics, and transcriptomics data, and identifies a common gene signature associated with poor survival in patients with bladder cancer. Our data also suggest that impairment of FAO due to downregulation of CPT1B plays an important role in the progression toward high-grade bladder cancer and provide potential targets for therapeutic intervention.


Conflict of interest statement

Conflict of interest: Authors do not have any conflict of interest.

Figures

Figure 1.
Figure 1.. Overview of the strategy used to profile the global metabolome and lipidome and integrated them with the transcriptome to characterize low-grade and high-grade BLCA.
Figure 2.
Figure 2.. Identification of altered metabolites, lipids, and transcripts and their respective pathways in high-grade BLCA.
A) Heat map of hierarchical clustering of 519 differentially expressed metabolites from different classes of biomolecules detected across low-grade and high-grade BLCA samples (FDR<0.25). Each class of metabolites is represented in a different color. B) Heat map of hierarchical clustering of 19 differentially expressed lipids from various classes detected across low-grade and high-grade BLCA samples (FDR<0.25). Each class of lipids is represented in a different color. C) Heat map of hierarchical clustering of 3036 differentially expressed genes from the Kim dataset (GSE13507) across low-grade and high-grade BLCA samples (p<0.05). Columns represent individual tissue samples; rows refer to distinct metabolites, lipids, and genes. Shades of yellow indicate different levels of increase in expression; shades of blue indicate different levels of decrease in expression relative to the median levels. D, E, and F) Pathway enrichment analysis of differentially expressed metabolites, lipids, and genes shows the significantly altered pathways in high-grade BLCA (p<0.05). The node size indicates the number of genes involved in the pathway (deregulated pathways common to the metabolomics, lipidomics, and transcriptomics data sets are highlighted in red). G) Venn diagram of the deregulated metabolic pathways common to the metabolomics, lipidomics, and transcriptomics data sets.
Figure 3.
Figure 3.. Metabolomic-lipidomic–transcriptomic integration strategies to identify potential prognostic gene signature for BLCA.
A) The integration of a significant genes derived from metabolomics, lipidomics, and transcriptomics data comparing low-grade and high-grade BLCA resulted in a set of 27 common genes. B) Eleven upregulated and 16 down-regulated genes in high-grade BLCA in the Kim cohert (GSE13507) with their fold change. C) Survival analysis shows poor survival associated with the upregulated gene signature (Kim, log rank p =0.03359;, Lindgren (GSE32584), log-rank p=0.030314;, Sjodahl (GSE32894), log-rank p=0.00018) and downregulated gene signature (Kim, log-rank p=0.03144;, Lindgren, log-rank p=0.07708; and Sjodahl, log-rank p=0.00456.
Figure 4.
Figure 4.. Suppression of CPT1B is associated with poor survival, low β-oxidation, and low levels of acylcarnitines in high-grade BLCA.
A) Low expression of CPT1B was associated with poor survival in TCGA cohort (log-rank p= 0.00123). B) Low CPT1B mRNA expression demonstrates the low CPT1B expression in high-grade BLCA (n=6 and n=12 low-grade and high-grades tissues respectively; p<0.0004. C) TMA analysis of BLCA patient tissues (n=9 and n=27, low-grade and high-grade respectively) shows a trend for lower intensity in the high-grade tissues (p<0.02). Immunohistochemistry (IHC) analysis shows the low CPT1B protein levels in high-grade BLCA; on a scoring scale of 1–4, one is low intensity and 4 is the highest intensity of the CPT1B expression. D) mRNA expression analysis shows the low CPT1B expression in smokers with BLCA (n=8 and n=12 non-smokers and smokers respectively; p<0.007). E) mRNA expression analysis shows a gradual decrease of CPT1B levels with an increased grades of the BLCA in cell lines (p<0.0001). For all the mRNA measurements CPT1B levels were normalized to a GAPDH internal control. F) LC-MS based analysis using Biocrates AbsoluteIDQ p180 Kit shows the low β-oxidation activity in high-grade BLCA cell lines (p<0.02). G) LC-MS based analysis reveals low levels of palmitoyl (p<0.0003) and octanoyl (p<0.004) carnitines in patients with high-grade BLCA.
Figure 5.
Figure 5.. Low expression of CPT1B is associated with key oncogenic, metabolic pathways in high-grade BLCA.
A) Gene set enrichment analysis (GSEA) revealed that genes associated with CPT1B down-regulation are significantly enriched in oncogenic, metabolic, and immune pathways in the Kim, Lindgren, Sjodahl, and TCGA cohorts. B) CPT1B downregulation was highly associated with enrichment of E2F targets and EMT signatures in all cohorts. The values on the y-axis for each graph represent enrichment scores (corresponding to the magnitude of the enrichment for each analysis). For each graph, the Normalized Enrichment Score (NES, computed via the GSEA analysis) and the significance of the enrichment (q=false discovery rate, also computed via the GSEA analysis). The NES scores ranged from 4 to 11 (all q<0.0001).
Figure 6.
Figure 6.. Effects of CPT1B in high-grade BLCA cell lines.
A) Adenovirus-mediated overexpression of CPT1B in the high grade BLCA cell line UMUC3 compared with a vector control, confirmed by qPCR and western blot. B) CPT1B overexpression increases the β-oxidation in high grade BLCA cells. C) Heat map of increased acyl carnitine levels and reduced fatty acid levels in CPT1B overexpressed cells compared to control cells (false discovery rate-corrected p-value <0.05). D) Expression of the epithelial and mesenchymal transition (EMT) markers vimentin and snail in CPT1B overexpressed cells compared with that in vector control cells. E) CPT1B over expressed cells formed significantly smaller tumors on chicken chorioallontoic membranes (CAMs) as measured by total photon flux of the region of interest (Day 15; red circle) (F). G) CPT1B overexpression significantly increased the E-cad, reduced the N-cad and vimentin levels in tumors after 7 days of tumor growth on CAMs, as evidenced by IHC analysis and quantification. H) CPT1B overexpression reduced the metastasis of UMUC3 cells into the chick embryo liver tissue as measured by RT-PCR of a human-specific Alu sequence in total genomic DNA (gDNA). I) Graphical representation of the role of CPT1B in BLCA progression. OE represents overexpression.

References

    1. Siegel RL, Miller KD & Jemal A Cancer Statistics, 2017. CA Cancer J Clin 67, 7–30 (2017). - PubMed
    1. Lin LL, Hsia CR, Hsu CL, Huang HC & Juan HF Integrating transcriptomics and proteomics to show that tanshinone IIA suppresses cell growth by blocking glucose metabolism in gastric cancer cells. BMC Genomics 16, 41 (2015). - PMC - PubMed
    1. Koplev S, Lin K, Dohlman AB & Ma’ayan A Integration of pan-cancer transcriptomics with RPPA proteomics reveals mechanisms of epithelial-mesenchymal transition. PLoS Comput Biol 14, e1005911 (2018). - PMC - PubMed
    1. Ettinger DS, et al. Non-Small Cell Lung Cancer, Version 6.2015. J Natl Compr Canc Netw 13, 515–524 (2015). - PubMed
    1. Gradishar WJ, et al. Breast Cancer Version 2.2015. J Natl Compr Canc Netw 13, 448–475 (2015). - PubMed

Publication types