. 2019 Jun;180(2):767-782.
doi: 10.1104/pp.19.00059. Epub 2019 Mar 7.

Separate Pathways Contribute to the Herbivore-Induced Formation of 2-Phenylethanol in Poplar

Affiliations

Separate Pathways Contribute to the Herbivore-Induced Formation of 2-Phenylethanol in Poplar

Jan Günther et al. Plant Physiol. 2019 Jun.

Abstract

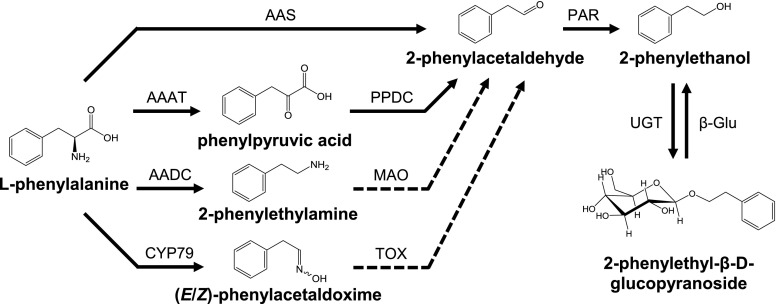
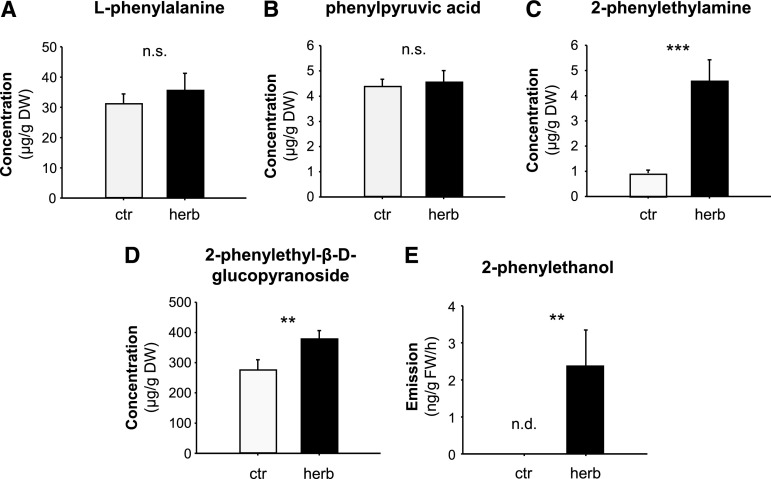
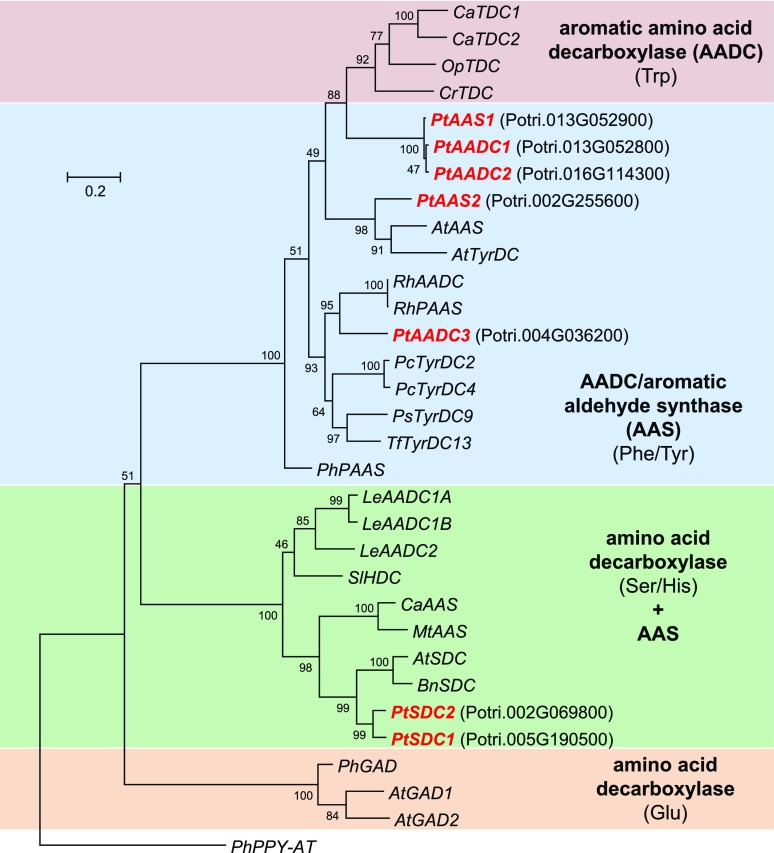
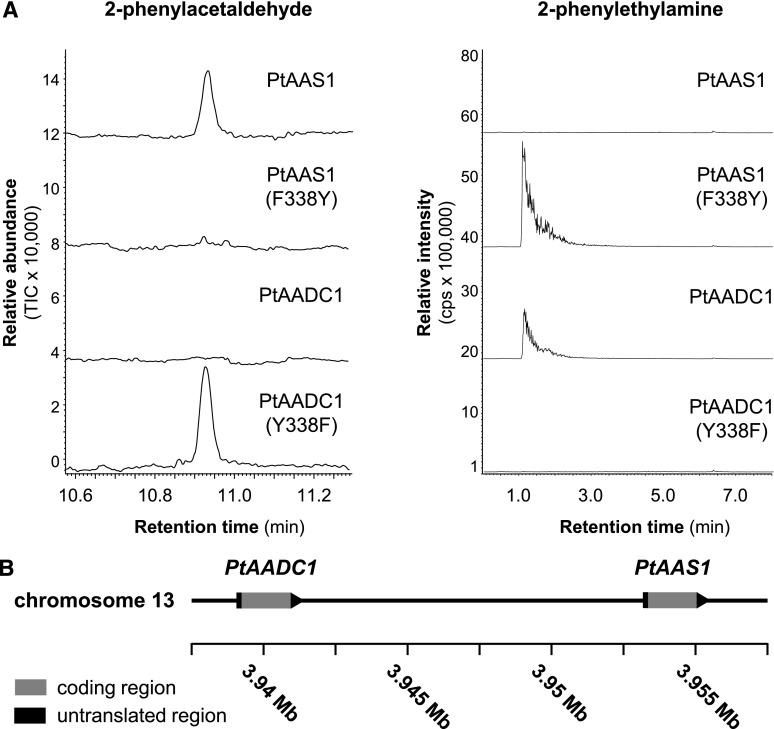
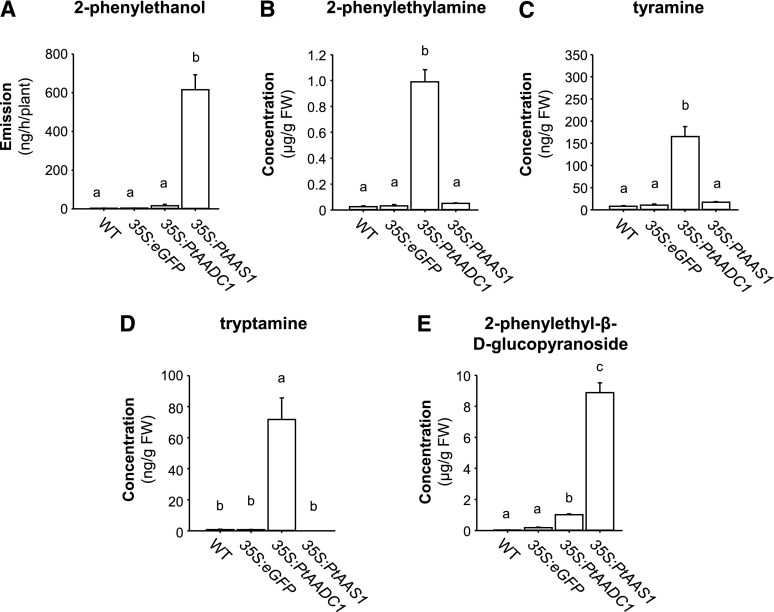
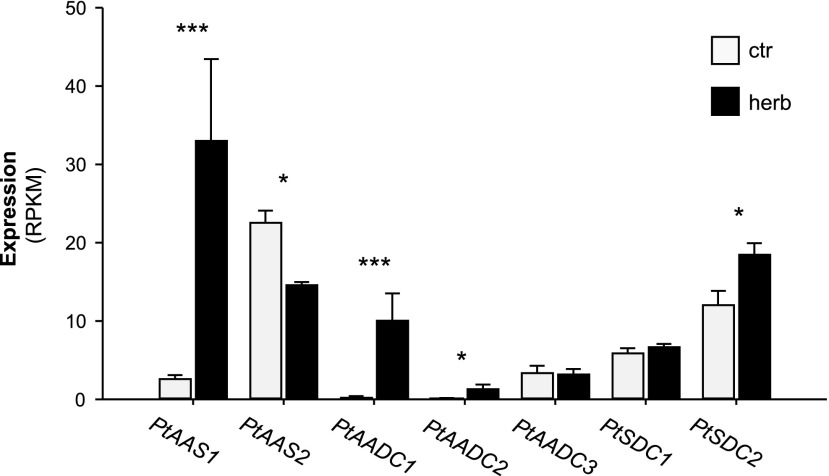
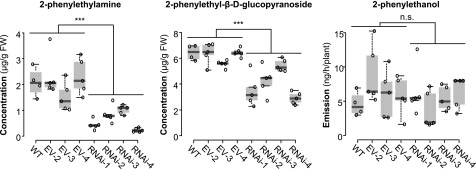
Upon herbivory, the tree species western balsam poplar (Populus trichocarpa) produces a variety of Phe-derived metabolites, including 2-phenylethylamine, 2-phenylethanol, and 2-phenylethyl-β-d-glucopyranoside. To investigate the formation of these potential defense compounds, we functionally characterized aromatic l-amino acid decarboxylases (AADCs) and aromatic aldehyde synthases (AASs), which play important roles in the biosynthesis of specialized aromatic metabolites in other plants. Heterologous expression in Escherichia coli and Nicotiana benthamiana showed that all five AADC/AAS genes identified in the P trichocarpa genome encode active enzymes. However, only two genes, PtAADC1 and PtAAS1, were significantly upregulated after leaf herbivory. Despite a sequence similarity of ∼96%, PtAADC1 and PtAAS1 showed different enzymatic functions and converted Phe into 2-phenylethylamine and 2-phenylacetaldehyde, respectively. The activities of both enzymes were interconvertible by switching a single amino acid residue in their active sites. A survey of putative AADC/AAS gene pairs in the genomes of other plants suggests an independent evolution of this function-determining residue in different plant families. RNA interference -mediated-downregulation of AADC1 in gray poplar (Populus × canescens) resulted in decreased accumulation of 2-phenylethylamine and 2-phenylethyl-β-d-glucopyranoside, whereas the emission of 2-phenylethanol was not influenced. To investigate the last step of 2-phenylethanol formation, we identified and characterized two P trichocarpa short-chain dehydrogenases, PtPAR1 and PtPAR2, which were able to reduce 2-phenylacetaldehyde to 2-phenylethanol in vitro. In summary, 2-phenylethanol and its glucoside may be formed in multiple ways in poplar. Our data indicate that PtAADC1 controls the herbivore-induced formation of 2-phenylethylamine and 2-phenylethyl-β-d-glucopyranoside in planta, whereas PtAAS1 likely contributes to the herbivore-induced emission of 2-phenylethanol.


Figures

Figure 1.
Figure 1.
Proposed pathways for the biosynthesis of 2-phenylethanol in poplar. CYP79, cytochrome P450 family 79 enzyme; PPDC, phenylpyruvic acid decarboxylase; MAO, monoamine oxidase; TOX, transoximase; UGT, UDP-glycosyltransferase; β-Glu, β-glucosidase. Solid lines indicate well-established reactions/enzymes; dashed lines indicate reactions hypothesized in the literature.
Figure 2.
Figure 2.
Herbivore-damaged leaves of P. trichocarpa accumulate and release Phe-derived metabolites. A–E, The accumulation of l-Phe (A), phenylpyruvic acid (B), 2-phenylethylamine (C), and 2-phenylethyl-β-d-glucopyranoside (D), and the emission of 2-phenylethanol (E) were analyzed in L. dispar damaged (herb) and undamaged control (ctr) leaves. Plant material was extracted with methanol and analyzed via LC-MS/MS (A–D). Volatiles were collected for 8 h and analyzed via GC-FID (E). Means ± se are shown (A–D, n = 10; E, n = 9). Asterisks indicate statistical significance as assessed by Student’s t test or Mann-Whitney Rank Sum tests. l-Phe (P = 0.530, t = −0.64); phenylpyruvic acid (P = 0.772, t = −0.294); 2-phenylethylamine (P < 0.001, T = 55); 2-phenylethyl-β-d-glucopyranoside (P = 0.011, T = 71); 2-phenylethanol (P = 0.005, T = 58.5). DW, dry weight; FW, fresh weight; n.s., not significant; n.d., not detected.
Figure 3.
Figure 3.
Dendrogram analysis of AAAD family genes from P. trichocarpa and characterized AADC, AAS, and Glu/Ser/His-decarboxylase genes from other plants. Substrates of each clade are indicated in parentheses. The tree was inferred by using the maximum likelihood method and n = 1,000 replicates for bootstrapping. Bootstrap values are shown next to each node. The tree is drawn to scale, with branch lengths measured in the number of substitutions per site. Genes described in this study are shown in red and bold with corresponding gene identifiers (italics). Accession numbers are given in Supplemental Table S1.
Figure 4.
Figure 4.
PtAAS1 and PtAADC1 are interconvertible by the mutation of a single amino acid and are likely derived by tandem gene duplication. A, The recombinant proteins PtAAS1, PtAADC1, and the corresponding mutant enzymes PtAAS1 (F338Y) and PtAADC1 (Y338F) were incubated with l-Phe in the presence of PLP. Enzyme products were analyzed using GC-MS (2-phenylacetaldehyde) and LC-MS/MS (2-phenylethylamine). B, PtAADC1 and PtAAS1 form a gene cluster on chromosome 13. Both genes are oriented in the same direction and there are no coding regions between them. Sequence data were retrieved from the P. trichocarpa Genome Assembly (version 3.0; www.phytozome.net; Tuskan et al., 2006).
Figure 5.
Figure 5.
A–E, Overexpression of PtAAS1 and PtAADC1 in N. benthamiana alters the emission of 2-phenylethanol (A) and the accumulation of 2-phenylethylamine (B), tyramine (C), tryptamine (D), and 2-phenylethanol-β-d-glucopyranoside (E). N. benthamiana plants were infiltrated with A. tumefaciens carrying either PtAAS1 or PtAADC1. At 5 d after infiltration, the headspaces of plants were collected and analyzed via GC-MS and GC-FID. Additionally, plants were harvested, extracted with methanol, and metabolite accumulation was analyzed via LC-MS/MS. Different letters above each bar indicate statistically significant differences as assessed by Kruskal-Wallis one-way analysis of variance and Tukey tests. 2-phenylethanol (H = 19.867, P ≤ 0.001); 2-phenylethylamine (H = 16.94, P ≤ 0.001); tyramine (H = 18.267, P ≤ 0.001); tryptamine (H = 18.645, P ≤ 0.001); 2-phenylethyl-β-d-glucopyranoside (H = 21.6, P ≤ 0.001). Means ± se are shown (n = 6). WT, wild type; FW, fresh weight.
Figure 6.
Figure 6.
Transcript accumulation of AAAD and SDC genes in L. dispar-damaged and undamaged P. trichocarpa leaves. Gene expression in herbivore-damaged (herb) and undamaged (ctr) leaves was analyzed by Illumina sequencing and mapping the reads to the transcripts of the P. trichocarpa Genome Assembly (version 3.0; www.phytozome.net; Tuskan et al., 2006). Expression was normalized to reads per kilo base per million mapped reads (RPKM). Significant differences in EDGE tests are visualized by asterisks. Means ± se are shown (n = 4). PtAAS1 (P = 8.23213E-12, weighted difference [WD] = 4.86618E-05); PtAAS2 (P = 0.039452261, WD = −1.11092E-05); PtAADC1 (P = 8.99025E-09, WD = 1.56932E-05); PtAADC2 (P = 0.031269756, WD = 2.02404E-06); PtAADC3 (P = 1, WD = −4.35895E-08); PtSDC1 (P = 0.576261262, WD = 1.61294E-06); PtSDC2 (P = 0.015936012, WD = 1.08813E-05).
Figure 7.
Figure 7.
RNAi-mediated knockdown of AADC1 in P. × canescens. Sterile P. × canescens calli were transformed via A. tumefaciens. Nontransgenic trees (WT, wild type), empty vector lines (EV-2-4), and RNAi lines (RNAi-1-4) were subjected to L. dispar feeding. Volatile 2-phenylethanol was collected from the headspace and analyzed using GC-MS/FID. Phenylethylamine and 2-phenylethyl-β-d-glucopyranoside were extracted with methanol from ground plant material and analyzed via LC-MS/MS. Biological replicates (nb) and technical replicates (nt) of EV lines and RNAi lines were used to test for statistical differences. Wild type, nb = 4; EV, nb = 3, nt = 5; RNAi, nb = 4, nt = 5. Asterisks indicate statistical significance as assessed by Student’s t test or Mann-Whitney Rank Sum tests. Phenylethylamine (P < 0.001, t = 7.940); 2-phenylethyl-β-d-glucopyranoside (P = 0.011, T = 547); 2-phenylethanol (P = 0.509, T = 404). Medians ± quartiles and outliers are shown. Each data point is represented by a circle. FW, fresh weight; n.s., not significant.

Comment in

References

    1. Arimura G, Huber DPW, Bohlmann J (2004) Forest tent caterpillars (Malacosoma disstria) induce local and systemic diurnal emissions of terpenoid volatiles in hybrid poplar (Populus trichocarpa × deltoides): cDNA cloning, functional characterization, and patterns of gene expression of (−)-germacrene D synthase, PtdTPS1. Plant J 37: 603–616 - PubMed
    1. Behnke K, Ehlting B, Teuber M, Bauerfeind M, Louis S, Hänsch R, Polle A, Bohlmann J, Schnitzler JP (2007) Transgenic, non-isoprene emitting poplars don’t like it hot. Plant J 51: 485–499 - PubMed
    1. Bertoldi M, Gonsalvi M, Contestabile R, Voltattorni CB (2002) Mutation of tyrosine 332 to phenylalanine converts dopa decarboxylase into a decarboxylation-dependent oxidative deaminase. J Biol Chem 277: 36357–36362 - PubMed
    1. Bieri S, Brachet A, Veuthey JL, Christen P (2006) Cocaine distribution in wild Erythroxylum species. J Ethnopharmacol 103: 439–447 - PubMed
    1. Campos L, Lisón P, López-Gresa MP, Rodrigo I, Zacarés L, Conejero V, Bellés JM (2014) Transgenic tomato plants overexpressing tyramine n-hydroxycinnamoyltransferase exhibit elevated hydroxycinnamic acid amide levels and enhanced resistance to Pseudomonas syringae. Mol Plant Microbe Interact 27: 1159–1169 - PubMed

Publication types

MeSH terms

LinkOut - more resources