. 2019 Mar 26;116(13):6298-6307.
doi: 10.1073/pnas.1812471116. Epub 2019 Mar 7.

Microenvironment tailors nTreg structure and function

Affiliations

Microenvironment tailors nTreg structure and function

Valérie Schiavon et al. Proc Natl Acad Sci U S A. .

Abstract

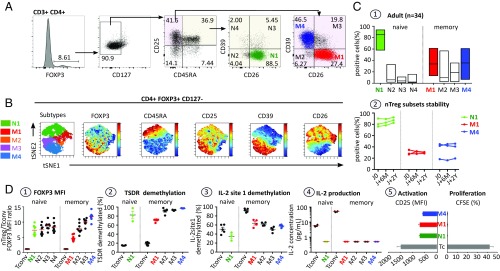
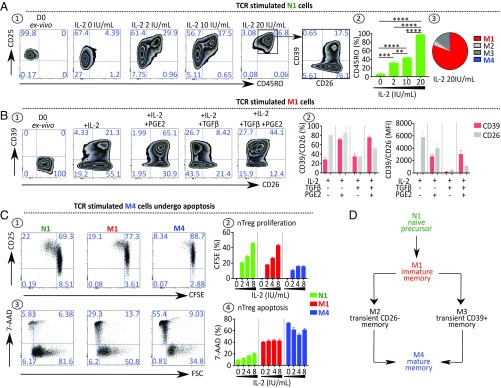
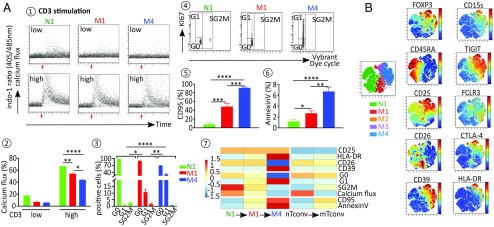
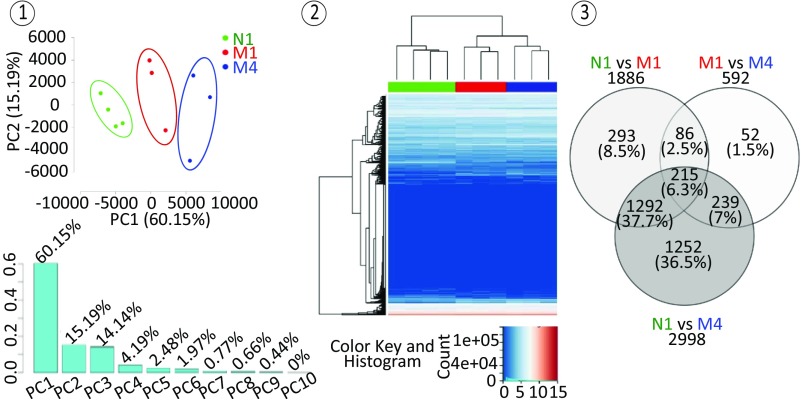
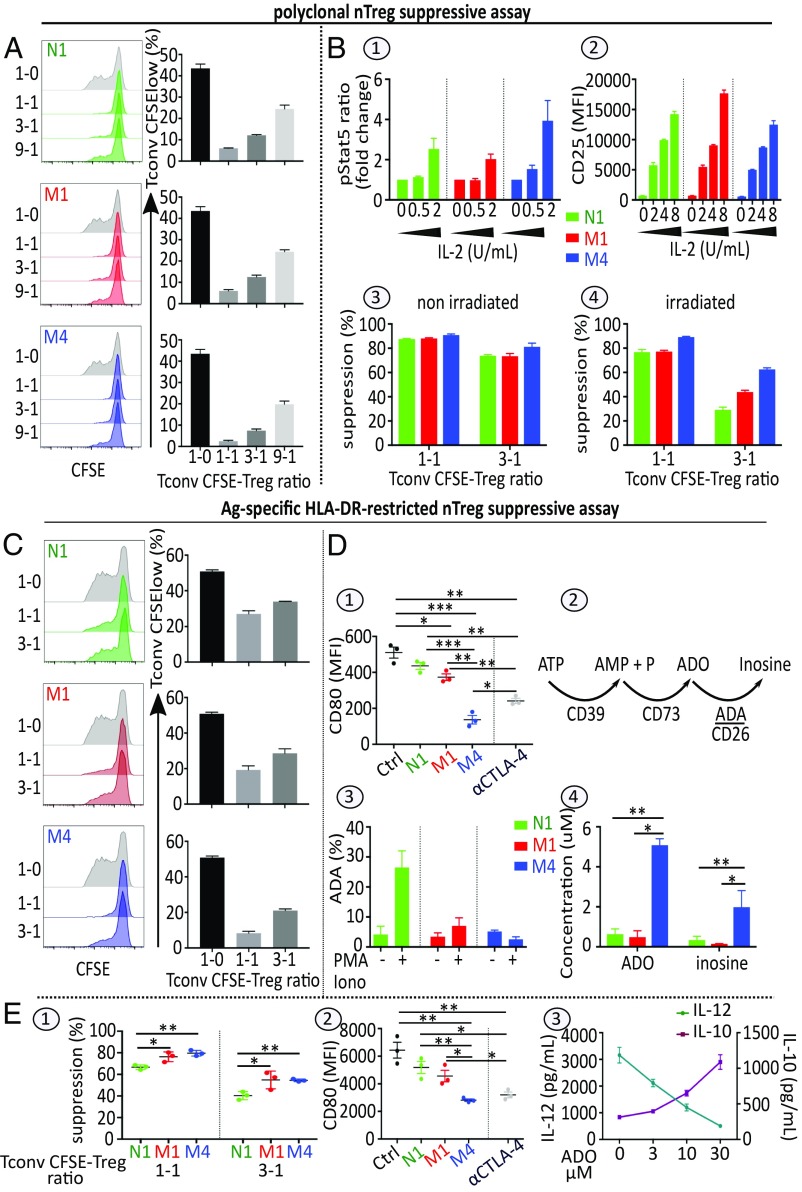
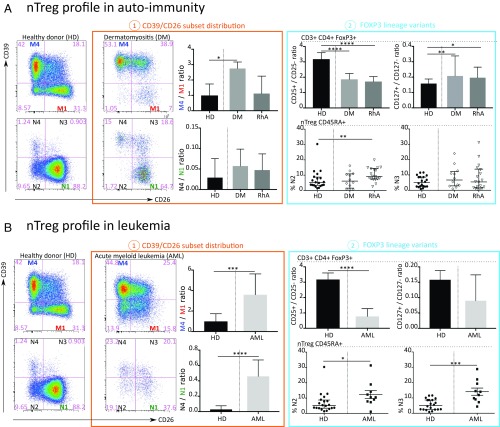
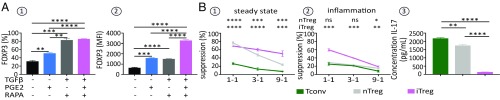
Natural regulatory T cells (nTregs) ensure the control of self-tolerance and are currently used in clinical trials to alleviate autoimmune diseases and graft-versus-host disease after hematopoietic stem cell transfer. Based on CD39/CD26 markers, blood nTreg analysis revealed the presence of five different cell subsets, each representing a distinct stage of maturation. Ex vivo added microenvironmental factors, including IL-2, TGFβ, and PGE2, direct the conversion from naive precursor to immature memory and finally from immature to mature memory cells, the latest being a no-return stage. Phenotypic and genetic characteristics of the subsets illustrate the structural parental maturation between subsets, which further correlates with the expression of regulatory factors. Regarding nTreg functional plasticity, both maturation stage and microenvironmental cytokines condition nTreg activities, which include blockade of autoreactive immune cells by cell-cell contact, Th17 and IL-10 Tr1-like activities, or activation of TCR-stimulating dendritic cell tolerization. Importantly, blood nTreg CD39/CD26 profile remained constant over a 2-y period in healthy persons but varied from person to person. Preliminary data on patients with autoimmune diseases or acute myelogenous leukemia illustrate the potential use of the nTreg CD39/CD26 profile as a blood biomarker to monitor chronic inflammatory diseases. Finally, we confirmed that naive conventional CD4 T cells, TCR-stimulated under a tolerogenic conditioned medium, could be ex vivo reprogrammed to FOXP3 lineage Tregs, and further found that these cells were exclusively committed to suppressive function under all microenvironmental contexts.

Keywords: CD39 regulatory receptor; FOXP3 regulatory transcript; adenosine deaminase-binding CD26; microenvironmental cytokines; nTregs.


Conflict of interest statement

Conflict of interest statement: D.Z. is a cofounder of Neovacs, and R.C. is an employee of eBioscience.

Figures

Fig. 1.
Fig. 1.
FOXP3 nTreg heterogeneity in healthy human PBMCs. (A) Flow cytometry gating strategy for identifying the major nTreg subsets in human PBMCs based on FOXP3, CD127, CD25, CD45RA, CD26, and CD39 markers. (B) After initial gating on the CD3+CD4+FOXP3+CD127 nTreg population, the gated cells were clustered using viSNE (Cytobank). Cells are color-coded according to the expression level of FOXP3, CD45RA, CD25, CD39, and CD26 markers. (C1) Boxplots illustrating the distribution of the four nTreg subsets based on the expression of CD39 and CD26 in naive and memory nTreg compartments. (C2) Longitudinal analysis of nTreg subset frequencies in three individuals for a >2-y period. (D) Phenotypic, epigenetic, and physiological characteristics of FACS-sorted nTreg subsets. (D1) Summary plot of the MFI ratio of FOXP3 expression on Treg subsets to Tconvs. (D2 and D3) Scatterplot indicating FOXP3-TSDR (D2) and IL-2 CpG site 1 demethylation status (D3) of the five major FACS-sorted nTreg subsets (N1, M1–M4) and the two conventional T cells (naive and memory) as assessed by bisulfite pyrosequencing. Carboxyfluorescein succinimidyl ester (CFSE)-labeled nTreg subsets (N1, M1, and M4) and Tconvs (4 × 10⁴ per well) were stimulated with a low dose of plate-bound anti-CD3 mAb (pbαCD3; 0.5 µg/mL) in the presence of irradiated feeder. (D4) IL-2 concentration in culture supernatant from 40 h-stimulated Tconv cells and nTreg subsets as measured by ELISA. (D5) T cell activation status and T cell proliferation were evaluated by the MFI of CD25 and the CFSE dilution assay, respectively. Data are expressed as mean ± SEM.
Fig. 2.
Fig. 2.
Microenvironmental context of TCR stimulation governs nTreg subset parental maturation. (A) N1 cells convert into M1 cells after ex vivo stimulation. (A1) Representative dot plots showing expression of CD25, CD45RO, CD26, and CD39 by N1 cells stimulated for 4 d, as described in Fig. 1 D5, with increasing doses of IL-2. (A2) Histograms indicating the percentage of CD45RO expressed by stimulated N1 cells (n = 3). (A3) Pie chart indicating the frequency of each memory nTreg subset in the 4-d culture of N1 cells stimulated with 20 IU/mL IL-2 (n = 4). (B) M1 cells convert into M4 cells ex vivo when stimulated as above in the presence of IL-2, TGFβ, and PGE2. (B1) Representative dot plots showing CD26 and CD39 expression by M1 cells stimulated in the presence of IL-2 with or without PGE2 (1 μM) and with or without TGFβ (5 ng/mL). (B2) Histograms indicating the percentage of stimulated M1 cells expressing CD26 and CD39 and their MFI (n = 3). (C) M4 cells represent a no-return differentiation stage. CFSE-labeled nTreg subsets were stimulated as indicated above. (C1) Representative dot plots depicting CD25 expression and CFSE dilution of 4-d cultured nTreg subsets. (C2) Histograms indicating the percentage of proliferating cells in stimulated cell cultures (n = 4). (C3 and C4) Representative dot plots (C3) and histograms (C4) showing the percentage of 7-AAD+ stimulated nTreg subsets (n = 4). (D) Diagram of the parental maturation process of the nTreg population. Data are expressed as mean ± SEM. **P < 0.01; ***P < 0.001; ****P < 0.0001.
Fig. 3.
Fig. 3.
Expressions of regulatory markers are correlated with nTreg cell cycle evolution. (A) Flow cytometry analysis of biological characteristics of nTreg subsets. Calcium mobilization induced in nTreg subsets after TCR stimulation with either low (0.5 µg/mL) or high (5 µg/mL) dose of anti-CD3 Ab was measured as the ratio of indo violet to indo blue. (A1 and A2) Representative dot plot (A1) and mean ± SEM (A2) of the percentage of responding cells in each nTreg subset. (A3 and A4) nTreg subset cell cycle status (G0/G1/SG2M) as assessed by the costaining of KI-67 and DNA. Mean ± SEM (A3) and representative dot plots (A4). (A5 and A6) Expression of CD95 (A5) and Annexin V (A6) in each nTreg subset expressed as mean % ± SEM. (A7) Heatmap representation of the foregoing data. The columns represent the cell subsets N1, M1, M4, nTconv, and mTconv. The color of each row represents the fold change of the expression of the marker compared with the mean expression level; the degree of change is shown in the scale. (B) After initial gating on the CD3+CD4+FOXP3+CD127 nTreg population, the gated cells were clustered using viSNE. Cells are color-coded according to the expression levels of FOXP3, CD45RA, CD25, CD39, CD26, CD15s, TIGIT, FCLR3, CTLA4, and HLA-DR markers. *P < 0.05; **P < 0.01; ***P < 0.001; ****P < 0.0001.
Fig. 4.
Fig. 4.
RNA sequencing analysis confirmed both nTreg subset heterogeneity and parental maturation. N1, M1, and M4 nTreg populations show distinct transcriptomic profiles. (1) Principal component analysis performed on whole transcriptome data of 10 nTreg samples obtained by RNA sequencing experiments including 25,313 genes in TPM. (2) A 2D heatmap representation of unsupervised hierarchical clustering of nTreg whole transcriptome data using log2-transformed TPM data. N1, M1, and M4 samples are labeled in green, red, and blue, respectively. (3) Venn diagram of differentially expressed genes with a greater than twofold change (Benjamini–Hochberg-adjusted P < 0.05) among N1, M1, and M4 nTreg populations.
Fig. 5.
Fig. 5.
Microenvironmental context of TCR stimulation conditions nTreg regulatory activity. (A) nTreg subsets suppressive activity using the standard suppressive assay. 4 × 10⁴ CFSE-labeled Tconvs (TconvCFSE) stimulated as indicated in Fig. 1 D5 were cocultured with nTreg subsets N1, M1, or M4 at different ratios. Proliferation of TconvCFSE was evaluated by the CFSE dilution assay. Representative FACS histograms and mean ± SEM in percentage of TconvCFSE low are shown. (B) Role of IL-2 in nTreg subset suppressive signaling pathways. (B1) pSTAT5 responses in nTreg subsets stimulated with the indicated amount of IL-2 for 15 min. Mean ± SEM of pSTAT5 ratio (MFI at 15 min/MFI at baseline) is shown (n = 3). (B2) CD25 expression in nTreg subsets stimulated as indicated in Fig. 1 D5 in the presence of various amounts of IL-2 for 4 d. Mean ± SEM of MFI values for CD25 are indicated. (B3 and B4) CD3-stimulated nTreg subsets were irradiated. Untreated (B3) and treated (B4) nTregs were then cocultured with Tconv CFSE stimulated as described in Fig. 5A. Mean ± SEM of percentages of suppression are shown (n = 3). (C) nTreg subset suppressive activity following HLA-DR–specific DC stimulation. nTreg N1, M1, or M4 subsets stimulated by iDCs were cocultured with preactivated TconvCFSE at different ratios. The proliferation of TconvCFSE was evaluated by a CFSE dilution assay. Representative FACS histograms and mean ± SEM percentage of Tconv CFSE low are shown. (D) Roles of CTLA-4 and ADO in the DC-nTreg subset interplay. (D1) CD80 expression levels on iDCs cultured in the absence [control (Ctrl)] or presence of either IL-2/CD3/CD28–prestimulated nTreg subsets or αCTLA4 Ab 5 μg/mL. Mean ± SEM MFI values for CD80 are shown (n = 3). (D2) Schema of pericellular ATP metabolism. (D3) FACS analysis of ADA expression in nTreg subsets before and after stimulation with PMA/IONO; mean ± SEM percentage of ADA are shown (n = 3). (D4) ADO and inosine production by the three nTreg subsets incubated in the presence of exogenous ATP. Stimulated nTreg subsets were incubated with exogenous ATP (100 μM) for 120 min as described in SI Appendix, Materials and Methods. Mean ± SEM adenosine and inosine levels in supernatant, measured by ultra-high-performance liquid chromatography-coupled high-resolution mass spectrometry are shown. (E1) Suppressive activity of nTregs assessed in mDC-stimulated nTreg-Tconv CFSE cocultures. Mean ± SEM percentage of suppression are shown (n = 3). (E2) CD80 expression on iDCs induced to undergo maturation with LPS in the absence (Ctrl) or presence of either nTreg subsets or 5 μg/mL mAb αCTLA4 for 24 h. Mean ± SEM MFI values for CD80 are shown (n = 3). (E3) Amounts of IL-12 (Left, dark green) and IL-10 (Right, dark pink) in 2-d culture supernatants of mDCs stimulated with different concentrations of ADO measured by ELISA. Mean ± SEM of the cytokine concentrations are shown (n = 3). *P < 0.05; **P < 0.01; ***P < 0.001.
Fig. 6.
Fig. 6.
Distribution of blood FOXP3+ subpopulations is modified in autoimmunity and cancer. (A) Autoimmunity. (A1) Representative flow cytometry dot plots of CD39/CD26 major subsets and histograms of memory M4/M1 and naive N4/N1 frequency ratio. (A2) FOXP3 lineage variants in nTreg in healthy donors (HDs) compared with DM and RhA. (B) AML. (B1) Representative flow cytometry dot plots of CD39/CD26 major subsets and histograms of memory M4/M1 and naive N4/N1 frequency ratio. (B2) FOXP3 lineage variants in nTreg in HDs compared with AML. Data in histograms and scatterplots are presented as median (interquartile range) in HDs (n = 20) compared with patients with DM (n = 12), RhA (n = 18), and AML (n = 10). P values were calculated using the Wilcoxon Mann-Whitney U test. P values < 0.05 were considered significant. *P < 0.05; **P < 0.01; ***P < 0.001; ****P < 0.0001. The initial CD3+CD4+ FOXP3+ was derived from a lymphocyte gate (defined on forward and side scatter) followed by single-cell discrimination, dead cell exclusion dye, and exclusion of iNKT and γδ T cells.
Fig. 7.
Fig. 7.
The tolerogenic microenvironment dictates the ex vivo induction of FOXP3 iTregs by CD4-naive TH0 cells transdetermination. (A) Analysis of FOXP3+ expression in iTregs generated ex vivo from polyclonally stimulated naive CD4+ T cells with different nTreg polarizing media. Naive CD4+ T cells were stimulated for 12 d with plate-bound anti-CD3 (4 µg/mL) in the presence of IL-2 (100 IU/mL). Where indicated, TGFβ (5 ng/mL), rapa (10 nM), and PGE2 (1 µM) were added. (A1 and A2) Frequency (A1) and expression level (evaluated by MFI) (A2) of FOXP3 in CD4+ T cell culture. (B) Ex vivo suppressive capacity of human Tregs generated with the polarizing medium containing TGFβ (5 ng/mL), rapa (10 nM), and PGE2 (1 µM). (B1 and B2) The suppressive capacity of ex vivo-generated Tregs was evaluated in quiescent (B1) and inflammatory (B2) conditions with the standard polyclonal nTreg assay. CFSE-labeled Tconvs were cocultured with ex vivo-generated Tregs at different ratios. The percent inhibition of TconvCFSE proliferation by Tregs is depicted. Fresh nTregs and Tconvs served as controls. (B3) IL-17 production by ex vivo-generated iTregs measured in supernatant culture by ELISA. **P < 0.01; ***P < 0.001; ****P < 0.0001.

References

    1. Murphy KM, Weaver CT. Janeway’s Immunobiology. 9th Ed Garland Science; New York: 2016.
    1. Sakaguchi S, Sakaguchi N, Asano M, Itoh M, Toda M. Immunologic self-tolerance maintained by activated T cells expressing IL-2 receptor alpha-chains (CD25): Breakdown of a single mechanism of self-tolerance causes various autoimmune diseases. J Immunol. 1995;155:1151–1164. - PubMed
    1. Sakaguchi S. Naturally arising Foxp3-expressing CD25+CD4+ regulatory T cells in immunological tolerance to self and non-self. Nat Immunol. 2005;6:345–352. - PubMed
    1. Gershon RK, Cohen P, Hencin R, Liebhaber SA. Suppressor T cells. J Immunol. 1972;108:586–590. - PubMed
    1. Groux H, et al. A CD4+ T-cell subset inhibits antigen-specific T-cell responses and prevents colitis. Nature. 1997;389:737–742. - PubMed

Publication types

MeSH terms