. 2019 Mar 26;116(13):6081-6090.
doi: 10.1073/pnas.1819851116. Epub 2019 Mar 7.

Global analysis of methionine oxidation provides a census of folding stabilities for the human proteome

Affiliations

Global analysis of methionine oxidation provides a census of folding stabilities for the human proteome

Ethan J Walker et al. Proc Natl Acad Sci U S A. .

Abstract

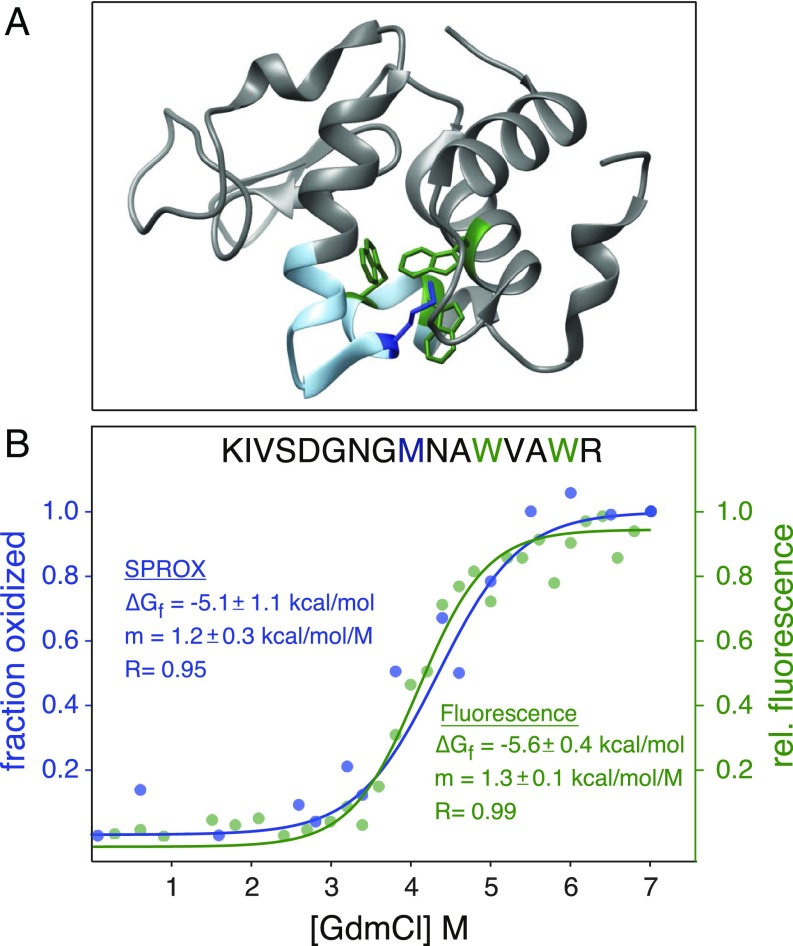
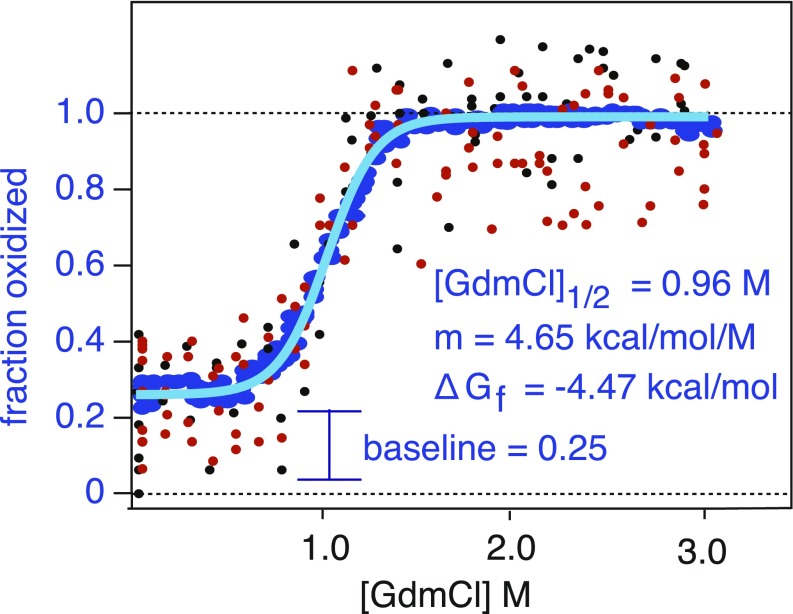
The stability of proteins influences their tendency to aggregate, undergo degradation, or become modified in cells. Despite their significance to understanding protein folding and function, quantitative analyses of thermodynamic stabilities have been mostly limited to soluble proteins in purified systems. We have used a highly multiplexed proteomics approach, based on analyses of methionine oxidation rates, to quantify stabilities of ∼10,000 unique regions within ∼3,000 proteins in human cell extracts. The data identify lysosomal and extracellular proteins as the most stable ontological subsets of the proteome. We show that the stability of proteins impacts their tendency to become oxidized and is globally altered by the osmolyte trimethylamine N-oxide (TMAO). We also show that most proteins designated as intrinsically disordered retain their unfolded structure in the complex environment of the cell. Together, the data provide a census of the stability of the human proteome and validate a methodology for global quantitation of folding thermodynamics.

Keywords: intrinsically disordered proteins; methionine oxidation; osmolytes; protein folding; protein stability.


Conflict of interest statement

The authors declare no conflict of interest.

Figures

Fig. 1.
Fig. 1.
HR-SPROX as a tool for measuring protein stability. (A) Theoretical basis of HR-SPROX. Methionine residues (white squares) are oxidized by H2O2 to form methionine sulfoxides (red squares). Methionine oxidation rates differ between folded and unfolded states. Thus, protein denaturation can be quantified by measuring the extent of oxidation across different denaturant concentrations at a constant oxidation time (dashed line). The resulting denaturation curves can be used to measure four types of information (numbered 1–4): baseline oxidation, midpoint of denaturation ([denaturant]1/2), m value, and free energy of folding (ΔGfolding or ΔGf). For two-state proteins, the latter two parameters can be determined by fitting the denaturation curve to an equation derived from the linear extrapolation model (LEM) as described in the text. (B) HR-SPROX workflow. Cells are lysed under native conditions, and folded proteins (black ovals) are unfolded with increasing concentrations of GdmCl. Methionines are converted to methionine sulfoxides (red squares) by addition of H2O2. A control experiment lacking H2O2 is included and used as a normalization point. Extracts are digested into peptides, and each sample (corresponding to a different denaturant concentration) is labeled with a unique tandem mass tag (TMT) and subsequently combined and analyzed by LC-MS/MS. Reporter ion intensities at the MS2 level are internally normalized to create denaturation curves, monitoring either the increase in methionine sulfoxide-containing peptides or the decrease in unoxidized methionine-containing peptides.
Fig. 2.
Fig. 2.
Validation of HR-SPROX by analysis of purified lysozyme. (A) The structure of hen lysozyme (1DPX). Buried tryptophan residues analyzed by fluorescence are colored in green, and the buried methionine residue analyzed by SPROX is colored in blue. (B) Denaturation curves obtained by intrinsic fluorescence (green) and SPROX (blue). The data were fit with Eq. 1 to determine ∆Gfolding and m values.
Fig. 3.
Fig. 3.
Example data for proteome-wide HR-SPROX analysis. Example HR-SPROX data for a protected methionine within a tryptic peptide (EAFDEVDMAHR) in ADP ribosylhydrolase. By combining a number of replicate measurements, detailed denaturation curves were obtained. Small black and red points indicate data obtained from methionine and methionine sulfoxide-containing peptides, respectively. The plots were smoothed by obtaining moving averages of the data (blue points) and fit by a two-state model (light blue line) to determine ΔGfolding, m values, [GdmCl]1/2, and baseline oxidation values.
Fig. 4.
Fig. 4.
Global analysis of methionine baseline oxidation. (A) The distribution of fractional methionine baseline oxidation levels within the analyzed proteome. Note that, due to experimental noise, it is possible for +H2O2/0 M GdmCl reporter ions to have a higher intensity than +H2O2/3 M GdmCl reporter ions, resulting in measured oxidation levels greater than 1. (B) Relative baseline oxidation levels of peptides with different methionine-neighboring residues. The columns are rank-ordered from low to high oxidation levels using the median value of the six relative positions. The most hydrophobic residues are highlighted in blue. Note that because the data consist of tryptic peptides, sequences having lysine and arginine residues on the N-side of methionines are rare and not included in the analysis. (CF) Comparison of baseline oxidation levels of methionines contained within different DSSP secondary-structure elements (C), having different SASAs (D), having different disordered designations in accordance with MobiDB (E), and contained within proteins mapped to different GO terms (F). For all box plots, the medians are represented by yellow lines, and blue boxes denote interquartile ranges. The distributions being compared in box plots significantly differ from one another with values of P < 0.001 using the Mann–Whitney U test, with the exception of those grouped together under bars labeled “N.S.” The histograms indicate the distributions of selected categories. Cross-hatching indicates overlapping bars.
Fig. 5.
Fig. 5.
Global analysis of thermodynamic folding parameters. (A) Quantified methionine-containing peptides were separated into one of three categories based on the observed characteristics of their denaturation curves: solvent-exposed methionines (baseline oxidation, >0.5), protected two-state proteins (baseline oxidation, <0.5; goodness-of-fit r2 to two-state model, >0.9), and protected non-two-state proteins (baseline oxidation, <0.5; r2 < 0.9). The scatter plots show averaged denaturation curves for example peptides in each category. The peptide used as an example of an exposed methionine is the MICAL oxidation site on actin, as discussed in text. The pie chart indicates the number of peptides and proteins in each category. (B) Distributions of [GdmCl]1/2, m values, and ∆Gfolding measurements for two-state peptides. (C and D) Distributions of [GdmCl]1/2 and ΔGfolding measurements for example GO terms enriched in stable or unstable methionine-containing peptides. (E) The relationship between protein stability (∆Gfolding) and baseline methionine oxidation levels. See Fig. 4 for description of box and bar plots.
Fig. 6.
Fig. 6.
Interdomain and intradomain comparisons of thermodynamic folding parameters. (A) Talin is presented as an example of an analyzed multidomain protein. The depicted structure is a composite of available structures for individual domains. The color coding indicates “weak” (blue), “intermediate” (pink), and “strong” (red) mechanical stabilities designated by Haining et al. (46) based on unfolding force magnitudes of domains in smAFM and steered molecular-dynamics studies. Denaturation curves represent exposed (red) or protected (blue) methionine-containing peptides in different domains. For protected methionines, fractional oxidation measurements were normalized with respect to the native and denatured baselines. The reported ΔGfolding is the median of all protected methionines. The Inset numbers indicate the number of peptide denaturation curves contained within plots for each domain. (BD) Global analysis of intradomain variation in measured folding parameters. Using boundaries defined by the Pfam database, [GdmCl]1/2 (B), ΔGfolding (C), and m values (D) were assigned to specific domains. Measurements within 221 domains that contained more than one methionine were rank ordered based on their median values. Peptide measurements mapped to a given domain are plotted on the y axis for each rank-ordered domain represented on the x axis. (E) The distributions of coefficients of variation (CVs) of [GdmCl]1/2, ΔGfolding, and m-value measurements for different peptides within individual domains (intradomain variation, blue box plots), within individual proteins (intraprotein variation, orange box plots), and CV of the measurements in the entire dataset (intraproteome variation, black lines). See Fig. 4 for description of box plots.
Fig. 7.
Fig. 7.
The effect of the chemical chaperone TMAO on proteome stability. (A) The effects of TMAO on denaturation curves of three example peptides mapped to different proteins. The data indicate that TMAO has variable effects on baseline oxidation levels and stabilities of different protein regions. (B) The distribution of relative methionine baseline oxidation levels within the analyzed proteome in the absence (blue lines, reproduced from Fig. 4) and presence of 1 M TMAO (orange bars). (C) Impact of TMAO on baseline oxidation levels of exposed and protected proteins with different stabilities. (DF) Impact of TMAO on distributions of [GdmCl]1/2 (D), m values (E), and ΔGfolding (F). The distributions of the measurements are compared in the absence (blue lines, reproduced from Fig. 5) and presence of 1 M TMAO (orange bars). See Fig. 4 for description of box plots.

References

    1. Henzler-Wildman K, Kern D. Dynamic personalities of proteins. Nature. 2007;450:964–972. - PubMed
    1. Bryngelson JD, Onuchic JN, Socci ND, Wolynes PG. Funnels, pathways, and the energy landscape of protein folding: A synthesis. Proteins. 1995;21:167–195. - PubMed
    1. Schellman JA. The thermodynamic stability of proteins. Annu Rev Biophys Biophys Chem. 1987;16:115–137. - PubMed
    1. Berlett BS, Stadtman ER. Protein oxidation in aging, disease, and oxidative stress. J Biol Chem. 1997;272:20313–20316. - PubMed
    1. Redler RL, Das J, Diaz JR, Dokholyan NV. Protein destabilization as a common factor in diverse inherited disorders. J Mol Evol. 2016;82:11–16. - PMC - PubMed

Publication types