. 2019 Apr;30(4):533-545.
doi: 10.1681/ASN.2018090896. Epub 2019 Mar 7.

Single-Cell RNA Profiling of Glomerular Cells Shows Dynamic Changes in Experimental Diabetic Kidney Disease

Affiliations

Single-Cell RNA Profiling of Glomerular Cells Shows Dynamic Changes in Experimental Diabetic Kidney Disease

Jia Fu et al. J Am Soc Nephrol. 2019 Apr.

Abstract

Background: Recent single-cell RNA sequencing (scRNA-seq) analyses have offered much insight into cell-specific gene expression profiles in normal kidneys. However, in diseased kidneys, understanding of changes in specific cells, particularly glomerular cells, remains limited.

Methods: To elucidate the glomerular cell-specific gene expression changes in diabetic kidney disease, we performed scRNA-seq analysis of isolated glomerular cells from streptozotocin-induced diabetic endothelial nitric oxide synthase (eNOS)-deficient (eNOS-/-) mice and control eNOS-/- mice.

Results: We identified five distinct cell populations, including glomerular endothelial cells, mesangial cells, podocytes, immune cells, and tubular cells. Using scRNA-seq analysis, we confirmed the expression of glomerular cell-specific markers and also identified several new potential markers of glomerular cells. The number of immune cells was significantly higher in diabetic glomeruli compared with control glomeruli, and further cluster analysis showed that these immune cells were predominantly macrophages. Analysis of differential gene expression in endothelial and mesangial cells of diabetic and control mice showed dynamic changes in the pattern of expressed genes, many of which are known to be involved in diabetic kidney disease. Moreover, gene expression analysis showed variable responses of individual cells to diabetic injury.

Conclusions: Our findings demonstrate the ability of scRNA-seq analysis in isolated glomerular cells from diabetic and control mice to reveal dynamic changes in gene expression in diabetic kidneys, with variable responses of individual cells. Such changes, which might not be apparent in bulk transcriptomic analysis of glomerular cells, may help identify important pathophysiologic factors contributing to the progression of diabetic kidney disease.

Keywords: diabetic nephropathy; glomerular endothelial cells; glomerulus; macrophages; mesangial cells; transcriptional profiling.


Figures

None
Graphical abstract
Figure 1.
Figure 1.
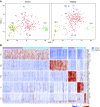
scRNA-seq analysis of mouse control and diabetic glomeruli identified distinct cells types. (A) t-distributed stochastic neighbor embedding (tSNE) analysis of glomerular cells shows five distinct clusters of glomerular cells in control (left) and diabetic (right) mice. (B) Heatmap of top ten DEGs across five cell clusters. Individual cells from diabetic (purple blocks) and control (blue blocks) mice are shown in columns and top 10 genes in rows. Color scheme represents the z-score distribution from −2.0 (blue) to 2.0 (red). EC, endothelial cells; IC, immune cells; MC, mesangial cells; Pod, podocytes; TC, tubular cells.
Figure 2.
Figure 2.
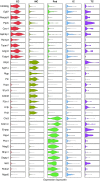
scRNA-seq identified genes specifically expressed in EC, MC and Pod. The violin plot for each gene shows the distribution and relative expression across cell types for ten potential new marker genes for endothelial cells (EC), mesangial cells (MC), and podocytes (Pod). IC, immune cells; TC, tubular cells.
Figure 3.
Figure 3.
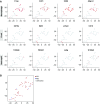
Macrophages are the predominant immune cell types in the glomeruli of diabetic mice. (A) t-distributed stochastic neighbor embedding (t-SNE) analysis showing the expression levels of four individual marker genes of macrophages, B cells, and neutrophils in the immune cell cluster of diabetic mice. Red indicates high expression and gray indicates no expression. (B) t-SNE plot of immune cell clustering of three groups: M1 phenotype (red), M2 phenotype (blue), and unknown (gray), according to reported macrophage marker genes.
Figure 4.
Figure 4.
Differential gene expression analysis reveal altered pathways in endothelial and mesangial cells in diabetic mice. (A and B) Gene ontology (GO) terms of DEGs in (A) diabetic mouse glomerular endothelial cells versus control endothelial cells and (B) diabetic mesangial cells versus control mesangial cells. Significance is expressed as a P value calculated using the Fisher exact test (P<0.05) and shown as −log10 (P value).
Figure 5.
Figure 5.
Pseudotime analysis of gene expression show dynamic changes in endothelial and mesangial cells in diabetic mice. (A and B) Cell trajectories of (A) GECs and (B) mesangial cells. Each point corresponds to a cell and its location indicates the cell’s stage in control-to-DM transition. Cells from the control sample are colored in blue; cells from the DM samples are colored in red; trajectory curve is colored in gray. (C and D) Heatmap of top 1000 genes that are significantly changed in control-to-DM transition in pseudotime in (C) endothelial and (D) mesangial cells. Each row represents a gene, where the left end corresponds to the transition starting point (control) and the right end corresponds to transition ending point (DM). Color scheme represents the z-score distribution from −3.0 (blue) to 3.0 (red). Genes that covary across transition are clustered into six blocks.
Figure 6.
Figure 6.
scRNA-seq analysis show single-cell expression of known genes altered in DKD. Y axis represents the expression of each gene in log scale and each bar represents an individual cell from control (purple block) or diabetic mice (blue block), separated according to cell type. EC, endothelial cells; MC, mesangial cells; Pod, podocyte; IC, immune cells; TC, tubular cells.

Comment in

References

    1. Hodgin JB, Nair V, Zhang H, Randolph A, Harris RC, Nelson RG, et al. .: Identification of cross-species shared transcriptional networks of diabetic nephropathy in human and mouse glomeruli. Diabetes 62: 299–308, 2013 - PMC - PubMed
    1. Woroniecka KI, Park AS, Mohtat D, Thomas DB, Pullman JM, Susztak K: Transcriptome analysis of human diabetic kidney disease. Diabetes 60: 2354–2369, 2011 - PMC - PubMed
    1. Fu J, Wei C, Lee K, Zhang W, He W, Chuang P, et al. .: Comparison of glomerular and podocyte mRNA profiles in streptozotocin-induced diabetes. J Am Soc Nephrol 27: 1006–1014, 2016 - PMC - PubMed
    1. Fu J, Wei C, Zhang W, Schlondorff D, Wu J, Cai M, et al. .: Gene expression profiles of glomerular endothelial cells support their role in the glomerulopathy of diabetic mice. Kidney Int 94: 326–345, 2018 - PMC - PubMed
    1. Wang Y, Navin NE: Advances and applications of single-cell sequencing technologies. Mol Cell 58: 598–609, 2015 - PMC - PubMed

Publication types

Substances