. 2019 Apr 19;294(16):6204-6213.
doi: 10.1074/jbc.RA119.007905. Epub 2019 Mar 7.

The NifZ accessory protein has an equivalent function in maturation of both nitrogenase MoFe protein P-clusters

Affiliations

The NifZ accessory protein has an equivalent function in maturation of both nitrogenase MoFe protein P-clusters

Emilio Jimenez-Vicente et al. J Biol Chem. .

Abstract

The Mo-dependent nitrogenase comprises two interacting components called the Fe protein and the MoFe protein. The MoFe protein is an α2β2 heterotetramer that harbors two types of complex metalloclusters, both of which are necessary for N2 reduction. One type is a 7Fe-9S-Mo-C-homocitrate species designated FeMo-cofactor, which provides the N2-binding catalytic site, and the other is an 8Fe-7S species designated the P-cluster, involved in mediating intercomponent electron transfer to FeMo-cofactor. The MoFe protein's catalytic partner, Fe protein, is also required for both FeMo-cofactor formation and the conversion of an immature form of P-clusters to the mature species. This latter process involves several assembly factors, NafH, NifW, and NifZ, and precedes FeMo-cofactor insertion. Here, using various protein affinity-based purification methods as well as in vivo, EPR spectroscopy, and MALDI measurements, we show that several MoFe protein species accumulate in a NifZ-deficient background of the nitrogen-fixing microbe Azotobacter vinelandii These included fully active MoFe protein replete with FeMo-cofactor and mature P-cluster, inactive MoFe protein having no FeMo-cofactor and only immature P-cluster, and partially active MoFe protein having one αβ-unit with a FeMo-cofactor and mature P-cluster and the other αβ-unit with no FeMo-cofactor and immature P-cluster. Also, NifW could associate with MoFe protein having immature P-clusters and became dissociated upon P-cluster maturation. Furthermore, both P-clusters could mature in vitro without NifZ. These findings indicate that NifZ has an equivalent, although not essential, function in the maturation of both P-clusters contained within the MoFe protein.

Keywords: Azotobacter vinelandii; FeMo-cofactor; NifW; NifZ; P-cluster; iron-sulfur protein; maturation; metalloenzyme; nitrogen fixation; nitrogen metabolism; nitrogenase.


Conflict of interest statement

The authors declare that they have no conflicts of interest with the contents of this article.

Figures

Figure 1.
Figure 1.
Schematic representation of WT molybdenum nitrogenase components and immature MoFe protein produced in ΔnifH and ΔnifB backgrounds. For simplicity, accessory proteins associated with immature forms of MoFe protein produced in NifB- or NifH-deficient backgrounds are not indicated.
Figure 2.
Figure 2.
Comparison of the “stepwise function” (A) and “equivalent function” (B) models for the participation of NifZ in P-cluster maturation. In the stepwise function model, NifZ is not required for maturation of the “first” P-cluster but is required for the maturation of the “second” P-cluster. In the equivalent function model, NifZ participates in the formation of both P-clusters but is not required for maturation of either one. The equivalent function model also incorporates the finding in the present work that one NifW can bind to each MoFe protein αβ-unit harboring an immature P-cluster and dissociates upon P-cluster maturation.
Figure 3.
Figure 3.
X-band EPR spectra of resting state Strep-tagged MoFe proteins purified from different A. vinelandii strains. All samples are Na2S2O4-reduced. EPR conditions are described in detail under “Experimental procedures.” The S = 32 EPR signature characteristic of FeMo-cofactor (g = 4.32, 3.64, 2.01) and the S = ½ signature associated with immature P-cluster appearing as two electronic isomers having similar g-values (g = 2.03, 1.93, and 1.86 and g = 2.06, 1.93, and 1.89) are indicated. All spectra were normalized to a final MoFe protein concentration of 43.5 μm. A minor immature P-cluster species, indicated by red arrows, is evident in the MoFe proteinStrΔB spectrum, and a minor FeMo-cofactor species, indicated by green arrows, is evident in the MoFe proteinStrΔH spectrum. The origin of these signals has been reported previously (9, 13, 20).
Figure 4.
Figure 4.
Growth and in vivo nitrogenase activities. A, growth of A. vinelandii WT (DJ2102) and ΔnifZ mutants (DJ2111 and DJ1182) using N2 as a sole source of nitrogen; B, time course of in vivo nitrogenase activity determined by whole-cell acetylene reduction assays as described under “Experimental procedures.” Cells were shifted from growth using 10 mm urea as the nitrogen source to media containing no fixed nitrogen at time 0. Activities shown on the y axis of B indicate nmol of ethylene·min−1·A600−1. Error bars, S.D.
Figure 5.
Figure 5.
Separation of nitrogenase species accumulated in NifZ-deficient cells. A, anion-exchange chromatographic profile of MoFe proteinHisΔZ previously isolated using IMAC (red trace) and ion-exchange chromatography of MoFe proteinStrΔZ previously isolated using STAC (black trace). The x axis label indicates conductivity (mS/cm) as a relative measure of the NaCl concentration in the elution gradient. B, SDS-PAGE of peaks from anion-exchange separation of nitrogenase species from MoFe proteinHisΔZ (left) and MoFe proteinStrΔZ (right). Protein samples shown here and in other figures were separated using a 4% acrylamide stacking gel and 15% acrylamide running gel and then stained with Coomassie Brilliant Blue. Protein standards in the left lane of each gel include phosphorylase B (97.4 kDa), BSA (66.2 kDa), ovalbumin (45.0 kDa), carbonic anhydrase (31.0 kDa), soybean trypsin inhibitor (21.5 kDa), and lysozyme (14.4 kDa). The molar ratios of NifW relative to the MoFe protein α2β2 heterotetramer in lanes 2 and 3 (right) were estimated to be ∼1 and 2, respectively, based on densitometry. The small arrow on the left (lane 1) indicates enoyl-CoA hydratase, and the small arrow on the right (lane 1) indicates acetyl-CoA carboxylase α-subunit, common contaminants in IMAC and STAC purifications, respectively. The identity of all proteins indicated in the gels was determined by MS as described under “Experimental procedures.” C, acetylene reduction specific activities (nmol of ethylene produced·min−1·mg−1) of MoFe protein species contained in the initial STAC-purified sample and fractions 1, 2, and 3 from anion-exchange chromatography. The percentage of initial activity was calculated based on the total activity present in the initial STAC-purified sample loaded on the anion-exchange column and the total activity recovered in each fraction. MW, molecular weight.
Figure 6.
Figure 6.
X-band EPR spectra of MoFe proteinStrΔZ isolated by STAC and further fractionated by anion-exchange chromatography. EPR spectra were acquired from the same samples described in the legend to Fig. 5 and were normalized to a final MoFe protein concentration of 21.7 μm. Fractions 1, 2, and 3 correspond to fractions 1, 2, and 3 shown in Fig. 5A (black trace). The right panel shows an expanded view of the S = ½ signature associated with immature P-cluster present in the various samples, which appears split as two electronic isomers (g = 2.03, 1.93, and 1.86 and g = 2.06, 1.93, and 1.89) in all samples except for fraction 3, which appears to only exhibit the g = 2.03, 1.93, and 1.86 species. Note that the g = 2.06, 1.93, and 1.89 species is more dominant in fraction 1 (red trace), and the g = 2.03, 1.93, and 1.86 species is more dominant in fraction 2 (blue trace).
Figure 7.
Figure 7.
NifW-assisted fractionation of MoFe protein species produced by NifZ-deficient cells. A, anion ion-exchange chromatographic elution profile of STAC-purified MoFe proteinStrΔZ from extracts of DJ2111 cells derepressed for 4 h. For the black trace, a 32-fold excess of NifWStr was added to the sample prior to anion-exchange chromatography, and for the red trace, no NifWStr was added. The x axis indicates conductivity (mS/cm) as a relative measure of the NaCl concentration in the gradient. B, SDS-PAGE analysis of NifWStr affinity column separation of different MoFe proteinHisΔZ populations. IMAC-purified MoFe proteinHisΔZ prepared from cells derepressed for 12 h was further fractionated using anion-exchange chromatography, in the same way as shown in Fig. 5A (red trace) to obtain fraction 1 (lane 1). Fraction 1 was then passed over a NifWStr-charged Strep-Tactin column. Flow-through that is not retained on the column is shown in lane 1a. MoFe proteinHisΔZ retained on the column and subsequently eluted using biotin to release NifWStr from the Strep-Tactin matrix is shown in lane 1b. Note that the band corresponding to NifW in lane 1a represents a small amount of NifWStr that has leached off the Strep-Tactin column. Also note that the high level of NifW in lane 1b is the result of a large excess of NifWStr bound to the column relative to the amount of MoFe proteinHisΔZ applied to the column. Samples shown in B were all run on the same SDS-polyacrylamide gel. Other samples also run on the same gel but not relevant to the present work were edited out of the gel picture as indicated by the space between lanes 1 and 1a/1b. C, specific activities (nmol of ethylene produced·min−1·mg−1) and relative amounts and total activities of MoFe proteinHisΔZ present in fractions 1, 1a, and 1b. MW, molecular weight.
Figure 8.
Figure 8.
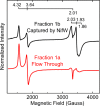
X-band EPR spectra of MoFe proteinHisΔZ populations separated by NifW affinity chromatography. The black trace is the EPR spectrum obtained from fraction 1b shown in Fig. 7B, and the red trace is the EPR spectrum of fraction 1a, also shown in Fig. 7B. Both spectra were normalized to a final MoFe protein concentration of 21.7 μm.
Figure 9.
Figure 9.
Time-dependent in vitro maturation of ΔnifZ nitrogenase in cell-free extracts. MoFe proteinStrΔZ cell-free extract prepared from DJ2111 cells derepressed for 12 h was incubated at different times (0, 30, 60, 120, and 240 min) in the presence of 36 mm Na2S2O4. A, SDS-PAGE of MoFe proteinStrΔZ purified by STAC after 0-, 30-, 60-, 120-, and 240-min incubation. B, X-band EPR spectra of MoFe proteinStrΔZ after processing the 0-min sample and the 240-min sample by anion-exchange chromatography and selecting the first elution peak (fraction 1). Both spectra were normalized to a final MoFe protein concentration of 21.7 μm. The corresponding MoFe proteinStrΔZ acetylene reduction specific activities (nmol of ethylene produced·min−1·mg−1) of those samples are indicated below the spectra. MW, molecular weight.
Figure 10.
Figure 10.
Schematic representation of theoretical MoFe protein species that could accumulate in ΔnifZ mutant cells. Fractions indicated correspond to those shown in Figs. 5 and 7.

References

    1. Kim J., and Rees D. C. (1992) Crystallographic structure and functional implications of the nitrogenase molybdenum-iron protein from Azotobacter vinelandii. Nature 360, 553–560 10.1038/360553a0 - DOI - PubMed
    1. Rees D. C., Akif Tezcan F., Haynes C. A., Walton M. Y., Andrade S., Einsle O., and Howard J. B. (2005) Structural basis of biological nitrogen fixation. Philos. Trans. A Math. Phys. Eng. Sci. 363, 971–984; discussion 1035–1040 10.1098/rsta.2004.1539 - DOI - PubMed
    1. Spatzal T., Aksoyoglu M., Zhang L., Andrade S. L. A., Schleicher E., Weber S., Rees D. C., and Einsle O. (2011) Evidence for interstitial carbon in nitrogenase FeMo cofactor. Science 334, 940 10.1126/science.1214025 - DOI - PMC - PubMed
    1. Lancaster K. M., Roemelt M., Ettenhuber P., Hu Y., Ribbe M. W., Neese F., Bergmann U., and DeBeer S. (2011) X-ray emission spectroscopy evidences a central carbon in the nitrogenase iron-molybdenum cofactor. Science 334, 974–977 10.1126/science.1206445 - DOI - PMC - PubMed
    1. Georgiadis M. M., Komiya H., Chakrabarti P., Woo D., Kornuc J. J., and Rees D. C. (1992) Crystallographic structure of the nitrogenase iron protein from Azotobacter vinelandii. Science 257, 1653–1659 10.1126/science.1529353 - DOI - PubMed

Publication types

MeSH terms

LinkOut - more resources