. 2019 Mar 8;363(6431):1093-1097.
doi: 10.1126/science.aau6313.

Stoichiometry controls activity of phase-separated clusters of actin signaling proteins

Affiliations

Stoichiometry controls activity of phase-separated clusters of actin signaling proteins

Lindsay B Case et al. Science. .

Abstract

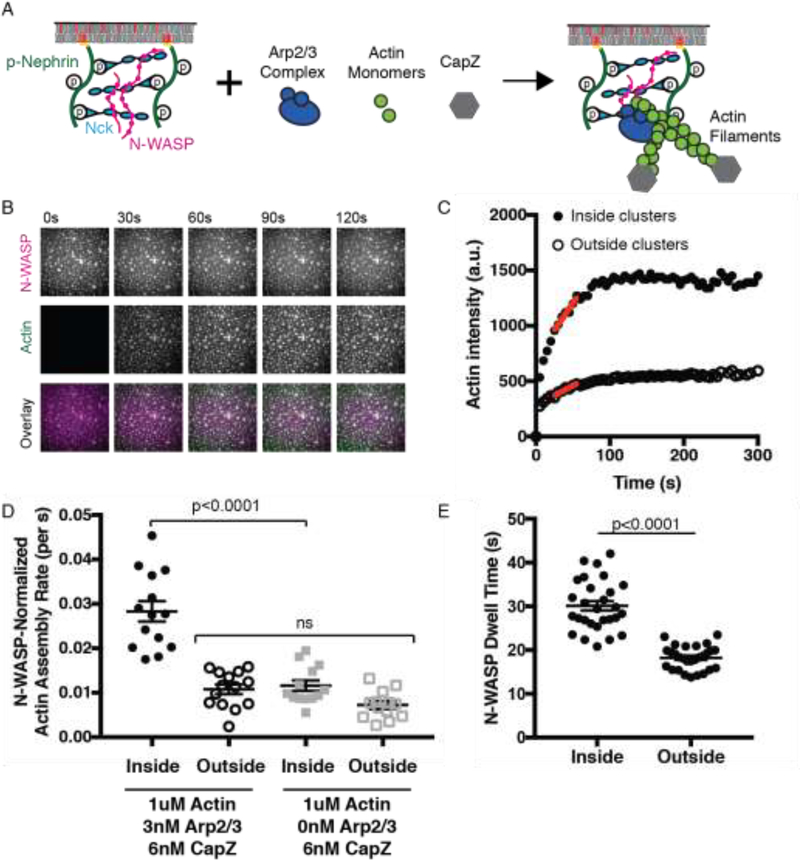
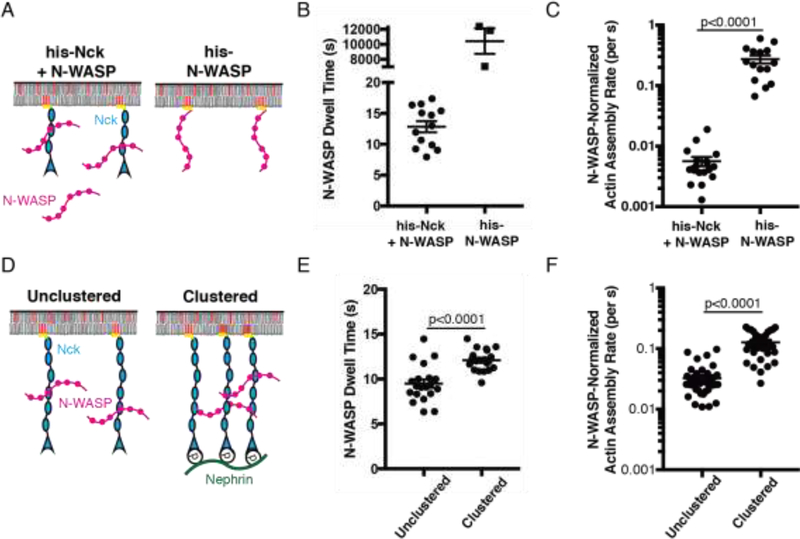
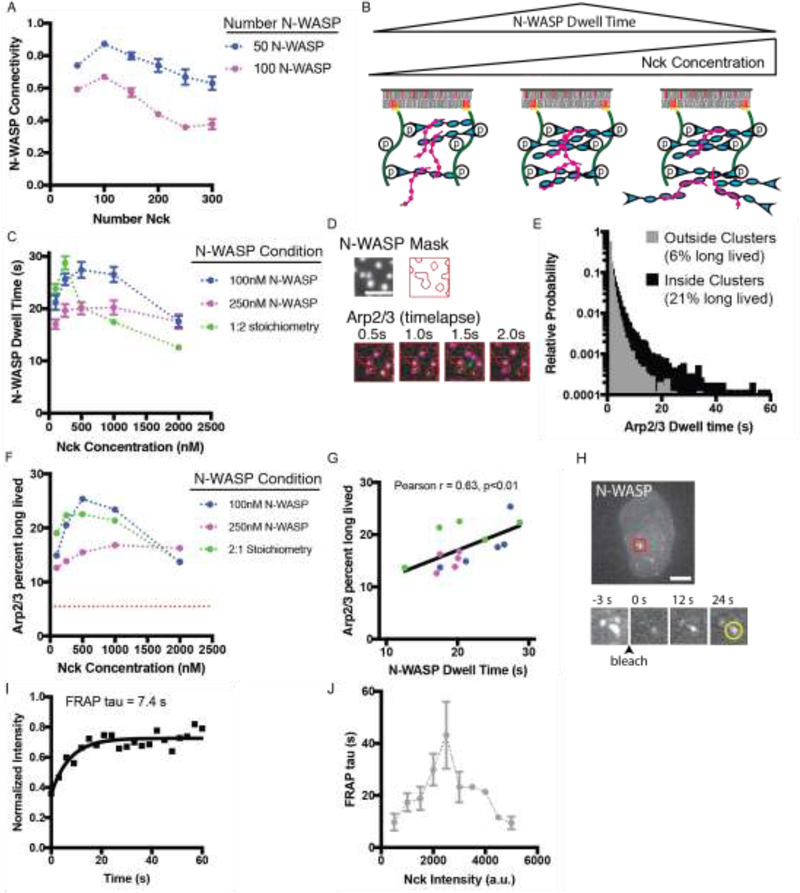
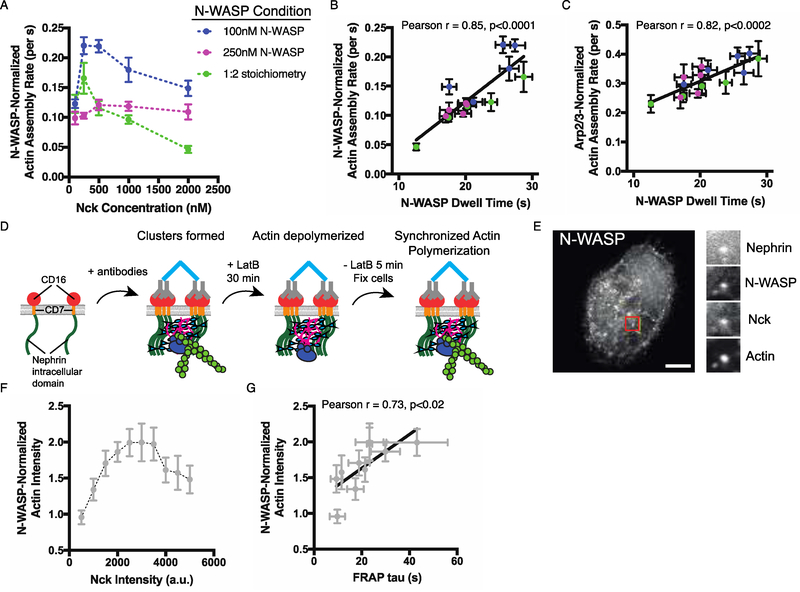
Biomolecular condensates concentrate macromolecules into foci without a surrounding membrane. Many condensates appear to form through multivalent interactions that drive liquid-liquid phase separation (LLPS). LLPS increases the specific activity of actin regulatory proteins toward actin assembly by the Arp2/3 complex. We show that this increase occurs because LLPS of the Nephrin-Nck-N-WASP signaling pathway on lipid bilayers increases membrane dwell time of N-WASP and Arp2/3 complex, consequently increasing actin assembly. Dwell time varies with relative stoichiometry of the signaling proteins in the phase-separated clusters, rendering N-WASP and Arp2/3 activity stoichiometry dependent. This mechanism of controlling protein activity is enabled by the stoichiometrically undefined nature of biomolecular condensates. Such regulation should be a general feature of signaling systems that assemble through multivalent interactions and drive nonequilibrium outputs.


Conflict of interest statement

Competing interests: The authors declare no conflicts of interest.

Figures

Fig. 1.
Fig. 1.
The specific activity of N-WASP is increased in phase separated membrane clusters. (A) Schematic of actin assembly assay. Molecules not drawn to scale. (B) Total Internal Reflection Fluorescence Microscopy (TIRF) images of N-WASP (top) and Actin (middle) during actin polymerization. Clusters were formed by adding N-WASP (1μM, 15% Alexa488 labeled) and Nck (2μM) to membrane-bound pNephrin (~1000 molecules/μm2). Actin (1 μM, 5% Alexa647 labeled), Arp2/3 complex (3 nM), and CapZ (6 nM) were added at t = 0 s. Scale bar, 5 μm. (C) Quantification of mean actin intensity inside and outside of clusters from images in (a). Red line indicates rate at half-maximal intensity. (D) Quantification of N-WASP-normalized actin assembly rate from 14 measurements containing Arp2/3 complex and 13 measurements without Arp2/3 complex. In these experiments, N-WASP is enriched ~2.2-fold inside clusters. Significance tested with one-way ANOVA followed by post hoc Tukey test. (E) Quantification of mEos2-N-WASP membrane dwell time inside and outside of clusters from n=28 measurements. Significance tested with an unpaired t-test. In D and E, points represent individual measurements, horizontal line represents mean, and error bars represent SEM.
Fig. 2.
Fig. 2.
Increasing N-WASP membrane dwell-time is sufficient to increase its specific activity. (A) Schematic of experimental setup in B-C. Molecules not drawn to scale. (B) Dwell time of mEos2-N-WASP (n=13) and his-N-WASP-Alexa488 (n=3), the latter as described in Figure S5. (C) N-WASP-normalized actin assembly rate for his-N-WASP (n=15) and his-Nck + N-WASP (n=18). (D) Schematic of experimental setup in E-F. Molecules not drawn to scale. (E) Dwell time of mEos2-N-WASP unclustered (n=20) and clustered (n=20). (F) N-WASP-normalized actin assembly rate of unclustered (n=40) and clustered (n=32) N-WASP. In all graphs, points represent individual measurements, horizontal line represents mean, error bars represent SEM, significance tested with unpaired t test. Note that data in Figures 2e-f and S6c–d are not directly comparable to those in Figure 4, as different buffer and actin concentrations were used in the different experiments. Both datasets are, however, internally comparable.
Fig. 3.
Fig. 3.
Stoichiometry regulates membrane dwell time of N-WASP and Arp2/3 complex in phase separated membrane clusters. (A) N-WASP connectivity in computational simulations. The number of pNephrin (25 molecules) and N-WASP (50 or 100; blue and magenta, respectively) molecules was kept constant and the number of Nck molecules was varied. Data points represent the mean +/− SEM from six simulations. (B) Summary of simulation predictions. Molecules not drawn to scale. (C) Experimental measurement of mEos2-N-WASP membrane dwell time. Clusters were formed by adding N-WASP (15% mEos2 labeled) and Nck at the indicated concentrations to membrane-bound pNephrin (~1000 molecules/μm2). Data points represent mean +/− SEM from at least 13 measurements. Details about number of measurements are in Table S2 (D) Representative Total Internal Reflection Fluorescence Microscopy (TIRF) images from a single particle tracking experiment. Clusters were formed by adding N-WASP (1μM, 15% Alexa488 labeled) and Nck (2 μM) to membrane-bound pNephrin (~1000 molecules/μm2). Arp2/3 complex (3 nM unlabeled, 7.5 pM Alexa647-labeled) was added prior to imaging. Top: Image of N-WASP and the mask generated from Otsu thresholding. Bottom: Arp2/3 complex images. Red lines indicate mask. Green arrow indicates a molecule localized outside of clusters. Scale bar = 5 μm. (E) Histogram of Arp2/3 complex dwell times for molecules localized inside and outside of clusters. Data from 15,042 tracks of molecules inside clusters and 24,398 tracks of molecules outside clusters. The Y-axis is set to display all bins containing at least 3 tracks. (F) Percent of long-lived Arp2/3 complexes (dwell time > 3 s) inside clusters across a range of Nephrin/Nck/N-WASP stoichiometries. Data from multiple experiments were compiled to determine the cumulative distribution from at least 1,000 tracks per condition. Red dotted line represents the percent long lived Arp2/3 complexes outside clusters (6%). Details about number of measurements are in Table S3 (G) Percent of long lived Arp2/3 complexes versus N-WASP membrane dwell time (data from C and F). Black diagonal line shows a linear fit of the data (Pearson r = 0.63, p<0.01). (H) Representative image of N-WASP-mEmearld in a U2OS cell expressing Nephrin-BFP, N-WASP-mEmerald and Nck-mCherry. Timelapse images of clusters in the region highlighted by the red box. Scale bar = 10 μm. (I) Representative quantification of FRAP analysis of the cluster indicated by the yellow circle. (J) N-WASP FRAP tau versus Nck intensity in clusters. Data collected from over 20 cells in four independent experiments. Each point represents the mean +/− SEM. Details about number of measurements are in Table S4.
Fig. 4.
Fig. 4.
Stoichiometry of pNephrin, Nck and N-WASP regulates N-WASP and Arp2/3 complex activity in phase separated membrane clusters. (A) N-WASP-normalized actin assembly rate in clusters formed by adding N-WASP (15% Alexa488 labeled) and Nck at the indicated concentrations to membrane-bound pNephrin (~1000 molecules/μm2). Each point represents the mean +/− SEM from at least 13 measurements. Details about number of measurements are in Table S5. (B) N-WASP-normalized actin assembly rate versus N-WASP membrane dwell time (data from Figs. 3c and 4a). Black diagonal line represents a linear fit of the data (Pearson r = 0.85, p<0.0001). (C) Arp2/3-normalized actin assembly rate versus N-WASP membrane dwell time (data from Figs. 3c and 4a). Black diagonal line represents a linear fit of the data (Pearson r = 0.82, p<0.0002). Note that data in Figure 4 are not quantitatively comparable to those in Figures 2e–f and S6c–d, as different buffer and actin concentrations were used in the different experiments. Both datasets are, however, internally comparable. (D) Schematic of cellular actin assembly assay. Molecules not drawn to scale. (E) LEFT: Representative image of N-WASP-mEmerald in a U2OS cell expressing Nephrin-BFP, N-WASP-mEmerald, Nck-mCherry, and stained with phalloidin-Alexa 647 to label actin filaments. RIGHT: Images of all four labeled molecules colocalized in a single cluster in the region highlighted by a red box. Scale bar = 10 μm. (F) N-WASP-normalized actin intensity versus Nck intensity in clusters containing similar intensities of Nephrin-BFP and N-WASP-mEmerald. Data collected from over 20 cells in three independent experiments. Each point represents the mean +/− SEM from measurements in at least 2 cells. Details about number of measurements are in Table S6. (G) N-WASP-normalized actin intensity versus N-WASP FRAP tau (Data from Figs 3j and 4f). Black diagonal line represents a linear fit of the data (Pearson r = 0.73, p<0.02).

Comment in

References

    1. Banani SF, Lee HO, Hyman AA, Rosen MK, Biomolecular condensates: organizers of cellular biochemistry. Nat. Rev. Mol. Cell Biol 18, 285–298 (2017). - PMC - PubMed
    1. Shin Y, Brangwynne CP, Liquid phase condensation in cell physiology and disease. Science. 357, eaaf4382 (2017). DOI: 10.1126/science.aaf4382 - DOI - PubMed
    1. Li P et al. , Phase transitions in the assembly of multivalent signalling proteins. Nature. 483, 336–340 (2012). - PMC - PubMed
    1. Banjade S, Rosen MK, Phase transitions of multivalent proteins can promote clustering of membrane receptors. Elife. 3, e04123 (2014). - PMC - PubMed
    1. Su X et al. , Phase separation of signaling molecules promotes T cell receptor signal transduction. Science. 352, 595–599 (2016). - PMC - PubMed

Publication types