. 2019 Apr 12;364(6436):184-188.
doi: 10.1126/science.aar2038. Epub 2019 Mar 7.

Evidence for hormonal control of heart regenerative capacity during endothermy acquisition

Affiliations

Evidence for hormonal control of heart regenerative capacity during endothermy acquisition

Kentaro Hirose et al. Science. .

Abstract

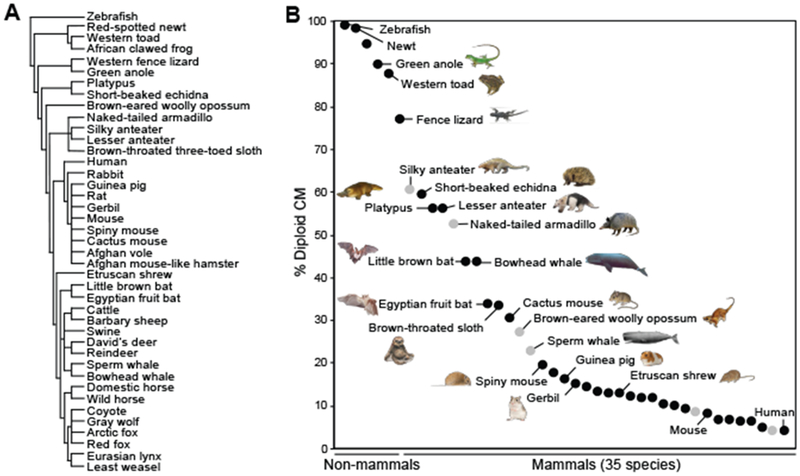
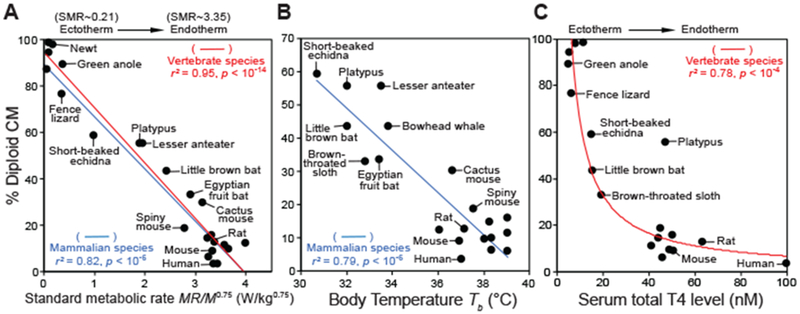
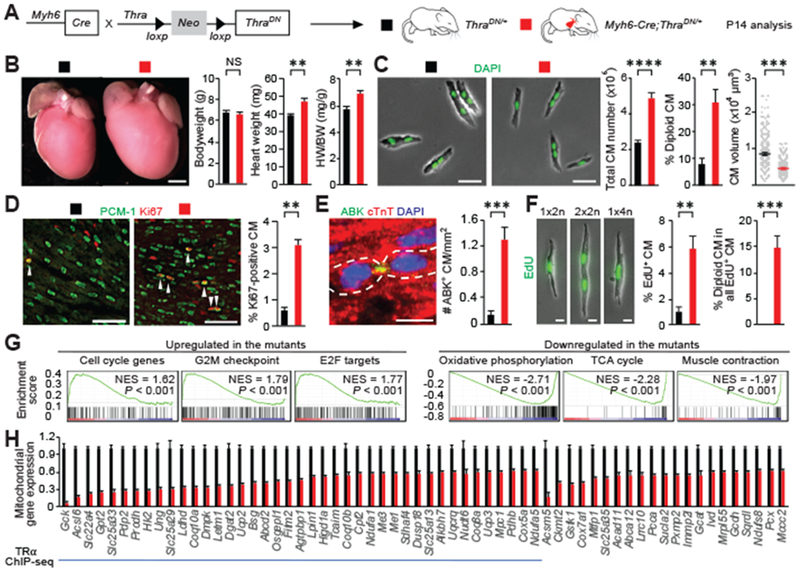
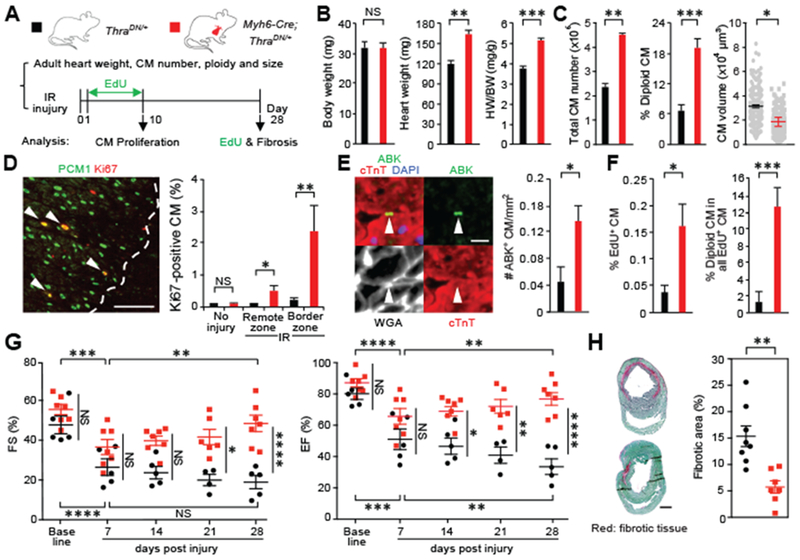
Tissue regenerative potential displays striking divergence across phylogeny and ontogeny, but the underlying mechanisms remain enigmatic. Loss of mammalian cardiac regenerative potential correlates with cardiomyocyte cell-cycle arrest and polyploidization as well as the development of postnatal endothermy. We reveal that diploid cardiomyocyte abundance across 41 species conforms to Kleiber's law-the ¾-power law scaling of metabolism with bodyweight-and inversely correlates with standard metabolic rate, body temperature, and serum thyroxine level. Inactivation of thyroid hormone signaling reduces mouse cardiomyocyte polyploidization, delays cell-cycle exit, and retains cardiac regenerative potential in adults. Conversely, exogenous thyroid hormones inhibit zebrafish heart regeneration. Thus, our findings suggest that loss of heart regenerative capacity in adult mammals is triggered by increasing thyroid hormones and may be a trade-off for the acquisition of endothermy.


Conflict of interest statement

Competing interests: The authors declare no competing interests.

Figures

Fig. 1.
Fig. 1.. Phylogenetic analysis of vertebrate cardiomyocyte (CM) nucleation and ploidy.
(A) Cladogram of species examined here. (B) Percentages of mononucleated diploid CMs. Each dot represents the value from the adult heart(s) of one species. Black, multiple samples were quantified; gray, only a single specimen was collected and analyzed. The data are listed from left to right according to the value of diploid CMs. Each new species analyzed in the current study is marked with an animal symbol next to it. Unlabeled dots represent species with previously reported CM ploidy values. All data are presented in table S2. Mammalian species with >30% mononucleated (diploid) CMs are first identified in this study.
Fig. 2.
Fig. 2.. The percentage of diploid CM inversely correlates with standard metabolic rate, body temperature, and plasma total T4 levels.
(A) Effect of standard metabolic rate (SMR, in W/kg0.75) on the content of diploid CMs. SMR is defined as MR/M0.75 (MR, metabolic rate; M, body mass). The data are fit by regression lines (red for vertebrate species and blue for mammalian species). (B) Effect of body temperature (Tb, in degrees celsius) on the percentage of diploid CMs. (C) Effect of plasma T4 levels on the frequency of diploid CMs. In (A) to (C), analyses include all species that have published physiological data to our knowledge. r2 denotes the coefficient of determination. For visual clarity, only a subset of ectodermic and endothermic species are labeled. All data are presented in tables S2 to S4.
Fig. 3.
Fig. 3.. CM-specific inactivation thyroid hormone receptor enhances CM proliferation in neonatal mice.
(A) Schematic for generating Myh6-Cre;ThraDN/+ mice with CM-restricted expression of a dominant negative (DN) TRα and analyzing phenotypes at P14. (B) Measurement of the bodyweight (BW) and heart weight (HW) (n = 4 mice). (C) Ventricular CM number, ploidy, and size analysis (n = 3 to 7 mice). (D to F) CM proliferative activity analysis. Representative images and quantifications of (D) proliferating CMs that stained positive for Ki67, (E) Aurora B kinase (ABK) localization at the cleavage furrow, and (F) EdU (n = 4 animals). Arrowheads indicate proliferating CM. In (E), cardiomyocytes undergoing cytokinesis are outlined. In (F), EdU was analyzed in dissociated CMs at P14 from mice injected with EdU at P12 and P13. 1×2n, 2×2n, and 1×4n denote CMs with one diploid nucleus, two diploid nuclei, and one tetraploid nucleus, respectively. (G) Expression profiling. Gene set enrichment analysis of up-regulated and down-regulated pathways in the mutant heart based on the RNA-seq analysis. (H) RNA-seq and ChIP-seq analysis. Mitochondrial genes whose expression is significantly down-regulated in the mutant hearts are shown (n = 3 hearts). The blue line marks mitochondrial genes directly targeted by TRα. Values are reported as mean ± SEM. NS, not significant. **P < 0.01, ***P < 0.001, ****P < 0.0001. Scale bars, (B) 1 mm; (C) 50 μm; (D) 100 μm; (E) and (F) 20 μm.
Fig. 4.
Fig. 4.. CMs deficient in thyroid hormone signaling retain significant regenerative potential in adult mice.
(A) Schematic of the experimental plan to analyze adult hearts and assess regenerative response after myocardial ischemia-reperfusion (IR) injury. (B) Measurement of the bodyweight (BW) and heart weight (HW) (n = 5 mice). (C) Analysis of ventricular CM number, ploidy, and cell size in adult mice (n = 3 animals). (D and E) CM proliferation analysis 10 days after injury. Quantification and representative images of CMs that are stained positive for Ki67 and Aurora B kinase (ABK) localization at the cleavage furrow in the hearts with no injury (n = 3 or 4 animals) or the hearts after IR injury (n = 4 or 5 animals). Dash lines mark the border of injury, whereas arrowheads show proliferating CMs. (F) Analysis of the number and ploidy of EdU-incorporated CMs. EdU is injected daily in the first 10 days after injury. Dissociated CMs are analyzed 28 days after IR (n = 4 animals). (G) Measurement of cardiac functions by means of echocardiography. The fraction shortening (FS) and ejection faction (EF) data of individual animals are presented (n = 5 to 7 animals). (H) Fibrosis analysis 28 days after injury (n = 7 or 8 animals). Values are reported as mean ± SEM. NS, not significant, *P < 0.05, **P < 0.01, ***P < 0.001, ****P < 0.0001. Scale bars, (D) 100 μm; (E) 20 μm; (H) 1 mm.

Comment in

  • TH at the heart of the matter.
    Kriebs A. Kriebs A. Nat Rev Endocrinol. 2019 Jun;15(6):316-317. doi: 10.1038/s41574-019-0200-z. Nat Rev Endocrinol. 2019. PMID: 30948802 No abstract available.
  • Lost in the fire.
    Marchianò S, Murry CE. Marchianò S, et al. Science. 2019 Apr 12;364(6436):123-124. doi: 10.1126/science.aax1006. Science. 2019. PMID: 30975873 No abstract available.
  • Regenerating Hearts by Arresting Development With Hypothyroidism.
    Lal S, Kühn B. Lal S, et al. Circ Res. 2019 Jun 7;124(12):1725-1726. doi: 10.1161/CIRCRESAHA.119.315106. Epub 2019 Jun 6. Circ Res. 2019. PMID: 31170042 Free PMC article.

References

    1. Xin M, Olson EN, Bassel-Duby R, Nat. Rev. Mol. Cell Biol 14, 529–541 (2013). - PMC - PubMed
    1. Matrone G, Tucker CS, Denvir MA, Cell. Mol. Life Sci 74, 1367–1378 (2017). - PMC - PubMed
    1. Patterson M et al., Nat. Genet 49, 1346–1353 (2017). - PMC - PubMed
    1. González-Rosa JM et al., Dev. Cell 44, 433–446.e7 (2018). - PMC - PubMed
    1. Poss KD, Wilson LG, Keating MT, Science 298, 2188–2190 (2002). - PubMed

Publication types

MeSH terms

Substances

LinkOut - more resources