. 2018 Apr;20(4):044007.
doi: 10.1088/2040-8986/aab0e8. Epub 2018 Mar 15.

Multispectral analysis tools can increase utility of RGB color images in histology

Affiliations

Multispectral analysis tools can increase utility of RGB color images in histology

Farzad Fereidouni et al. J Opt. 2018 Apr.

Abstract

Multispectral imaging (MSI) is increasingly finding application in the study and characterization of biological specimens. However, the methods typically used come with challenges on both the acquisition and the analysis front. MSI can be slow and photon-inefficient, leading to long imaging times and possible phototoxicity and photobleaching. The resulting datasets can be large and complex, prompting the development of a number of mathematical approaches for segmentation and signal unmixing. We show that under certain circumstances, just three spectral channels provided by standard color cameras, coupled with multispectral analysis tools, including a more recent spectral phasor approach, can efficiently provide useful insights. These findings are supported with a mathematical model relating spectral bandwidth and spectral channel number to achievable spectral accuracy. The utility of 3-band RGB and MSI analysis tools are demonstrated on images acquired using brightfield and fluorescence techniques, as well as a novel microscopy approach employing UV-surface excitation. Supervised linear unmixing, automated non-negative matrix factorization and phasor analysis tools all provide useful results, with phasors generating particularly helpful spectral display plots for sample exploration.

Keywords: fluorescence; histopathology; phasor analysis; spectral imaging.


Figures

Figure 1.
Figure 1.
Phasor encoding of multiple Gaussian spectra with different peak positions and band widths. Each spectrum is converted into a point on a phasor plot. Changing the peak position moves the phasor position around a circle and changing the bandwidth moves the point radially. (B) Visualization of spectral mixing on a phasor plot. The black spectrum is the superposition of the red, green and blue spectra. Note that the its phasor position falls in the middle of the triangle formed by the phasor positions of the three pure spectra. The fractional intensities from these spectra αB, αG and αR are calculated by finding the area shown. (C), (D) The same spectral modifications as in (A), but with the number of spectral channels binned to eight and three channels, respectively.
Figure 2.
Figure 2.
(A) The RGB conversion from the visible bands. (B) Spectra of sand, road and vegetation (C) the phasor plot of the image and segmented areas (D) vegetation, (E) roads, (F) lanes, (G) vegetation and (H) walking paths. (I) The phasor plot of the image binned to three channels.
Figure 3.
Figure 3.
Figure of merit for estimation of spectral width with spectrographs with 3, 8, 16 and 32 channels acquired in widefield scheme.
Figure 4.
Figure 4.
(A) Bright field image of Lymph node with metastatic cancer. (B) Converted optical density image. (C) Phasor plot of the image indicating presence of three components. Unmixing result for nuclei (D), (G), (J) cytokeratin (E), (H), (K) and CD3 (F), (I), (L) from MLS, NMF and phasor approach, respectively.
Figure 5.
Figure 5.
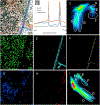
(A) Fluorescence image of cryosectioned mouse small intestine. (B) Computed spectra after compute-pure-spectrum steps to estimate pure spectral components. (C) Phasor plot, indicating vertices reflecting spectral signatures of autofluorescenc, goblet cells and smooth muscle, villus border.
Figure 6.
Figure 6.
RGB image of cutaneous mast cell tumors (B) overlapping spectra from stroma, nuclei and cytoplasm and (C) the corresponding phasor plot.
Figure 7.
Figure 7.
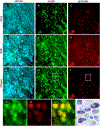
Comparison of unmixing results from MLS ((A)–(C)), NMF ((D)–(F)) and phasor approach ((G)–(I)). Yellow arrows on (D) and G) show the regions where the cross talk from nuclei is maximum. (J) and (K) are zoomed in images of the white rectangle from (H) and (I), respectively. (L) The overlay image of (J) and (K). (M) Image of same tissue processed through FFPE and stained with toluidine blue—note that granules and nuclei are similarly demonstrated.

References

    1. Solomon J and Rock B 1985. Imaging spectrometry for earth remote sensing Science 228 1147–52 - PubMed
    1. Bearman G and Levenson R 2003. Biological imaging spectroscopy Biomedical Photonics Handbook ed Vo-Dinh T (Boca Raton, FL: CRC Press; ) pp 8_1–26
    1. Levenson RM and Mansfield JR 2006. Multispectral imaging in biology and medicine: slices of life Cytometry A 69 748–58 - PubMed
    1. Taylor CR and Levenson RM 2006. Quantification of immunohistochemistry—issues concerning methods, utility and semiquantitative assessment II Histopathol 49 411–24 - PubMed
    1. Gao X et al. 2004. In vivo cancer targeting and imaging with semiconductor quantum dots Nat. Biotechnol 22 969–76 - PubMed