. 2018 Dec;2(11):384-397.
doi: 10.4049/immunohorizons.1800063.

Mitochondria Released by Apoptotic Cell Death Initiate Innate Immune Responses

Affiliations

Mitochondria Released by Apoptotic Cell Death Initiate Innate Immune Responses

Minghua Zhu et al. Immunohorizons. 2018 Dec.

Erratum in

Abstract

In solid organ transplantation, cell death arising from ischemia/reperfusion leads to the release of several damage-associated molecular patterns derived from mitochondria. Mitochondrial damage-associated molecular patterns (mtDAMPs) initiate proinflammatory responses, but it remains unknown whether the mode of cell death affects the inflammatory properties of mitochondria. Murine and human cell lines induced to selectively undergo apoptosis and necroptosis were used to examine the extracellular release of mitochondria during programmed cell death. Mitochondria purified from healthy, apoptotic, and necroptotic cells were used to stimulate macrophage inflammasome responses in vitro and neutrophil chemotaxis in vivo. Inhibition of specific mtDAMPs was performed to identify those responsible for macrophage inflammasome activation. A rat liver transplant model was used to identify apoptotic and necroptotic cell death in graft tissue following ischemia/reperfusion. Both apoptotic and necroptotic cell death occur in parallel in graft tissue. Apoptotic cells released more mitochondria than necroptotic cells. Moreover, mitochondria from apoptotic cells were significantly more inflammatory in terms of macrophage inflammasome activation and neutrophil recruitment. Inhibition of cellular synthesis of cardiolipin, a mitochondria-specific lipid and mtDAMP, significantly reduced the inflammasome-activating properties of apoptosis-derived mitochondria. Mitochondria derived from apoptotic cells are potent activators of innate immune responses, whereas mitochondria derived from healthy or necroptotic cells are significantly less inflammatory. Cardiolipin appears to be a key mtDAMP-regulating inflammasome activation by mitochondria. Methods of inhibiting apoptotic cell death in transplant grafts may be beneficial for reducing graft inflammation and transplant allosensitization.


Conflict of interest statement

DISCLOSURES The authors have no financial conflicts of interest.

Figures

FIGURE 1.
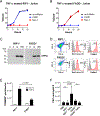
FIGURE 1.. Apoptosis and necroptosis of L929 cells results in the release of mitochondria.
(A) Western blot analysis of L929 lysates probed with anti-PARP or anti-pMLKL Abs show a time-dependent increase in cleaved PARP following STA treatment and pMLKL following TZS treatment. Blots were reprobed with anti-HSP70 and anti-GAPDH Abs for protein loading controls. (B) Annexin V and 7-AAD FACS analysis of L929 cells undergoing apoptosis induced by STA treatment or necroptosis induced by TNF-α/zVAD/SMACi (TZS) treatment. L929 cells were treated with STA for 20 h or with TZS for 6 h and stained with annexin V/PE and 7-AAD. (C) Time course of L929 cell death following STA or TZS treatment. Live cells are annexin Vneg/7-AADneg, apoptotic cells are annexin V+/7-AADneg, and necroptotic cells are annexin V+/7-AAD+. (D) L929 cells stably expressing mitochondrial-targeted DsRed fluorescent protein were treated with STA (20 h) or TZS (4 h). Cell culture SN was collected, and microparticles were purified by differential centrifugation and analyzed by FACS. (E) Quantification of extracellular DsRed-labeled mitochondria. Red staining: mitochondria stained with DsRed; blue staining: nuclei stained with DAPI. Flow cytometry image: red shading indicates mitochondria stained with DsRed. Horizontal bars indicate the percentage of microparticles containing dsRed-stained mitochondria. Comparisons were performed using a Mann–Whitney U test. A p value <0.05 was considered significant.
FIGURE 2.
FIGURE 2.. Macrophages uptake extracellular mitochondria from apoptotic cells, inducing caspase-1 activation and IL-1β production.
(A) J774A.1 cells were incubated with mitochondria purified from healthy, apoptotic, and necroptotic L929 cells containing DsRed-labeled mitochondria and analyzed by FACS and (B) imaged by confocal microscopy to confirm intracellular localization of the mitochondria. Red staining: mitochondria stained with DsRed; blue staining: nuclei stained with DAPI. Original magnification ×400. (C) LPS-primed J774A.1 cells were stimulated for 16 h with mitochondria (100 mg/ml) purified from healthy, apoptotic, and necroptotic L929 cells, the SN was assayed for IL-1β production, (D) LPS-primed primary murine (C57BL/6) peritoneal macrophages were similarly treated with mitochondria, and the SN was assayed for IL-1β. (E) Caspase-1 activity was measured in LPS-primed J744A.1 macrophages following treatment with purified mitochondria from healthy, apoptotic, or necroptotic cells. ATP (5 mM) served as a positive control. (F and G) Unprimed J774A.1 cells were treated with mitochondria (100 mg/ml) for 16 h, and the SN was assayed for IL-6 and TNF-α. LPS (100 ng/ml) served as a positive control. Comparisons were performed using a Kruskal–Wallis with Dunn multiple comparison test. A p value <0.05 was considered significant.
FIGURE 3.
FIGURE 3.. Extracellular mitochondria cause neutrophil recruitment.
(A) C57BL/6 mice received i.p. injections of mitochondria (300 mg) isolated from healthy, apoptotic, or necroptotic L929 cells (n = 6 per group), or with an equal volume of PBS (vehicle control; n = 6), or with zymosan (positive control; 100 mg; n = 2). PECs were harvested 18 h after injection, and neutrophils were enumerated based on FACS analysis for Ly6G+Ly6B.2+ cells. (B) PEC neutrophils were enumerated and compared. Comparisons were performed using a Kruskal–Wallis with Dunn multiple comparison test. A p value <0.05 was considered significant.
FIGURE 4.
FIGURE 4.. Apoptosis and necroptosis result in mitochondria dysfunction and injury.
L929 cells treated with STA (20 h) or TZS (6 h) were analyzed for loss of mitochondria membrane potential by costaining with MitoTracker Red and MitoTracker Green (A) or DiOC6 (B). Loss of red fluorescence intensity indicates depolarization. CCCP, a mitochondrial membrane depolarizing agent, was used as a positive control. (C) Superoxide production was measured with MitoSOX Red, producing a red fluorescence detectable by FACS. (D) mtDNA oxidation was determined by measuring the 8-OHdG content of DNA extracted from mitochondria of L929 cells treated with STA (20 h) or TZS (6 h). Comparisons were performed using a Kruskal–Wallis with Dunn multiple comparison test. A p value <0.05 was considered significant.
FIGURE 5.
FIGURE 5.. Mitochondrial cardiolipin plays a key role in macrophage inflammasome activation in response to apoptotic mitochondria.
LPS-primed J774A.1 cells were treated with mitochondria (100 mg/ml) under various conditions to determine which mitochondrial-derived molecules were responsible for inducing IL-1β production. (A) Neither heating mitochondria (100°C for 5 min) nor freezing mitochondria for (280°C for 2 h) affected IL-1β production. (B) Separating mitochondria from J744A.1 macrophages with a 0.4-mM filter significantly reduced IL-1β production. (C) Treatment with an antioxidant (MitoTEMPO), an ATPase (apyrase), or DNase had no significant effect on IL-1β production. (D) Following lipid extraction with chloroform, the chloroform fraction retained the majority of the IL-1β stimulation substance, suggesting involvement of a lipid. (E) Inhibition of cardiolipin synthesis with palmitate prior to the induction of apoptosis significantly decreased cardiolipin levels in mitochondrial preparations, compared with oleate (negative control). (F) Mitochondria purified from cells pretreated with palmitate prior to induction of apoptosis induced significantly lower IL-1β production, compared with oleate (negative control). Comparisons were performed using a Kruskal–Wallis with Dunn multiple comparison test. A p value <0.05 was considered significant.
FIGURE 6.
FIGURE 6.. Human T cells undergoing apoptosis and necroptosis release mitochondria, and apoptotic mitochondria recruit neutrophils.
To repeat our findings using human cells, RIP1−/− and FADD−/− Jurkat cell lines were used. (A and B) Treatment with TNF-α causes both cell lines to undergo cell death. Use of inhibitors of apoptosis (zVAD) and necroptosis (Nec-1) demonstrate that RIP1−/− Jurkat cells specifically undergo apoptosis and that FADD−/− Jurkat cells specifically undergo necroptosis in response to TNF-α treatment. (C and D) Mitochondria are released by apoptotic and necroptotic Jurkat cells. Following TNF-α treatment of the Jurkat cell lines, the cell-free SN microparticles were collected, and their protein lysates were examined by Western blot analysis for ATP5a, a mitochondria-specific protein. SN microparticles were then stained with a mitochondria-specific dye, MitoTracker DR, and with anti-TOMM22 and FACS analyzed. Red shading indicates microparticles stained with MitoTracker DR or TOMM2, indicative of mitochondria. Gray shading indicates unstained microparticles (negative control). Horizontal lines indicate percentage of microparticles staining positively for MitoTracker DR or TOMM2, respectively. (E) Quantification of TOMM22+ microparticles in the SN of TNF-α–treated Jurkat cell lines. (F) PEC neutrophil assay following i.p. mitochondria injection. C57BL/6 mice were injected with mitochondria (300 mg) purified from RIP1−/− or FADD−/− Jurkat cells that were untreated or treated with TNF-α. An equal volume of PBS (vehicle) was injected as a negative control. Eighteen hours after injection, PECs were harvested and analyzed for Ly6G+Ly6B.2+ neutrophils by FACS (n = 6 for all conditions). Comparisons were performed using a Mann–Whitney U test (E) or a Kruskal–Wallis with Dunn multiple comparison test (F). A p value <0.05 was considered significant.
FIGURE 7.
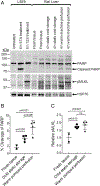
FIGURE 7.. Apoptosis and necroptosis occur during simulated transplantation.
(A) Western blot analysis of L929 and rat liver tissue lysates were probed with anti-PARP and anti-pMLKL Abs. L929 cells treated for 6 h with STA or TZS were used as positive controls for apoptosis and necroptosis, respectively. Rat livers that were freshly procured (fresh tissue) served as negative controls. To mimic clinical transplantation, rat liver grafts were first stored for 4 h either by static cold preservation at 4°C or by warm machine perfusion at 37°C. Following organ storage, rat liver grafts underwent simulated transplantation by reperfusion with oxygenated Krebs–Henseleit buffer. Blots were reprobed with anti-HSP70 Ab for protein loading control. Fresh samples were performed in duplicate and storage samples in quadruplicate, and the resulting bands on Western blot were quantified by digital densitometry. (B) Cleaved PARP was calculated by comparing the density of the cleaved PARP band with the uncleaved band. (C) Relative pMLKL was calculated by comparing the density of the Western blot band to the average density of the fresh liver pMLKL bands. Comparisons were performed using a Kruskal–Wallis with Dunn multiple comparison test. A p value <0.05 was considered significant.

References

    1. Brennan TV, Lunsford KE, and Kuo PC 2010. Innate pathways of immune activation in transplantation. J. Transplant 2010: 1–8. - PMC - PubMed
    1. Stangl M, Zerkaulen T, Theodorakis J, Illner W, Schneeberger H, Land W, and Faist E 2001. Influence of brain death on cytokine release in organ donors and renal transplants. Transplant. Proc 33: 1284–1285. - PubMed
    1. Murugan R, Venkataraman R, Wahed AS, Elder M, Hergenroeder G, Carter M, Madden NJ, Powner D, and Kellum JA, HIDonOR Study Investigators. 2008. Increased plasma interleukin-6 in donors is associated with lower recipient hospital-free survival after cadaveric organ transplantation. Crit. Care Med 36: 1810–1816. - PubMed
    1. Barklin A 2009. Systemic inflammation in the brain-dead organ donor. Acta Anaesthesiol. Scand 53: 425–435. - PubMed
    1. Ioannou A, Dalle Lucca J, and Tsokos GC 2011. Immunopathogenesis of ischemia/reperfusion-associated tissue damage. Clin. Immunol 141: 3–14. - PubMed