Comparative Study
. 2019 Jun 1;36(6):1316-1332.
doi: 10.1093/molbev/msz048.

Large-Scale Comparative Analysis of Codon Models Accounting for Protein and Nucleotide Selection

Affiliations
Comparative Study

Large-Scale Comparative Analysis of Codon Models Accounting for Protein and Nucleotide Selection

Iakov I Davydov et al. Mol Biol Evol. .

Abstract

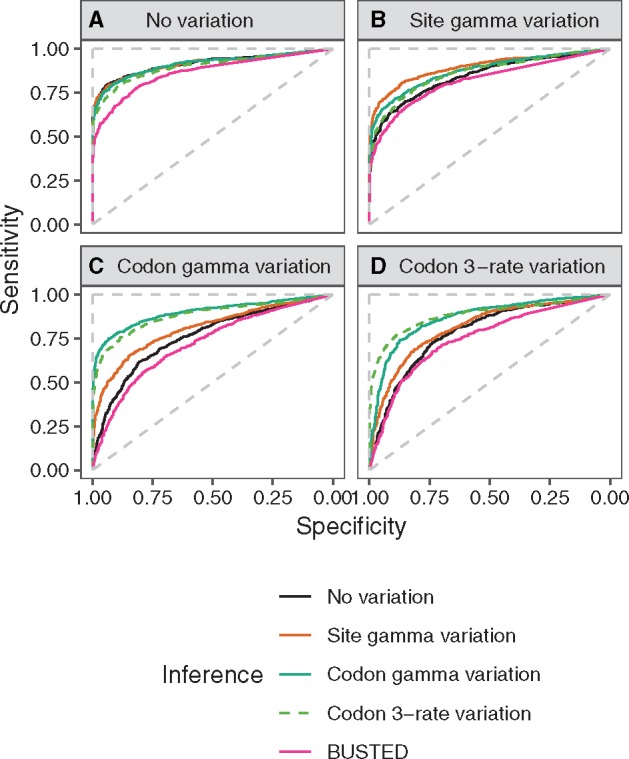
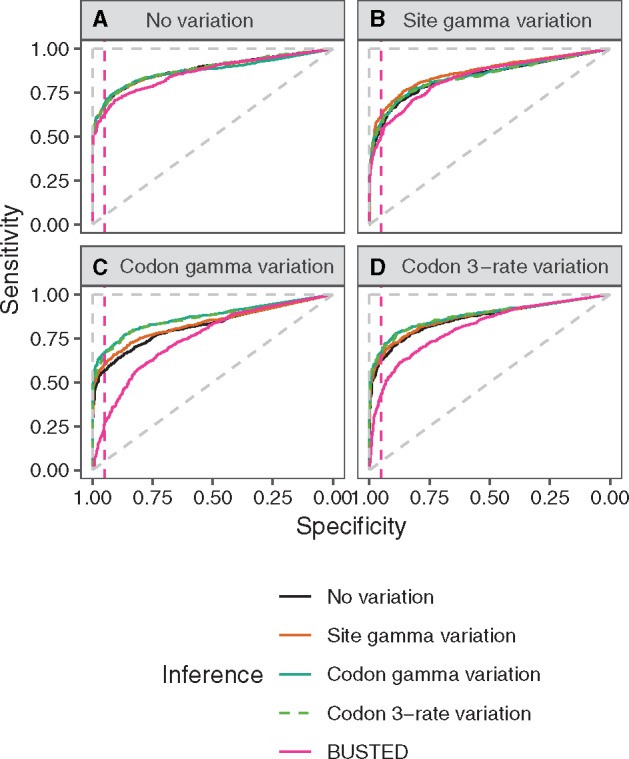
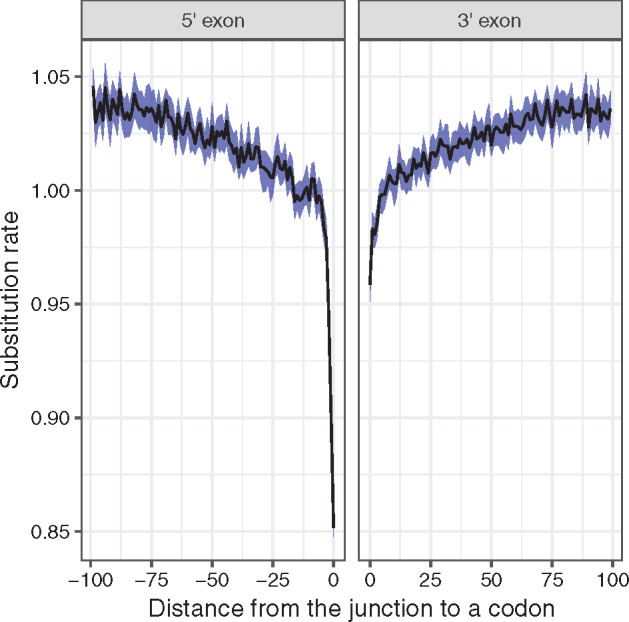
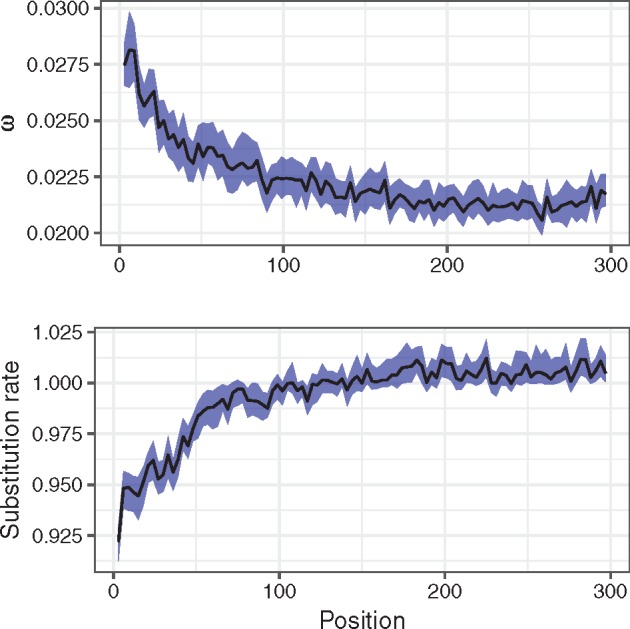
There are numerous sources of variation in the rate of synonymous substitutions inside genes, such as direct selection on the nucleotide sequence, or mutation rate variation. Yet scans for positive selection rely on codon models which incorporate an assumption of effectively neutral synonymous substitution rate, constant between sites of each gene. Here we perform a large-scale comparison of approaches which incorporate codon substitution rate variation and propose our own simple yet effective modification of existing models. We find strong effects of substitution rate variation on positive selection inference. More than 70% of the genes detected by the classical branch-site model are presumably false positives caused by the incorrect assumption of uniform synonymous substitution rate. We propose a new model which is strongly favored by the data while remaining computationally tractable. With the new model we can capture signatures of nucleotide level selection acting on translation initiation and on splicing sites within the coding region. Finally, we show that rate variation is highest in the highly recombining regions, and we propose that recombination and mutation rate variation, such as high CpG mutation rate, are the two main sources of nucleotide rate variation. Although we detect fewer genes under positive selection in Drosophila than without rate variation, the genes which we detect contain a stronger signal of adaptation of dynein, which could be associated with Wolbachia infection. We provide software to perform positive selection analysis using the new model.

Keywords: codon models; positive selection; substitution rate variation; synonymous substitutions.


Figures

<sc>Fig</sc>. 1.
Fig. 1.
ROC of four M8-based models (M8 with no rate variation, M8 with site rate variation, M8 with codon gamma rate variation, and M8 with codon 3-rate variation) and of BUSTED on data sets (A) without rate variation, (B) with site rate variation, (C) with codon gamma rate variation, and (D) with codon 3-rate variation. Specificity is defined as the proportion of correctly identified alignments simulated under a model with positive selection, and sensitivity is defined as the proportion of correctly identified alignments simulated without positive selection. The dashed diagonal line shows theoretical performance of the random predictor, and the dashed vertical and horizontal lines indicate theoretical performance of the perfect predictor.
<sc>Fig</sc>. 2.
Fig. 2.
Performance (ROC) of four branch-site-based models (branch-site with no rate variation, branch-site with site rate variation, branch-site with codon gamma rate variation, and branch-site with codon 3-rate variation) and of BUSTED on data sets (A) without rate variation, (B) with site rate variation, (C) with codon gamma rate variation, and (D) with codon 3-rate variation. The pink dashed line indicates the 0.95 specificity threshold (i.e., FPR of 0.05). The dashed diagonal line shows theoretical performance of the random predictor, and the dashed vertical and horizontal lines indicate theoretical performance of the perfect predictor.
<sc>Fig</sc>. 3.
Fig. 3.
Relative substitution rate as a function of proximity to the exon–intron and intron–exon junctions in the Drosophila data set. The rates were estimated using the model M8 with codon gamma rate variation. The left panel depicts rates in 5′-exon (prior to the exon–intron junction, negative distances), whereas the right panel depicts 3′-exon (rates after the intron–exon junction, positive distances). A rate of 1 corresponds to the average rate of substitution over the gene; thus values above 1 do not indicate positive selection, but simply a rate higher than average for this gene. The blue ribbon indicates the 98% confidence interval of mean estimate. Only alignment positions with <30% of gaps were used in the plot.
<sc>Fig</sc>. 4.
Fig. 4.
Posterior estimates of median ω (dN/dS, top panel) and codon substitution rate ρ (bottom panel) as a function of distance from the start codon expressed in the number of nucleotides in Drosophila. The model M8 with codon gamma rate variation was used to estimate both parameters simultaneously. Smaller values of ω (top panel) indicate stronger negative selection acting on the protein sequence. A substitution rate of 1 (bottom panel) corresponds to the average rate of substitution over the gene; thus values above 1 do not indicate positive selection, but simply a rate higher than average for this gene. The blue ribbons indicate 98% confidence intervals of median estimates. Start codons and alignment positions with less than three sequences were excluded from the plot.
<sc>Fig</sc>. 5.
Fig. 5.
Model selection scheme. Red arrows correspond to LRT and blue arrows correspond to AIC. Rate variation selection (A) was performed only on the full Drosophila data set, whereas (B) was used on all three data sets: the vertebrate data set, the Drosophila data set, and a subset of 1,000 genes from the Drosophila data set.

References

    1. Alexa A, Rahnenfuhrer J.. 2016. topGO: enrichment analysis for gene ontology. R Package Version 2(28.0).
    1. Anisimova M, Nielsen R, Yang Z.. 2003. Effect of recombination on the accuracy of the likelihood method for detecting positive selection at amino acid sites. Genetics 1643: 1229–1236. - PMC - PubMed
    1. Baele G, Lemey P.. 2013. Bayesian evolutionary model testing in the phylogenomics era: matching model complexity with computational efficiency. Bioinformatics 2916: 1970–1979. - PubMed
    1. Bentele K, Saffert P, Rauscher R, Ignatova Z, Bluthgen N.. 2013. Efficient translation initiation dictates codon usage at gene start. Mol Syst Biol. 91: 675.. - PMC - PubMed
    1. Betancur-R R, Orti G, Pyron RA.. 2015. Fossil-based comparative analyses reveal ancient marine ancestry erased by extinction in ray-finned fishes. Ecol Lett. 185: 441–450. - PubMed

Publication types

LinkOut - more resources