. 2019 May;28(5):993-1004.
doi: 10.1007/s00586-019-05910-9. Epub 2019 Mar 7.

Serum and nutrient deprivation increase autophagic flux in intervertebral disc annulus fibrosus cells: an in vitro experimental study

Affiliations

Serum and nutrient deprivation increase autophagic flux in intervertebral disc annulus fibrosus cells: an in vitro experimental study

Takashi Yurube et al. Eur Spine J. 2019 May.

Abstract

Purpose: The loss of nutrient supply is a suspected contributor of intervertebral disc degeneration. However, the extent to which low nutrition affects disc annulus fibrosus (AF) cells is unknown as nutrient deprivation has mainly been investigated in disc nucleus pulposus cells. Hence, an experimental study was designed to clarify the effects of limited nutrients on disc AF cell fate, including autophagy, the process by which cells recycle their own damaged components.

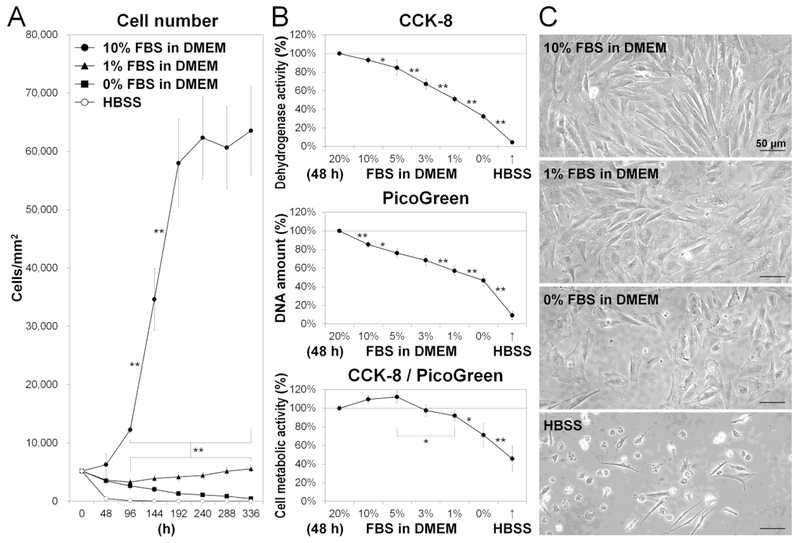
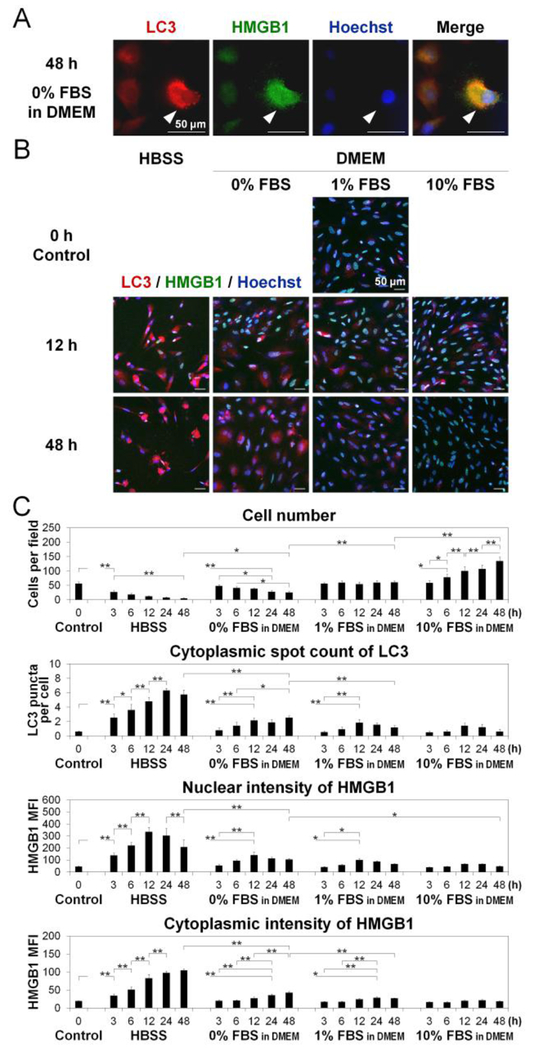
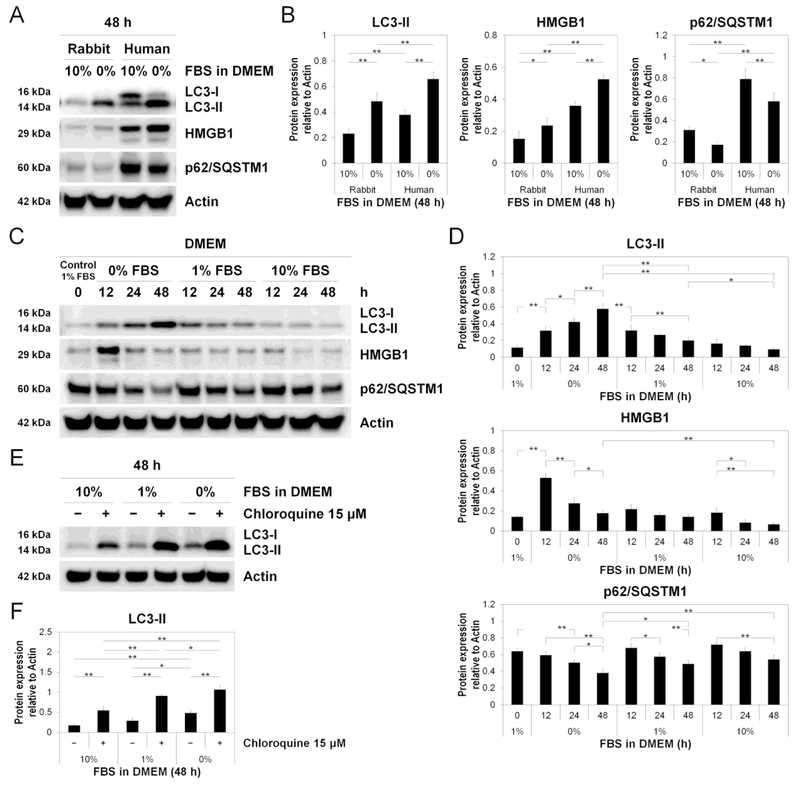
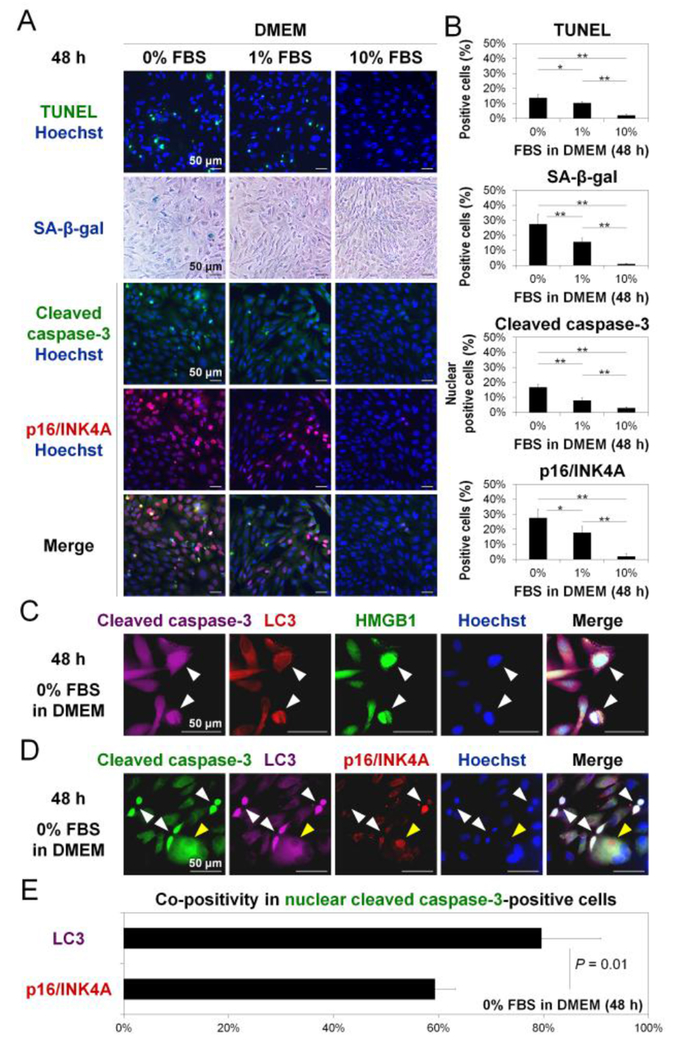
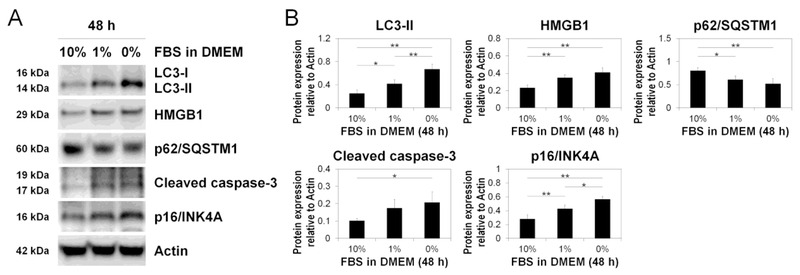
Methods: Rabbit disc AF cells were cultured in different media with varying serum concentrations under 5% oxygen. Cellular responses to changes in serum and nutrient concentrations were determined by measuring proliferation and metabolic activity. Autophagic flux in AF cells was longitudinally monitored using imaging cytometry and Western blotting for LC3, HMGB1, and p62/SQSTM1. Apoptosis (TUNEL staining and cleaved caspase-3 immunodetection) and cellular senescence (senescence-associated β-galactosidase assay and p16/INK4A immunodetection) were measured.

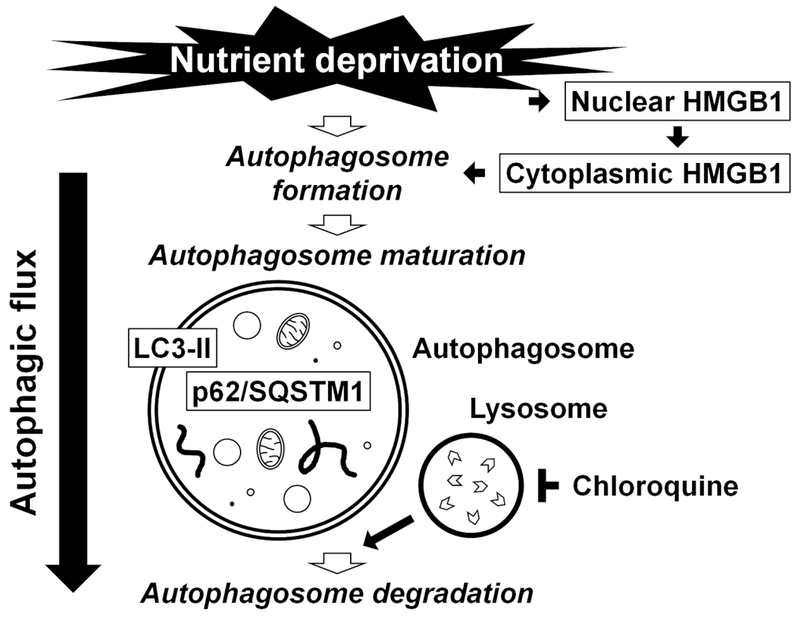
Results: Markers of apoptosis and senescence increased, while cell proliferation and metabolic activity decreased under the withdrawal of serum and of nutrients other than oxygen, confirming cellular stress. Time-dependent increases in autophagy markers, including LC3 puncta number per cell, LC3-II expression, and cytoplasmic HMGB1, were observed under conditions of reduced nutrition, while an autophagy substrate, p62/SQSTM1, decreased over time. Collectively, these findings suggest increased autophagic flux in disc AF cells under serum and nutrient deprivation.

Conclusion: Disc AF cells exhibit distinct responses to serum and nutrient deprivation. Cellular responses include cell death and quiescence in addition to reduced proliferation and metabolic activity, as well as activation of autophagy under conditions of nutritional stress. These slides can be retrieved under Electronic Supplementary Material.

Keywords: Annulus fibrosus (AF) cells; Apoptosis; Autophagy; Intervertebral disc; Senescence; Serum and nutrient deprivation.


Conflict of interest statement

CONFLICT OF INTEREST

TY, WB, HM, RH, KT, YK, KN, MK, NV, ML, and GS have no conflicts of interest to declare. JDK has received research grants from Stryker and Synthes.

Figures

Fig. 1
Fig. 1. Schematic illustration summarizing the process of autophagy examined in this study.
Under nutrient deprivation, high mobility group box 1 (HMGB1) translocates from the nucleus to the cytoplasm, resulting in the initiation of the autophagosome formation. The autophagosome maturation is driven by the conjugation of phosphatidylethanolamine with light chain 3 (LC3), leading to the formation of its autophagosome membrane-bound form, LC3-II. The p62/sequestosome 1 (p62/SQSTM1) and p62/SQSTM1-bound polyubiquitinated proteins become incorporated into completed autophagosomes. The completed autophagosome fuses with the lysosome (inhibited by chloroquine), the enclosed cargo is degraded, and its constituents are released and reutilized. Understanding of autophagy requires monitoring this dynamic, multi-step process of autophagic flux.
Fig. 2
Fig. 2. Reduced serum and nutrients decrease disc cell proliferation and metabolic activity.
(A) Number of cells after 0-, 48-, 96-, 144-, 192-, 240-, 288-, and 336-h culture in Hank’s balanced salt solution (HBSS) or Dulbecco’s modified Eagle’s medium (DMEM) with 0%, 1%, or 10% fetal bovine serum (FBS). Data are mean ± SD (n = 4). Two-way analysis of variance (ANOVA) with the Tukey-Kramer post-hoc test was used. *P < 0.05. **P < 0.01. (B) Dehydrogenase activity, DNA amount, and metabolic activity in cells after 48-h culture in HBSS or DMEM with 0%, 1%, 3%, 5%, 10%, or 20% FBS. Total dehydrogenase activity and DNA amount were assessed by the Cell Counting Kit-8 (CCK-8) and PicoGreen assay kit, respectively. Cell metabolic activity was calculated as dehydrogenase activity normalized to DNA amount. Data are mean ± SD expressed as the relative percentage of those in DMEM with 20% FBS (n = 4). Mixed-design ANOVA with the Tukey-Kramer post-hoc test was used. *P < 0.05. **P < 0.01. (C) Morphological cell appearance. Images shown are representative of four experiments with similar results (n = 4).
Fig. 3
Fig. 3. Reduced serum and nutrients activate disc cellular autophagy.
(A) Imaging cytometry for light chain 3 (LC3) (red) and high mobility group box 1 (HMGB1) (green) in cells after 48-h culture in Dulbecco’s modified Eagle’s medium (DMEM) with 0% fetal bovine serum (FBS), showing autophagic cells (white arrows). Hoechst (blue) was used for counterstaining. Images shown are representative of four experiments with similar results (n = 4). (B) Time-course imaging cytometry for LC3 (red), HMGB1 (green), and Hoechst (blue) in cells after 0-, 3-, 6-, 12-, 24-, and 48-h culture in Hank’s balanced salt solution (HBSS) or DMEM with 0%. 1%. or 10% FBS. Images shown are representative of four experiments with similar results (n = 4). (C) Changes in cell number per field, cytoplasmic spot count of LC3 per cell, and mean fluorescent intensity (MFI) of HMGB1 in the nucleus and cytoplasm per cell in time-course analysis. Imaging cytometric data were automatically collected from up to 36 fields and analyzed according to an established algorithm as described in the methods. Data are mean ± SD (n = 4). Two-way analysis of variance with the Tukey-Kramer post-hoc test was used. *P < 0.05. **P < 0.01.
Fig. 4
Fig. 4. Reduced serum concentration executes disc cellular autophagy.
(A) Western blotting for light chain 3 (LC3), high mobility group box 1 (HMGB1), and p62/sequestosome 1 (p62/SQSTM1) in rabbit and human total protein extracts after 48-h culture in Dulbecco’s modified Eagle’s medium (DMEM) with 0% and 10% fetal bovine serum (FBS). Actin was used as a loading control. Immunoblots shown are representative of four experiments with similar results (n = 4). (B) Changes in protein expression of LC3-II, HMGB1, and P62/SQSTM1 relative to actin in species analysis. Data are mean ± SD (n = 4). Two-way analysis of variance (ANOVA) with the Tukey-Kramer post-hoc test was used. *P < 0.05. **P < 0.01. (C) Time-course Western blotting for LC3, HMGB1, p62/SQSTM1, and actin in total protein extracts after 0, 12-, 24-, and 48-h culture in DMEM with 0%, 1%, or 10% FBS. Immunoblots shown are representative of four experiments with similar results (n = 4). (D) Changes in protein expression of LC3-II, HMGB1, and p62/SQSTM1 relative to actin in time-course analysis. Data are mean ± SD (n = 4). Two-way ANOVA with the Tukey-Kramer post-hoc test was used. *P < 0.05. **P < 0.01. (E) Western blotting for LC3 and actin to assess LC3 turnover using 15-μM chloroquine in total protein extracts after 48-h culture in DMEM with 0%, 1%, or 10% FBS. Immunoblots shown are representative of four experiments with similar results (n = 4). (F) Changes in protein expression of LC3-II relative to actin in LC3 turnover assay. Data are mean ± SD (n = 4). Two-way ANOVA with the Tukey-Kramer post-hoc test was used. *P < 0.05. **P < 0.01.
Fig. 5
Fig. 5. Reduced serum concentration increases disc cellular apoptosis and senescence, which co-exist with autophagy.
(A) Terminal deoxynucleotidyl transferase dUTP nick end labeling (TUNEL) staining (green), senescence-associated β-galactosidase (SA-β-gal) staining (blue), and immunofluorescence for cleaved caspase-3 (green) and pl6/INK4A (red) in cells after 48-h culture in Dulbecco’s modified Eagle’s medium (DMEM) with 0%, 1%, or 10% fetal bovine serum (FBS). Hoechst (blue) was used for fluorescent counterstaining. Images shown are representative of four experiments with similar results (n = 4). (B) Changes in the percentage of positive cells for TUNEL, SA-β-gal, nuclear cleaved caspase-3, and pl6/INK4A in serum deprivation. The number of total and positive cells was counted in ten random low-power fields (×100). Data are mean ± SD (n = 4). One-way analysis of variance with the Tukey-Kramer post-hoc test was used. *P < 0.05. **P < 0.01. (C) Immunofluorescence for cleaved caspase-3 (purple), light chain 3 (LC3) (red), high mobility group box 1 (HMGB1) (green), and Hoechst (blue) in cells after 48-h culture in DMEM with 0% FBS. Images shown are representative of four experiments with similar results (n = 4). (D) Immunofluorescence for cleaved caspase-3 (green), LC3 (purple), pl6/INK4A (red), and Hoechst (blue) in cells after 48-h culture in DMEM with 0% FBS. Nuclear cleaved caspase-3-positive cells are indicated by white arrows. Nuclear cleaved caspase-3-negative but pl6/INK4A-positive cells are indicated by yellow arrows. Images shown are representative of four experiments with similar results (n = 4). (E) The percentage of co-positivity for LC3 or p16/INK4A in nuclear cleaved caspase-3-positive cells in DMEM with 0% FBS at 48 h. The number of positive cells was counted in ten random low-power fields (×100). Data are mean ± SD (n = 4). The Student t-test was used.
Fig. 6
Fig. 6. Reduced serum concentration increases disc cellular autophagy, apoptosis, and senescence.
(A) Western blotting for light chain 3 (LC3), high mobility group box 1 (HMGB1), p62/sequestosome 1 (p62/SQSTM1), cleaved caspase-3, and pl6/INK4A in total protein extracts after 48-h culture in Dulbecco’s modified Eagle’s medium (DMEM) with 0%, 1%, or 10% fetal bovine serum (FBS). Actin was used as a loading control. Immunoblots shown are representative of four experiments with similar results (n = 4). (B) Changes in protein expression of LC3-II, HMGB1, p62/SQSTM1, cleaved caspase-3. and pl6/INK4A relative to actin in serum deprivation. Data are mean ± SD (n = 4). One-way analysis of variance with the Tukey-Kramer post-hoc test was used. *P < 0.05. **P < 0.01.

References

    1. Urban JP, Smith S, Fairbank JC (2004) Nutrition of the intervertebral disc. Spine (Phila Pa 1976) 29 (23):2700–2709 - PubMed
    1. Fuchs Y, Steller H (2011) Programmed cell death in animal development and disease. Cell 147 (4):742–758. doi:10.1016/j.cell.2011.10.033 - DOI - PMC - PubMed
    1. Lombard DB, Chua KF, Mostoslavsky R, Franco S, Gostissa M, Alt FW (2005) DNA repair, genome stability, and aging. Cell 120 (4):497–512. doi:10.1016/j.cell.2005.01.028 - DOI - PubMed
    1. Le Maitre CL, Freemont AJ, Hoyland JA (2007) Accelerated cellular senescence in degenerate intervertebral discs: a possible role in the pathogenesis of intervertebral disc degeneration. Arthritis Res Ther 9 (3):R45. doi:10.1186/ar2198 - DOI - PMC - PubMed
    1. Yurube T, Hirata H, Kakutani K, Maeno K, Takada T, Zhang Z, Takayama K, Matsushita T, Kuroda R, Kurosaka M, Nishida K (2014) Notochordal cell disappearance and modes of apoptotic cell death in a rat tail static compression-induced disc degeneration model. Arthritis Res Ther 16 (1):R31. doi:10.1186/ar4460 - DOI - PMC - PubMed

Publication types