

Protein supplementation improves lean body mass in physically active older adults: a randomized placebo-controlled trial
- PMID: 30848096
- PMCID: PMC6463466
- DOI: 10.1002/jcsm.12394
Protein supplementation improves lean body mass in physically active older adults: a randomized placebo-controlled trial
Abstract
Background: An inadequate protein intake may offset the muscle protein synthetic response after physical activity, reducing the possible benefits of an active lifestyle for muscle mass. We examined the effects of 12 weeks of daily protein supplementation on lean body mass, muscle strength, and physical performance in physically active older adults with a low habitual protein intake (<1.0 g/kg/day).
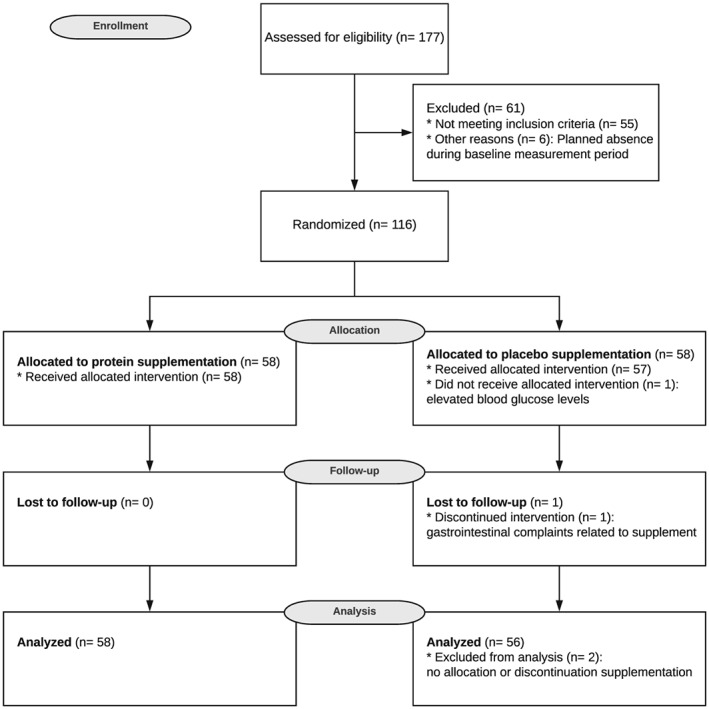
Methods: A randomized double-blinded controlled trial was performed among 116 physically active older adults [age 69 (interquartile range: 67-73) years, 82% male] who were training for a 4 day walking event of 30, 40, or 50 km/day. Participants were randomly allocated to either 31 g of milk protein or iso-caloric placebo supplementation for 12 weeks. Body composition (dual-energy X-ray absorptiometry), strength (isometric leg extension and grip strength), quadriceps contractile function, and physical performance [Short Physical Performance Battery, Timed Up-and-Go test, and cardiorespiratory fitness (Åstrand-Rhyming submaximal exercise test)] were measured at baseline and after 12 weeks. We assessed vitamin D status and markers of muscle damage and renal function in blood and urine samples before and after intervention.
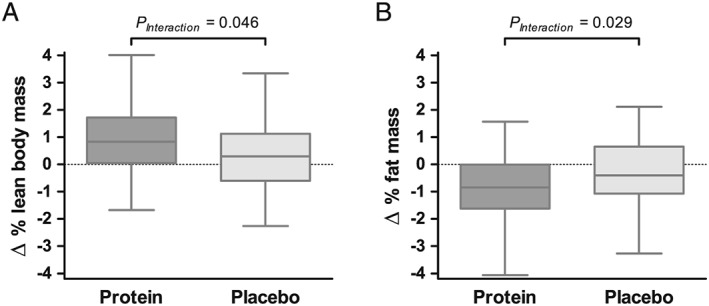
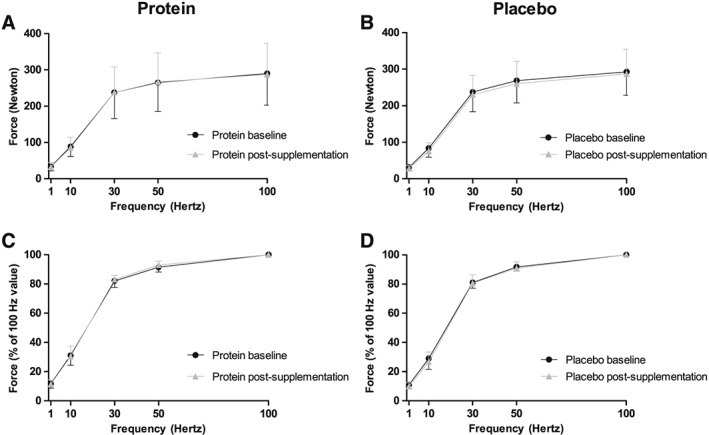
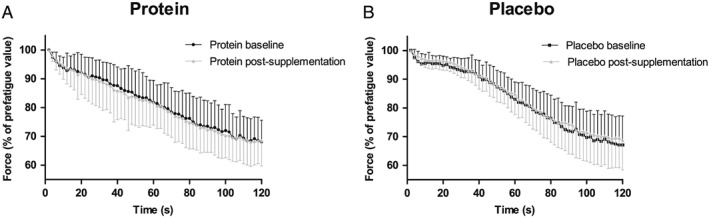
Results: A larger increase in relative lean body mass was observed in the protein vs. placebo group (∆0.93 ± 1.22% vs. ∆0.44 ± 1.40%, PInteraction = 0.046). Absolute and relative fat mass decreased more in the protein group than in the placebo group (∆-0.90 ± 1.22 kg vs. ∆-0.31 ± 1.28 kg, PInteraction = 0.013 and ∆-0.92 ± 1.19% vs. ∆-0.39 ± 1.36%, PInteraction = 0.029, respectively). Strength and contractile function did not change in both groups. Gait speed, chair-rise ability, Timed Up-and-Go, and cardiorespiratory fitness improved in both groups (P < 0.001), but no between-group differences were observed. Serum urea increased in the protein group, whereas no changes were observed in the placebo group (PInteraction < 0.001). No between-group differences were observed for vitamin D status, muscle damage, and renal function markers.
Conclusions: In physically active older adults with relatively low habitual dietary protein consumption, an improvement in physical performance, an increase in lean body mass, and a decrease in fat mass were observed after walking exercise training. A larger increase in relative lean body mass and larger reduction in fat mass were observed in participants receiving 12 weeks of daily protein supplementation compared with controls, whereas this was not accompanied by differences in improvements between groups in muscle strength and physical performance.
Keywords: Body composition; Elderly; Muscle; Protein; Randomized clinical trial.
© 2019 The Authors. Journal of Cachexia, Sarcopenia and Muscle published by John Wiley & Sons Ltd on behalf of the Society on Sarcopenia, Cachexia and Wasting Disorders.
Conflict of interest statement
None declared.
Figures

References
-
- Zampieri S, Pietrangelo L, Loefler S, Fruhmann H, Vogelauer M, Burggraf S, et al. Lifelong physical exercise delays age‐associated skeletal muscle decline. J Gerontol A Biol Sci Med Sci 2015;70:163–173. - PubMed
-
- Evans WJ. Skeletal muscle loss: cachexia, sarcopenia, and inactivity. Am J Clin Nutr 2010;91:1123S–1127S. - PubMed
-
- Phillips SM, Tipton KD, Aarsland A, Wolf SE, Wolfe RR. Mixed muscle protein synthesis and breakdown after resistance exercise in humans. Am J Physiol 1997;273:E99–E107. - PubMed
Publication types
MeSH terms
Substances
LinkOut - more resources
Full Text Sources
Medical
