

Plasma Fibroblast Growth Factor 21 Is Associated With Severity of Nonalcoholic Steatohepatitis in Patients With Obesity and Type 2 Diabetes
- PMID: 30848827
- PMCID: PMC7453039
- DOI: 10.1210/jc.2018-02414
Plasma Fibroblast Growth Factor 21 Is Associated With Severity of Nonalcoholic Steatohepatitis in Patients With Obesity and Type 2 Diabetes
Abstract
Context: The relationship between plasma fibroblast growth factor 21 (FGF21), insulin resistance, and steatohepatitis has not been systematically assessed.
Objective: To determine if higher plasma FGF21 is associated with worse steatohepatitis on liver biopsy in patients with nonalcoholic fatty liver disease (NAFLD).
Design and setting: Cross-sectional study in a university hospital.
Patients interventions and main outcome measures: Patients with a body mass index >25 (n = 187) underwent: (i) euglycemic hyperinsulinemic clamp to assess tissue-specific insulin resistance (IR); (ii) liver magnetic resonance spectroscopy for intrahepatic triglyceride quantification, (iii) liver biopsy (if NAFLD present; n = 146); and (iv) fasting plasma FGF21 levels.
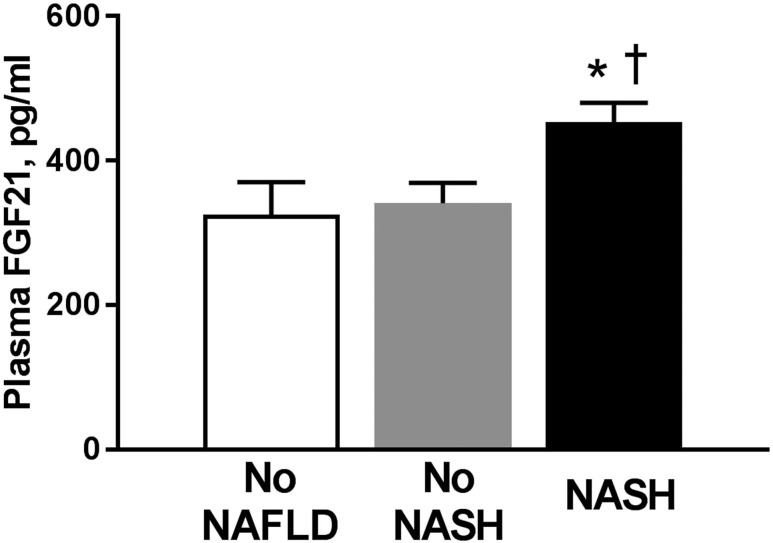
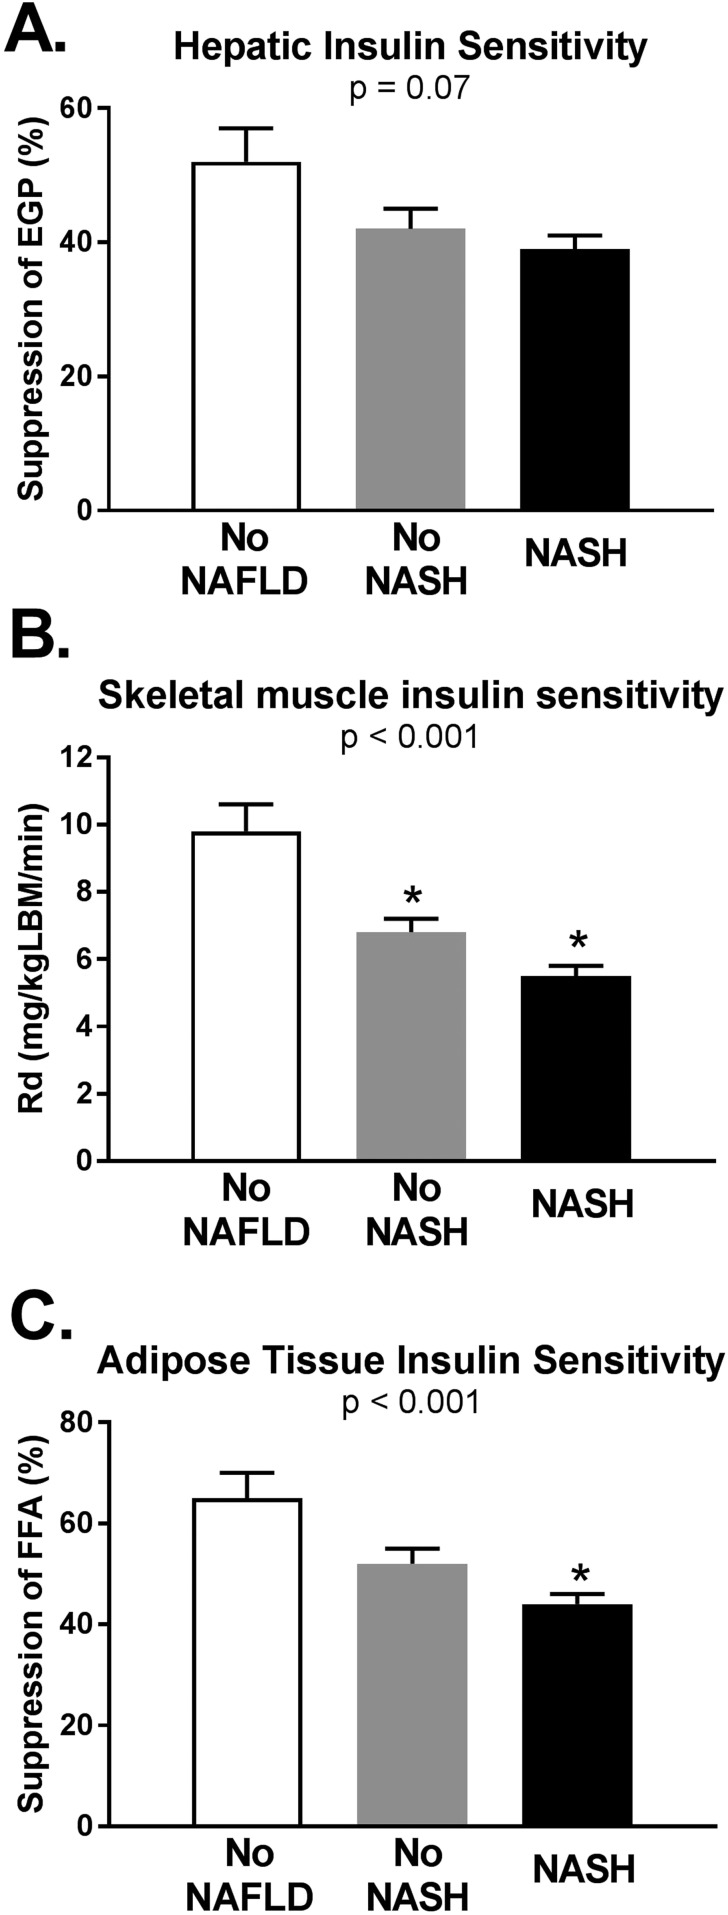
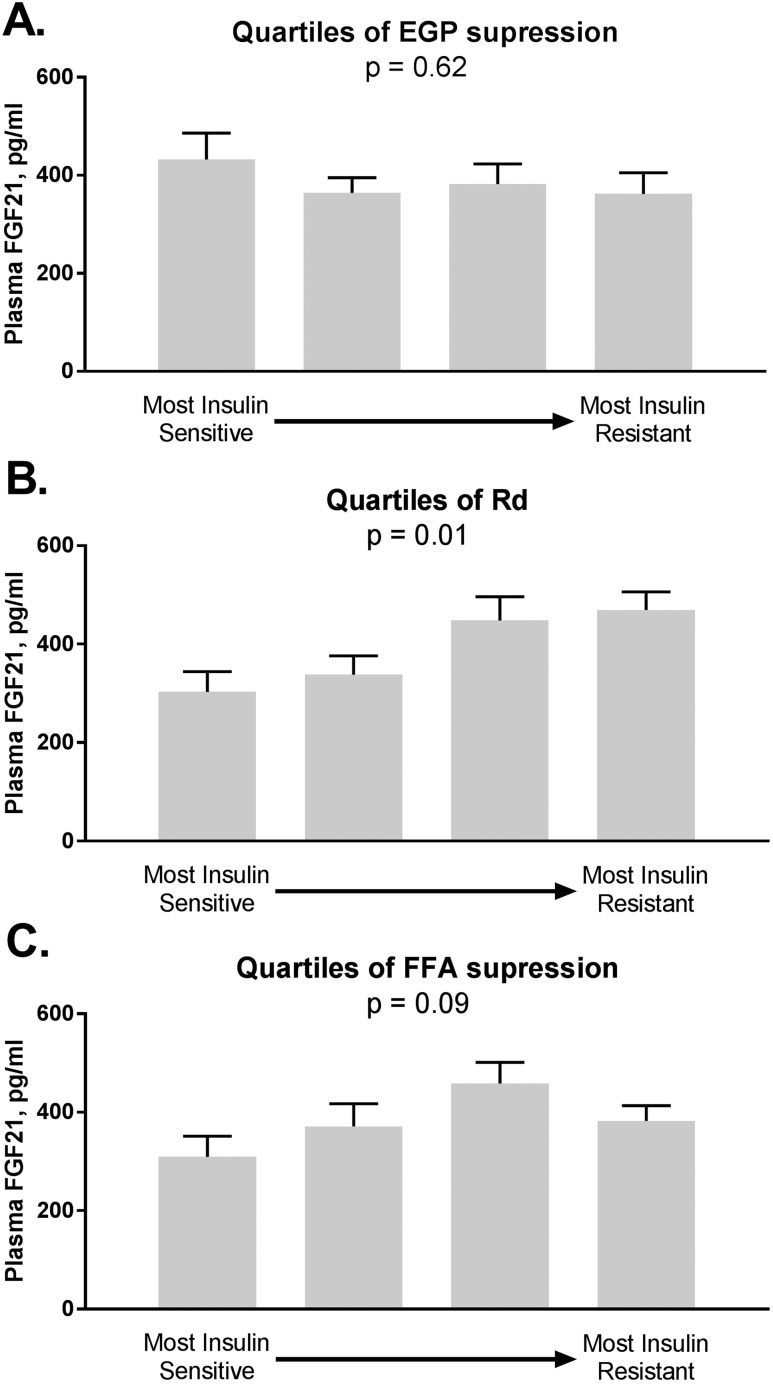
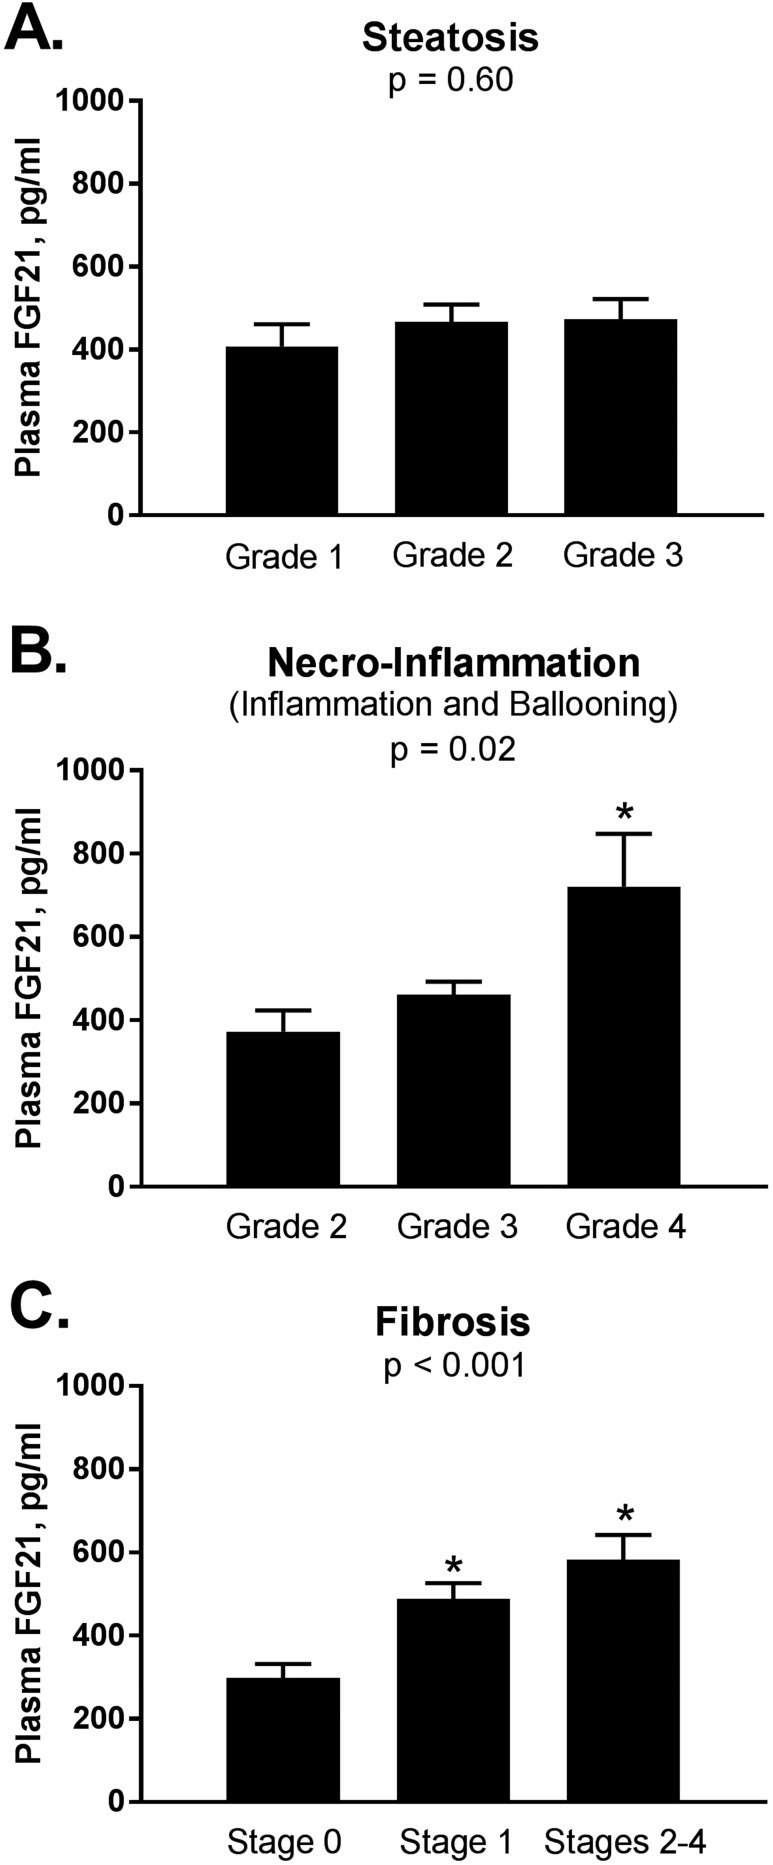
Methods and results: Patients were divided into three groups: (i) No NAFLD (n = 41); (ii) No nonalcoholic steatohepatitis (NASH) (patients with isolated steatosis or borderline NASH; n = 52); and (iii) NASH (patients with definite NASH; n = 94). Groups were well-matched for age/sex, prevalence of type 2 diabetes mellitus, and hemoglobin A1c. During euglycemic hyperinsulinemic insulin clamp, insulin sensitivity in skeletal muscle and adipose tissue worsened from No NAFLD to NASH (both P < 0.001). Plasma FGF21 levels correlated inversely with insulin sensitivity in adipose tissue (r = -0.17, P = 0.006) and skeletal muscle (r = -0.23, P = 0.007), but not with liver insulin sensitivity. Plasma FGF21 was higher in patients with NASH (453 ± 262 pg/mL) when compared with the No NASH (341 ± 198 pg/mL, P = 0.03) or No NAFLD (325 ± 289 pg/mL, P = 0.02) groups. Plasma FGF21 increased with the severity of necroinflammation (P = 0.02), and most significantly with worse fibrosis (P < 0.001), but not with worsening steatosis (P = 0.60).
Conclusions: Plasma FGF21 correlates with severity of steatohepatitis, in particular of fibrosis, in patients with NASH. Measurement of FGF21 may help identify patients at the highest risk of disease progression.
Copyright © 2019 Endocrine Society.
Figures
References
-
- Barb D, Portillo-Sanchez P, Cusi K. Pharmacological management of nonalcoholic fatty liver disease. Metabolism. 2016;65(8):1183–1195. - PubMed
-
- Maratos-Flier E. Fatty liver and FGF21 physiology. Exp Cell Res. 2017;360(1):2–5. - PubMed
-
- Fisher FM, Maratos-Flier E. Understanding the physiology of FGF21. Annu Rev Physiol. 2016;78(1):223–241. - PubMed
-
- Li H, Fang Q, Gao F, Fan J, Zhou J, Wang X, Zhang H, Pan X, Bao Y, Xiang K, Xu A, Jia W. Fibroblast growth factor 21 levels are increased in nonalcoholic fatty liver disease patients and are correlated with hepatic triglyceride. J Hepatol. 2010;53(5):934–940. - PubMed
Publication types
MeSH terms
Substances
Grants and funding
LinkOut - more resources
Full Text Sources
Medical
