. 2019 May 2;123(17):3551-3566.
doi: 10.1021/acs.jpcb.9b00969. Epub 2019 Mar 21.

Site-Specific 1D and 2D IR Spectroscopy to Characterize the Conformations and Dynamics of Protein Molecular Recognition

Affiliations

Site-Specific 1D and 2D IR Spectroscopy to Characterize the Conformations and Dynamics of Protein Molecular Recognition

Sashary Ramos et al. J Phys Chem B. .

Abstract

Proteins exist as ensembles of interconverting states on a complex energy landscape. A complete, molecular-level understanding of their function requires knowledge of the populated states and thus the experimental tools to characterize them. Infrared (IR) spectroscopy has an inherently fast time scale that can capture all states and their dynamics with, in principle, bond-specific spatial resolution, and 2D IR methods that provide richer information are becoming more routine. Although application of IR spectroscopy for investigation of proteins is challenged by spectral congestion, the issue can be overcome by site-specific introduction of amino acid side chains that have IR probe groups with frequency-resolved absorptions, which furthermore enables selective characterization of different locations in proteins. Here, we briefly introduce the biophysical methods and summarize the current progress toward the study of proteins. We then describe our efforts to apply site-specific 1D and 2D IR spectroscopy toward elucidation of protein conformations and dynamics to investigate their involvement in protein molecular recognition, in particular mediated by dynamic complexes: plastocyanin and its binding partner cytochrome f, cytochrome P450s and substrates or redox partners, and Src homology 3 domains and proline-rich peptide motifs. We highlight the advantages of frequency-resolved probes to characterize specific, local sites in proteins and uncover variation among different locations, as well as the advantage of the fast time scale of IR spectroscopy to detect rapidly interconverting states. In addition, we illustrate the greater insight provided by 2D methods and discuss potential routes for further advancement of the field of biomolecular 2D IR spectroscopy.


Figures

Figure 1.
Figure 1.
Time scales of protein motion (left) and illustration of example protein energy landscape and relationship to IR spectral features (right). Multiple distinct bands reflect population of multiple conformations, while inhomogeneous broadening of a band reflects the populations of substates at lower tiers in the energy landscape.
Figure 2.
Figure 2.
Inhomogeneous broadening results in elongation of 2D bands along the diagonal (right). Interconversion among the underlying states with increasing Tw reduces the elongation. Analysis of the 2D line shapes can yield a frequency–frequency correlation function that describes the spectral diffusion within the inhomogeneous frequency distribution (left).
Figure 3.
Figure 3.
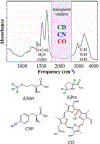
Representative protein IR spectrum highlighting the transparent frequency window and the structures of frequency-resolved probes used in our studies.
Figure 4.
Figure 4.
(A) Structural model of the Pc–cyt f complex (PDB ID: 1TU2). The inset provides an expanded view of the Cu site of Pc with the introduced C–D probes at Met97 highlighted in purple. (B) FT IR spectra of d3Met97 of Cu(I)Pc (red), Cu(II)Pc (blue), Zn(II)Pc (green), and Co(II)Pc (black). (C) FT IR spectra of d3Met97 of free Cu(I)Pc (red) and Cu(II)Pc (blue) and cyt f-bound Cu(I)Pc (black) and Cu(II)Pc (green). Reproduced with permission from ref . Copyright 2016 American Chemical Society.
Figure 5.
Figure 5.
(A) IR spectra of the P450cam–CO complex with camphor (blue) and norcamphor (red). (B) IR spectrum of the thiocamphor complex (black) and multicomponent fit (blue, red, and gray). (C) Frequency–frequency correlation functions determined for the P450cam–CO complex with camphor (blue), norcamphor (red), and thiocamphor (black). (D) Model for conformational dynamics underlying P450cam regioselectivity. See text for details. Structures of substrates are shown above the mechanism. Reproduced with permission from ref 14. Copyright 2015 American Chemical Society.
Figure 6.
Figure 6.
(A) Structural model (PDB ID: 4JWU) of the complex of P450cam (blue) and Pdx (pink). The CO probe is circled in blue. (B) FT IR spectra (black lines) and fits (shaded bands) of heme-ligated CO for the camphor complex of P450cam in the absence of Pdx (top) and in complex with Pdx (bottom). The black dotted line is the diagonal slice of the 2D spectrum obtained for Tw = 0.25 ps. (C) Tw-dependent 2D IR spectra of the CO probe for the camphor complex of P450cam in the absence of Pdx (top) and in the complex with Pdx (bottom). The white dotted lines represent the center frequencies of each spectral component. Adapted with permission from ref 15. Copyright 2018 Ramos, Basom, Thielges.
Figure 7.
Figure 7.
IR and NMR spectra of specifically labeled pPbs2. Shown is a structural model of pPbs2 with locations of introduced C–D probes at motif residues P0 and P3 highlighted (pink, top). The IR absorptions for the symmetric (left plots) and asymmetric stretches (right plots) of the CδD2 probes for the free pPbs2 (top plots) and complex with SH3Sho1 (bottom plots) are shown for (A) P3 and (B) P0. 13C–1H HSQC (800 MHz) spectral region with resonances for the equivalent nuclei are shown for (C) P3 and (D) P0 for free pPbs2 (blue) and SH3Sho1 complex (red). Adapted from ref 26 with permission. Copyright 2016 American Chemical Society.
Figure 8.
Figure 8.
(A) Structural model of the complex of SH3Sho1 and pPbs2 (PDB ID: 2VKN) showing locations of CNF incorporation. (B) FT IR spectra of the unligated state (colored lines) and the pPbs2 complex (black lines); difference spectra are displayed in black below each set of spectra. (C) Correlation functions (points) and fits (lines) for unligated SH3Sho1 (colored) and the pPbs2 complex (black). Reproduced from ref 87 with permission. Copyright PCCP Owner Societies.

Similar articles

Cited by

References

    1. Frauenfelder H; Sligar SG; Wolynes PG The Energy Landscapes and Motions of Proteins. Science 1991, 254, 1598–1603. - PubMed
    1. Boxer SG Stark Realities. J. Phys. Chem. B 2009, 113, 2972–2983. - PubMed
    1. Blasiak B; Londergan CH; Webb LJ; Cho M Vibrational Probes: From Small Molecule Solvatochromism Theory and Experiments to Applications in Complex Systems. Acc. Chem. Res. 2017, 50, 968–976. - PubMed
    1. Mukamel S Principles of Nonlinear Optics and Spectroscopy; Oxford University Press: New York, 1995.
    1. Cho M Two-Dimensional Optical Spectroscopy; CRC Press: Boca Raton, FL, 2009.

Publication types

MeSH terms