. 2019 May 6;16(5):1890-1905.
doi: 10.1021/acs.molpharmaceut.8b01238. Epub 2019 Apr 16.

Topography of Simulated Intestinal Equilibrium Solubility

Affiliations

Topography of Simulated Intestinal Equilibrium Solubility

Claire Dunn et al. Mol Pharm. .

Abstract

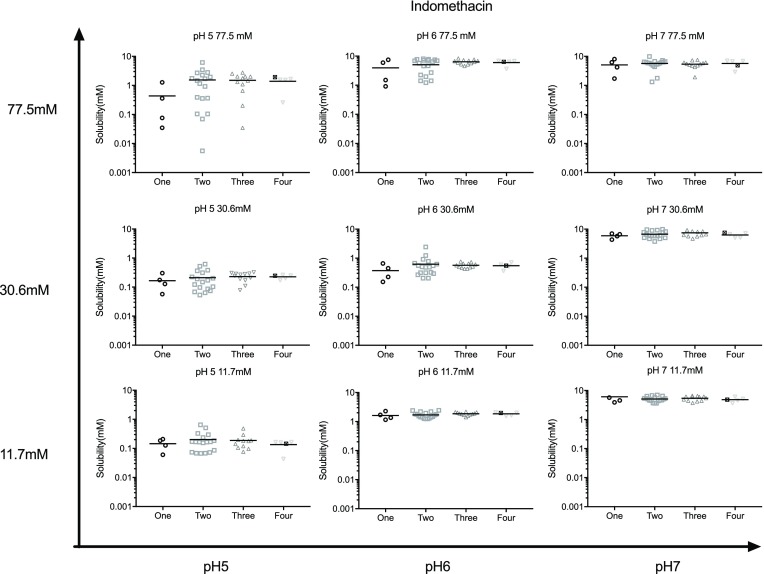
Oral administration of a solid dosage form requires drug dissolution in the gastrointestinal tract before absorption. Solubility is a key factor controlling dissolution, and it is recognized that, within the intestinal tract, this is influenced by the luminal fluid pH, amphiphile content, and composition. Various simulated intestinal fluid recipes have been introduced to mimic this behavior and studied using a range of different experimental techniques. In this article, we have measured equilibrium solubility utilizing a novel four component mixture design (4CMD) with biorelevant amphiphiles (bile salt, phospholipid, oleate, and monoglyceride) within a matrix of three pH values (5, 6, and 7) and total amphiphile concentrations (11.7, 30.6, and 77.5 mM) to provide a topographical and statistical overview. Three poorly soluble drugs representing acidic (indomethacin), basic (carvedilol), and neutral (fenofibrate) categories have been studied. The macroscopic solubility behavior agrees with literature and exhibits an overall increasing solubility from low pH and total amphiphile concentration to high pH and total amphiphile concentration. Within the matrix, all three drugs display different topographies, which can be related to the statistical effect levels of the individual amphiphiles or amphiphile interactions on solubility. The study also identifies previously unreported three and four way factor interactions notably between bile salt, phospholipid, pH, and total amphiphile concentration. In addition, the results also reveal that solubility variability is linked to the number of amphiphiles and the respective ratios in the measurement fluid, with the minimum variation present in systems containing all four amphiphiles. The individual 4CMD experiments within the matrix can be linked to provide a possible intestinal solubility window for each drug that could be applied in PBPK modeling systems. Overall the approach provides a novel overview of intestinal solubility topography along with greater detail on the impact of the various factors studied; however, each matrix requires 351 individual solubility measurements. Further studies will be required to refine the experimental protocol in order the maximize information garnered while minimizing the number of measurements required.

Keywords: Biopharmaceutics Classification System; FaSSIF; FeSSIF; IVIVC; four component mixture design; pH; solubility; total amphiphile concentration.


Conflict of interest statement

The authors declare no competing financial interest.

Figures

Figure 1
Figure 1
4CMD representation of surface points. Flattened representation of the four surfaces of the tetrahedron when open from the top vertex, which is 100 mol % bile salt, and the remaining 100 mol % vertices are labeled with the appropriate amphiphile.
Figure 2
Figure 2
A statistical comparison of measured equilibrium solubility distributions. Measured equilibrium solubility distributions presented as box and whisker plots based on measurement pH and total amphiphile concentration. Each box and whisker represents all the data measurements from one 4CMD experiment from high to low, maximum value, 75th percentile; median, 25th percentile; and minimum value. Total amphiphile concentration as stated on the x-axis. pH 5, □; pH 6, gray □; and pH 7, ■. Nn, Data distribution of 4CMD is not normal as assessed by the Kolmogorov normality test Minitab version 16.0. Bars link data sets considered statistically equivalent (p > 0.05), Mann–Whitney test, Minitab version 16. ○, 4CMD internal points which contain all four amphiphiles, see Table 1. Comparative data: FaSSIF, fasted simulated intestinal fluid; FaHIF, fasted human intestinal fluid; FeSSIF, fed simulated intestinal fluid; FeHIF, fed human intestinal fluid. All data were taken with permission from from refs (30) (Copyright 2010 American Chemical Society) and (17) (Copyright 2014 Elsevier). Fasted DoE data were taken with permission from ref (24) (Copyright 2015 Elsevier). Fed DoE data were taken with permission from ref (25) (Copyright 2017 Elsevier). (a) Indomethacin, (b) carvedilol, and (c) fenofibrate.
Figure 3
Figure 3
Calculated equilibrium solubility contour plots presented as a matrix based on measurement pH and total amphiphile concentration. The color shades attached to individual figures represent the calculated solubility contour concentration (mM) values for each drug. NB, the solubility ranges vary between figures. (a) Indomethacin, (b) carvedilol, and (c) fenofibrate.
Figure 4
Figure 4
Influence of amphiphile number on measured equilibrium solubility. Indomethacin equilibrium solubility data points determined during the 4CMD experiment presented as individual points based on the number of amphiphiles present. (Bar) The mean for each individual data set. (●) In the four amphiphile columns = center point (see Table 1). See the Supporting Information for carvedilol and fenofibrate figures.
Figure 5
Figure 5
Internal point results. Indomethacin equilibrium solubility data point plots determined during the 4CMD experiment. Data are presented as a matrix based on measurement pH and total amphiphile concentration. Each individual plot represents the internal data points (see Table 1) from the 4CMD experiments grouped either by measurement pH or total amphiphile concentration. NB, The surface data points are not included in this analysis. ●, Center point; ○, high NATC; △, high SO; ◇, high GMO; and □, high SPC. See the Supporting Information for the carvedilol and fenofibrate figures.
Figure 6
Figure 6
Indomethacin standardized effect values for individual amphiphiles and two amphiphile interactions. Indomethacin standardized effect value for individual amphiphiles and amphiphile combinations calculated by dividing coefficient with standard error; the dashed line indicates the p-value (p > 0.05). Due to model limitations, no p-value was generated for single amphiphile terms, only a standardized effect value. The bars >0 indicate a positive solubility effect, and the bars <0 indicate a negative solubility effect. NaTC, bile salt; GMO, monoglyceride; SPC, phospholipid; and SO, sodium oleate. (a) Indomethacin single standardized effect values; (b) indomethacin two amphiphile interaction standardized effect values. See the Supporting Information for the carvedilol and fenofibrate figures.
Figure 7
Figure 7
The topography of intestinal solubility. Equilibrium solubility plotted as a 3D topography using the internal center point solubility result for each drug across the 4CMD matrix. The color shades attached to individual figures for the vertical z-axis represent the solubility contour concentration (mM) values for each drug; note, that the solubility ranges vary between figures. (a) Indomethacin, (b) carvedilol, and (c) fenofibrate.
Figure 8
Figure 8
Intestinal equilibrium solubility window using the maximum, minimum, and center internal point solubility results from selected 4CMD experiments (see (a) and Figure 5). TAC, total amphiphile concentration. The dashed line indicates the required solubility for the stated dose dissolved in 250 mL to be classed as the high solubility with the BCS. (b) Indomethacin, dose = 50 mg; (c) carvedilol, dose = 25 mg; and (d) fenofibrate, dose = 200 mg.

References

    1. Koziolek M.; Grimm M.; Schneider F.; Jedamzik P.; Sager M.; Kuhn J. P.; Siegmund W.; Weitschies W. Navigating the human gastrointestinal tract for oral drug delivery: Uncharted waters and new frontiers. Adv. Drug Delivery Rev. 2016, 101, 75–88. 10.1016/j.addr.2016.03.009. - DOI - PubMed
    1. Sugano K.; Okazaki A.; Sugimoto S.; Tavornvipas S.; Omura A.; Mano T. Solubility and dissolution profile assessment in drug discovery. Drug Metab. Pharmacokinet. 2007, 22 (4), 225–254. 10.2133/dmpk.22.225. - DOI - PubMed
    1. Amidon G. L.; Lennernas H.; Shah V. P.; Crison J. R. A Theoretical Basis For a Biopharmaceutic Drug Classification - the Correlation Of In-Vitro Drug Product Dissolution and In-Vivo Bioavailability. Pharm. Res. 1995, 12 (3), 413–420. 10.1023/A:1016212804288. - DOI - PubMed
    1. Lipinski C. A. Drug-like properties and the causes of poor solubility and poor permeability. J. Pharmacol. Toxicol. Methods 2000, 44 (1), 235–249. 10.1016/S1056-8719(00)00107-6. - DOI - PubMed
    1. Dressman J. B.; Vertzoni M.; Goumas K.; Reppas C. Estimating drug solubility in the gastrointestinal tract. Adv. Drug Delivery Rev. 2007, 59 (7), 591–602. 10.1016/j.addr.2007.05.009. - DOI - PubMed

Publication types

MeSH terms

LinkOut - more resources