. 2019 Mar 7;176(6):1282-1294.e20.
doi: 10.1016/j.cell.2019.02.012.

Characterizing Mutational Signatures in Human Cancer Cell Lines Reveals Episodic APOBEC Mutagenesis

Affiliations

Characterizing Mutational Signatures in Human Cancer Cell Lines Reveals Episodic APOBEC Mutagenesis

Mia Petljak et al. Cell. .

Abstract

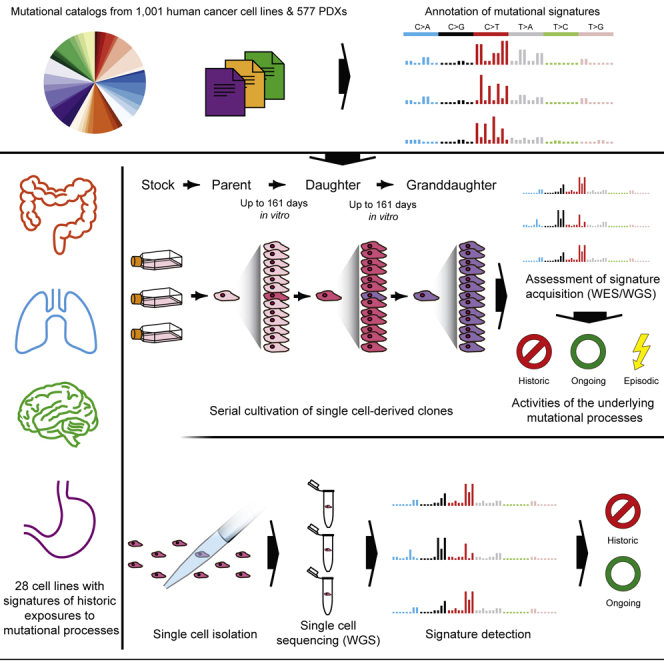
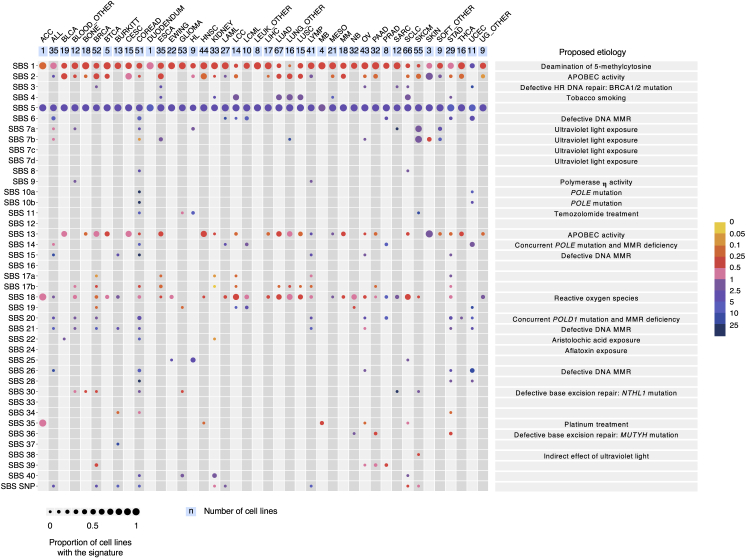
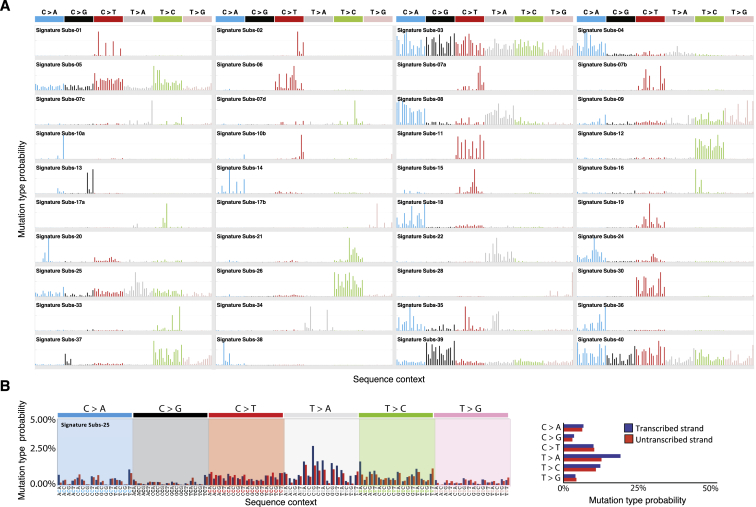
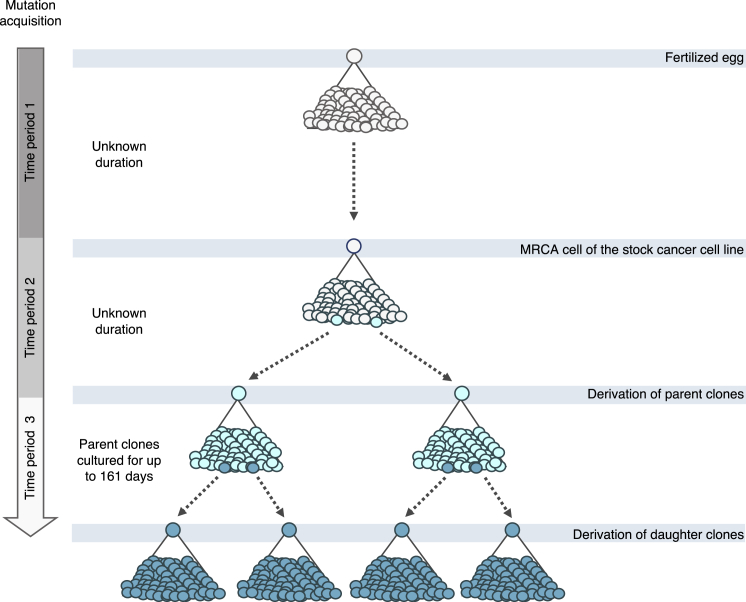
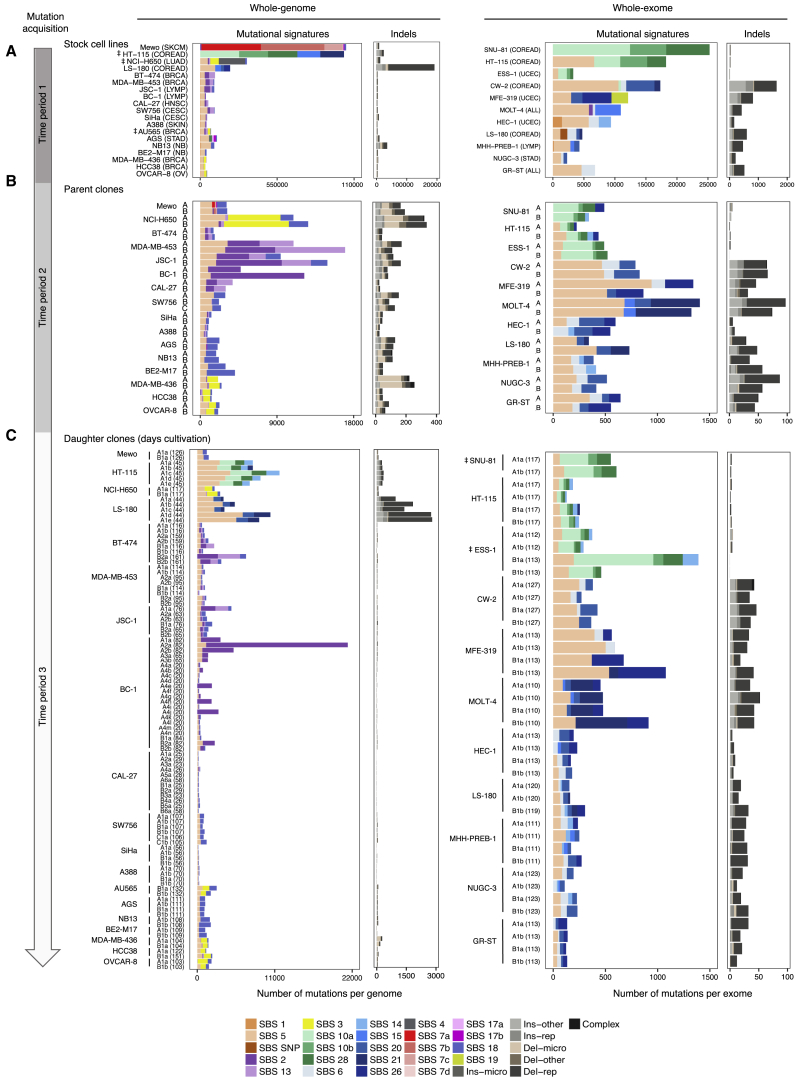
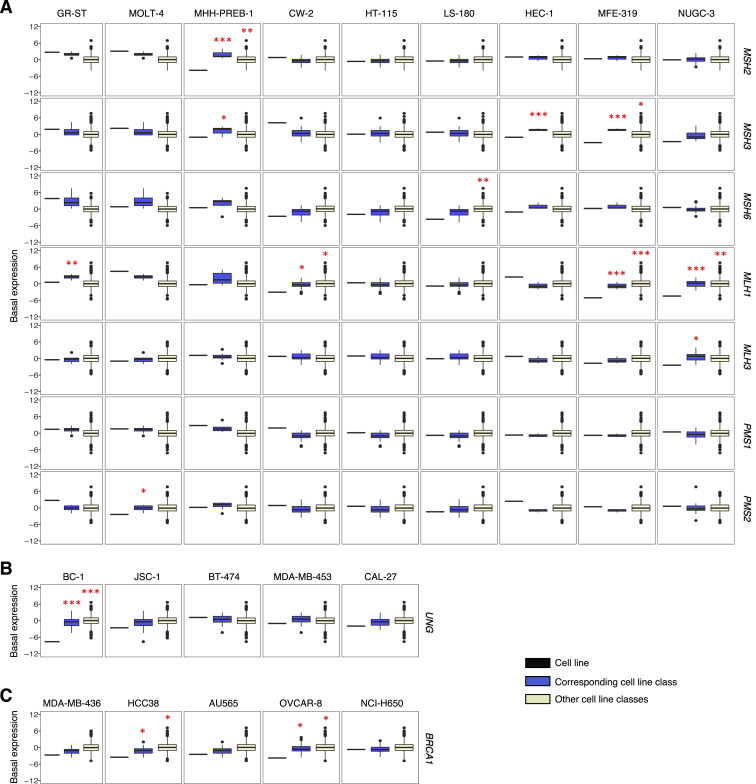
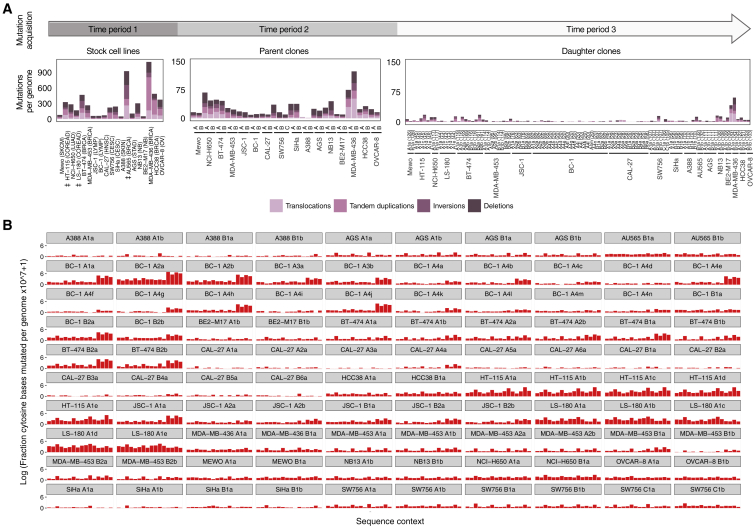
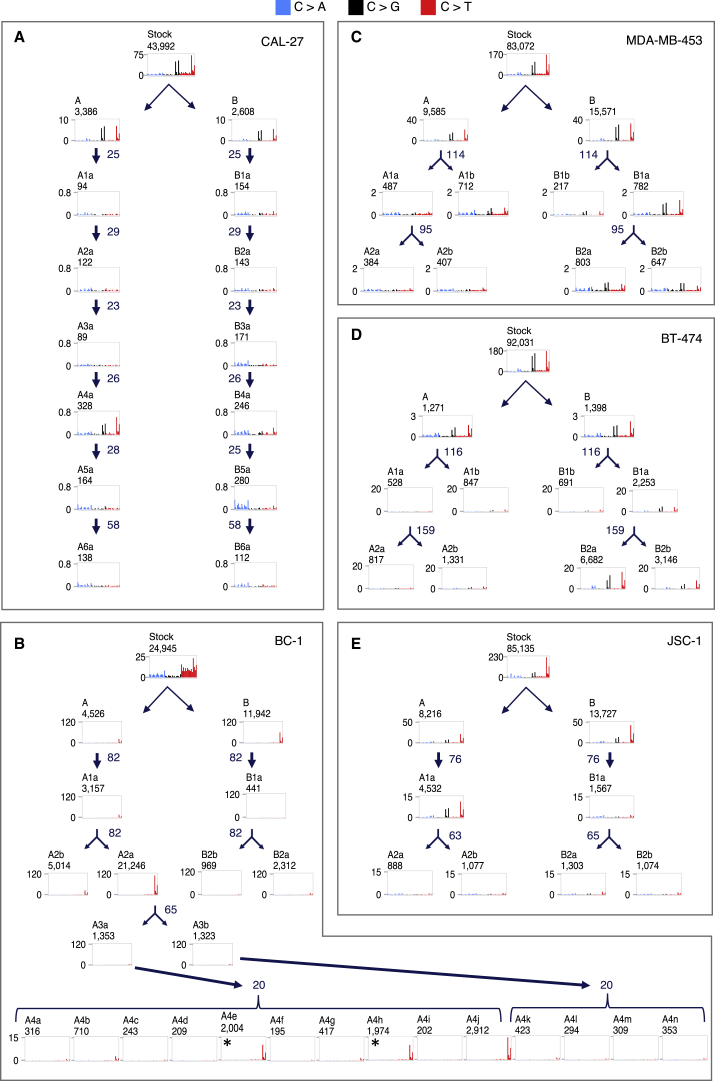
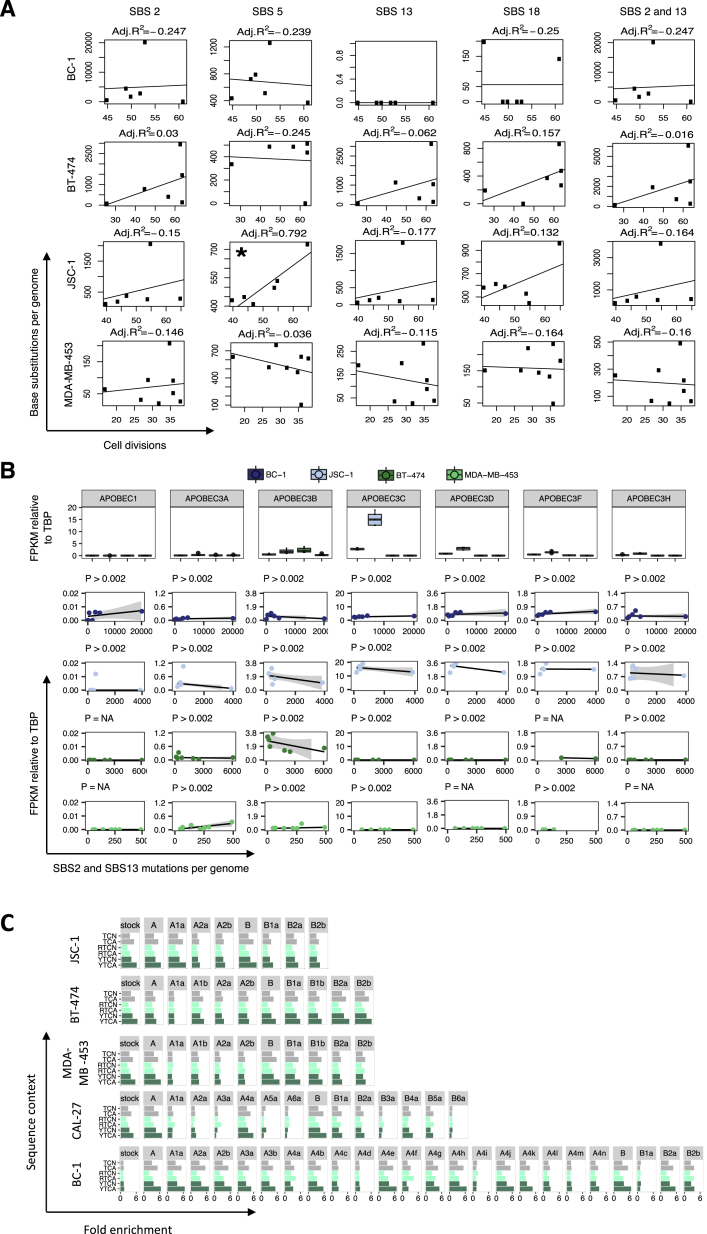
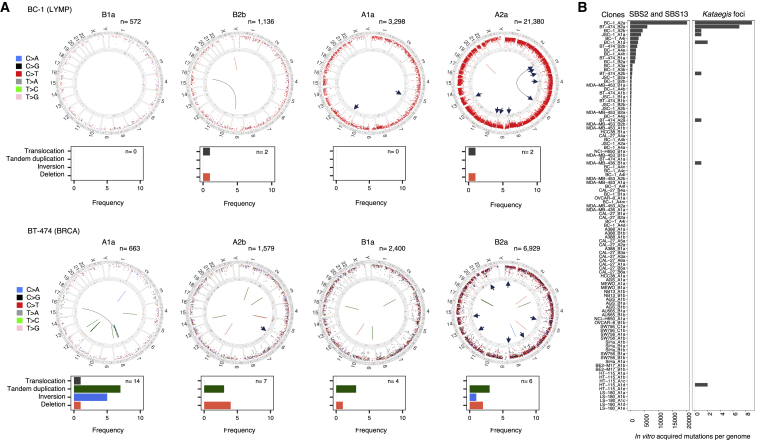
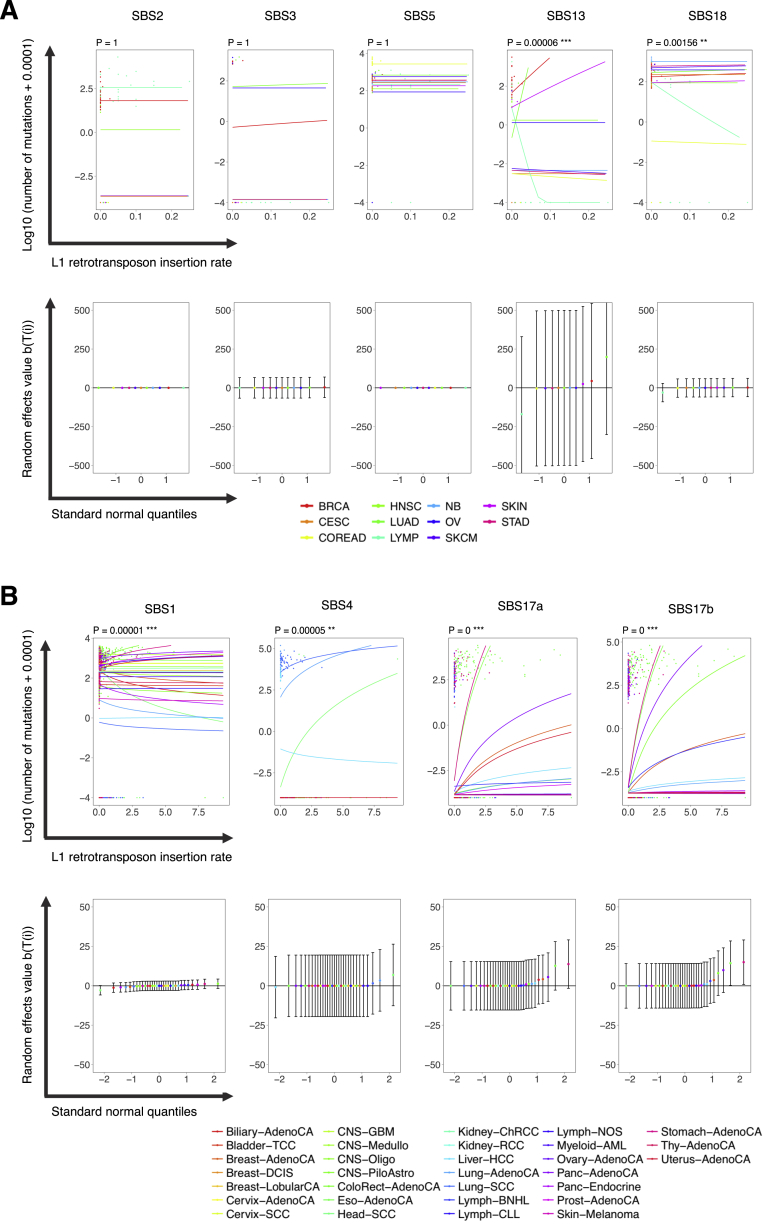
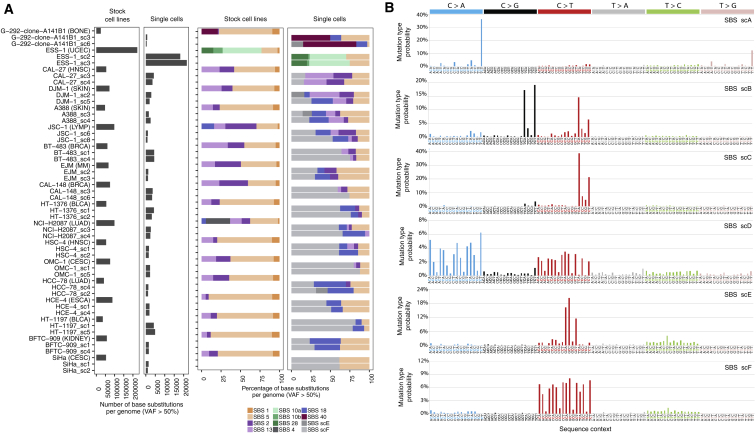
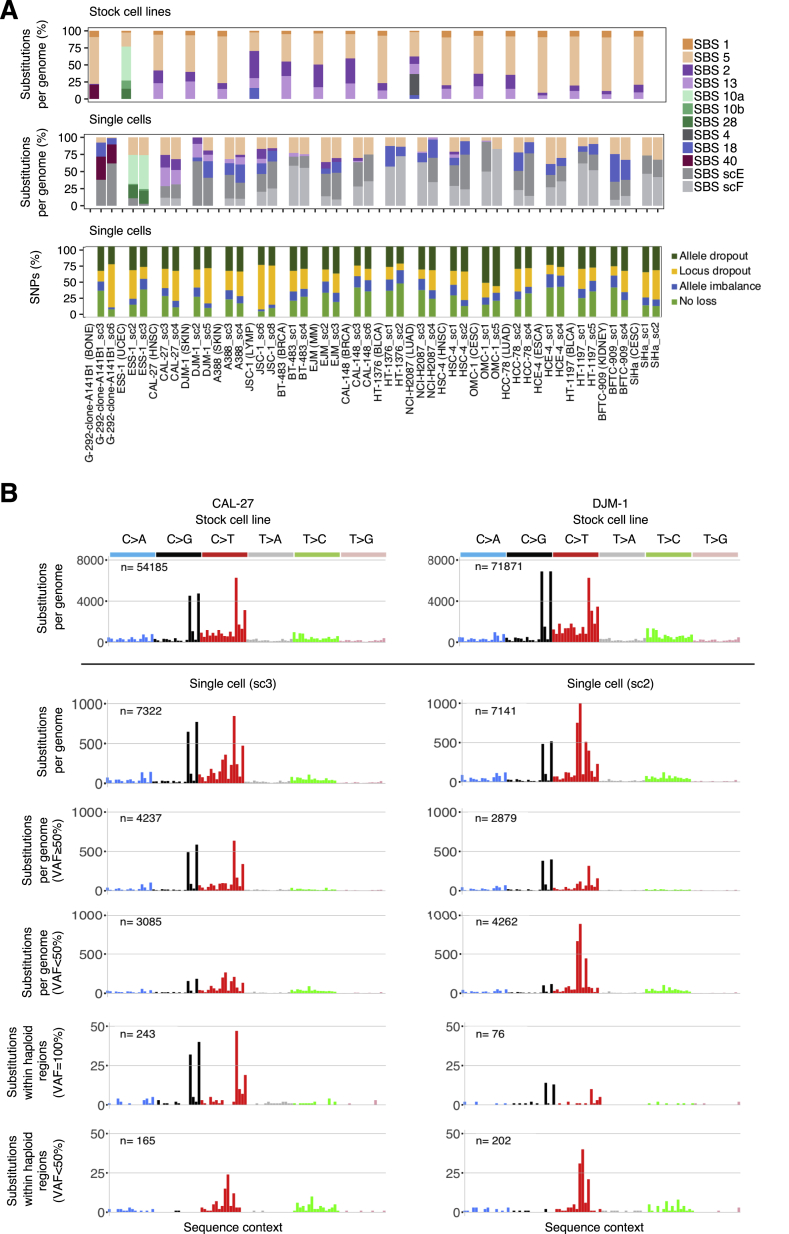
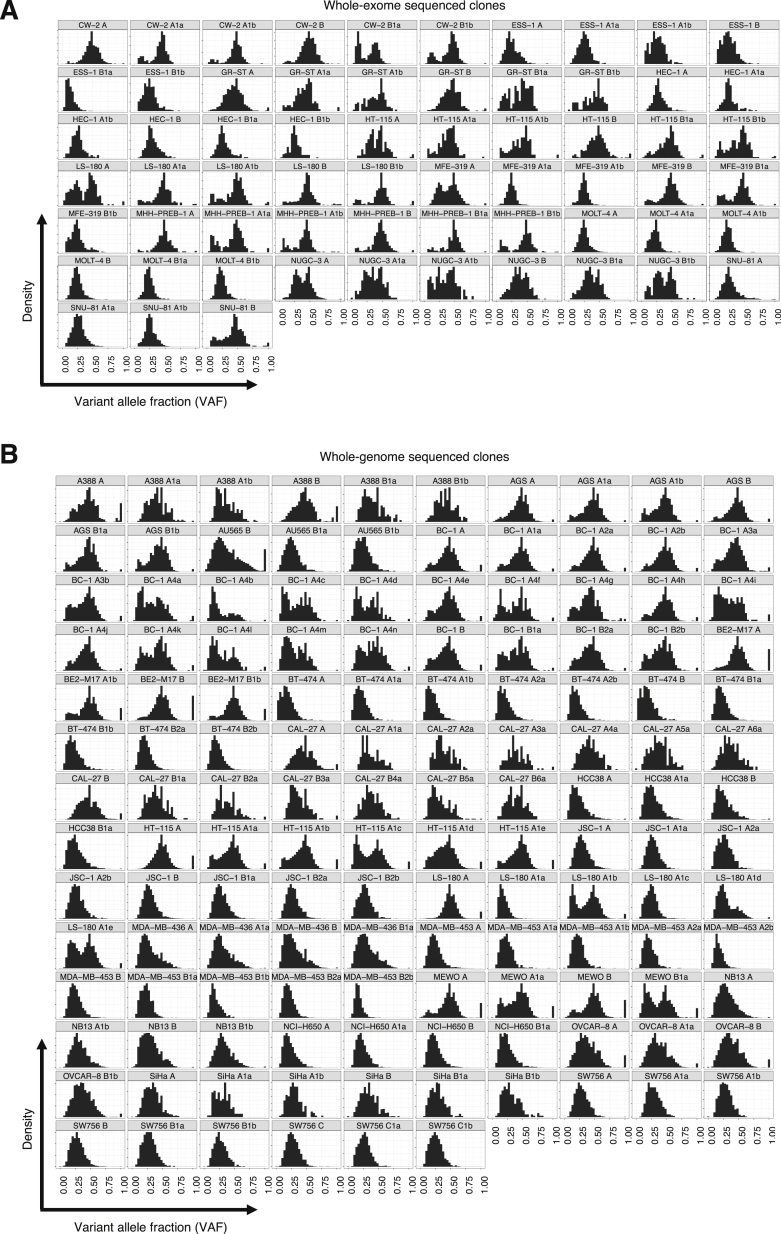
Multiple signatures of somatic mutations have been identified in cancer genomes. Exome sequences of 1,001 human cancer cell lines and 577 xenografts revealed most common mutational signatures, indicating past activity of the underlying processes, usually in appropriate cancer types. To investigate ongoing patterns of mutational-signature generation, cell lines were cultured for extended periods and subsequently DNA sequenced. Signatures of discontinued exposures, including tobacco smoke and ultraviolet light, were not generated in vitro. Signatures of normal and defective DNA repair and replication continued to be generated at roughly stable mutation rates. Signatures of APOBEC cytidine deaminase DNA-editing exhibited substantial fluctuations in mutation rate over time with episodic bursts of mutations. The initiating factors for the bursts are unclear, although retrotransposon mobilization may contribute. The examined cell lines constitute a resource of live experimental models of mutational processes, which potentially retain patterns of activity and regulation operative in primary human cancers.

Keywords: APOBEC deaminases; cancer cell lines; episodic mutagenesis; mutational signatures; xenografts.


Figures

None
Graphical abstract
Figure 1
Figure 1
Mutational Signatures in 1,001 Human Cancer Cell Lines Cancer cell line classes are ordered alphabetically as columns, and mutational signatures are displayed as rows. The cell line classification was modified from the COSMIC Cell Line Project (see Table S2). For patterns of mutational signatures, see Figure S1. The figure format follows the annotation of mutational signatures across a large set of primary human cancers done previously (Alexandrov et al., 2018). We thank the members of the International Cancer Genome Consortium (ICGC) Pan-Cancer Analysis of Whole Genomes (PCAWG) project for the figure design.
Figure S1
Figure S1
Core Set of the Annotated Mutational Signatures, Related to Figures 1, 3, 5, and 6 (A) The core set of the mutational signatures, including the Platinum set of the PCAWG signatures and SBS25 discovered in Hodgkin’s lymphoma cell lines. Signatures are displayed according to the alphabetical 96-substitution classification on horizontal axes, defined by the six color-coded substitution types and sequence context immediately 5′ and 3′ to the mutated base axes (as per panel B). Vertical axes differ between individual signatures for visualization of their patterns (numerical patterns in Table S1) and indicate the percentage of mutations attributed to specific mutation types, adjusted to genome-wide trinucleotide frequencies. We thank PCAWG Mutational Signatures Working Group for the figure. (B) Transcriptional strand bias for SBS25. The mutational signature is displayed according to the 192-subsitution classification, incorporating the six substitution types in color-coded panels, the sequence context immediately 5′ and 3′ to the mutated base and whether the mutated base (in pyrimidine context) is on the transcribed (blue bars) or untranscribed (red bars) strand.
Figure 2
Figure 2
Tracking Mutation Acquisition in a Cancer Cell Line over Time Sequence from the stock cell line captures mostly clonal somatic mutations acquired from the fertilized egg to the establishment of the most recent common ancestor cell (MRCA) of the cell line population (period 1) and residual germline variation due to the non-availability of the reference normal DNA from the same individuals. The somatic mutations were acquired during an unknown period of time, predominantly in vivo during the life of the cancer patient, although a small proportion may have been acquired in vitro if establishment of the MRCA cell occurred in culture. Sequences from the single-cell-derived parent clones include the same set of mutations, with an addition of mutations acquired between the establishment of the MRCA cell of the stock cell line and isolation of the single parent cells (period 2). Duration of this period is unknown as it depends on timing of the establishment of the MRCA cell and hence may include an in vivo time frame. Mutations generated during this period were revealed by subtracting sequences of stock cell lines from those of parent clones. Sequences from single-cell-derived daughter clones include the mutations from their parent clones and, in addition, mutations acquired in vitro during the defined cultivation time frames spanning the two single-cell isolation events (up to 161 days, period 3). Subtraction of the sequences of parent clones from those of daughter clones therefore reveals mutations acquired during the examined in vitro periods. Clones in Figure 3, Figure 4, Figure 5 follow the outlined experimental design, but the numbers of obtained clones and generations may vary.
Figure 3
Figure 3
Activities of Mutational Processes in Human Cancer Cells (A–C) Bars represent the numbers of base substitutions attributed to mutational signatures (patterns in Figure S1) and indels in stock cell lines (A; cancer type abbreviations in Table S2) and their respective parent (B) and daughter or granddaughter clones (C), which were acquired during the indicated time frames following the experimental design in Figure 2. Daughter clones were cultivated for the numbers of days indicated in brackets. Mutational signatures are ordered and colored according to the associated etiologies. Ins/del - rep/micro/other, small insertions/deletions at repetitive regions, microhomology-mediated or other; complex, complex indels. ‡ Only single parent clones from HT-115, LS-180, and AU565 cell lines were subject to whole-genome sequencing, and their sequences were used as proxies for the mutational catalogs of the corresponding stock cell lines (STAR Methods). The high number of mutations in ESS-1 B1a clone is likely due to its establishment from two cells (Figure S7). Daughters were not successfully established from SNU-81_B parent clone.
Figure S2
Figure S2
Expression of Genes Previously Associated with Mutational Signatures in Examined Cancer Cell Lines, Related to Figures 3 and 4 Each panel compares normalized basal expression of indicated genes, between the examined cell line (black) indicated on the top and cell lines from the 1,001 panel, from matching (blue) or other (beige) cell line classes as per their COSMIC classification (Table S2). P values (one-tailed; p < 0.05, ∗∗p < 0.01, ∗∗∗p < 0.001) correspond to the computed z-scores indicating the deviation of the mean expression of the gene in the examined cell line from the groups used in comparisons. (A) Expression of the mismatch repair genes in cell lines with MSI-associated signatures (SBS6, SBS14, SBS15, SBS20, SBS21, SBS26). Cell lines classified as high or low in microsatellite instability (Iorio et al., 2016) were excluded from the control panels. (B) Expression of UNG in cell lines with APOBEC-associated SBS2 and SBS13. (C) Expression of BRCA1 in cell lines with SBS3, associated with defective activity of the homologous-recombination-based double-strand break repair.
Figure S3
Figure S3
Rearrangements and C>T Substitutions at NCG Contexts, Associated with SBS1 and 5-Methylcytosine Deamination, Are Generated over Time, Related to Figure 3 Examination of additional mutation types acquired over time in cell line samples subjected to whole-genome sequencing and experimental design in Figure 2. (A) Bars indicate the numbers of color-coded rearrangement classes acquired during the time periods outlined in Figure 2, in indicated cell lines. Daughter clones were cultivated for the number of days indicated in brackets. ‡ Only single parent clones from HT-115, LS-180 and AU565 cell lines were subject to whole-genome sequencing and their sequences were used as proxies for the mutational catalogs of the corresponding stock cell lines. (B) Each panel displays the fraction of the cytosine (or guanine) bases at 16 possible trinucleotide contexts that were mutated to thymines (or adenines, respectively) over the examined in vitro periods (Period 3; Figure 2), in 100 indicated daughter and granddaughter clones.
Figure 4
Figure 4
Serial Cloning Reveals the Episodic Nature of APOBEC Mutagenesis (A–E) Patterns of base substitutions acquired in five cancer cell lines (A, CAL-27; B, BC-1; C, MDA-MB-453; D, BT-474; E, JSC-1) during the serially examined consecutive time frames (see Figure 2). Numbers of days between individual single-cell cloning events are indicated in blue and represent the time periods allowed for an in vitro acquisition of mutations captured in mutational catalogs of daughter or granddaughter clones (period 3, Figure 2). Mutational catalogs display only mutations at cytosine bases, and their total number is indicated at the top of each panel. x axes indicate the sequence contexts immediately 5′ and 3′ to the mutated cytosine base in the alphabetical order (ACA, ACC, ACG, ACT, CCA, CCC, CCG, CCT, GCA, GCC, GCG, GCT, TCA, TCC, TCG, TCT). y axes indicate the counts of mutations acquired genome-wide (×10−3). See Figure 3 and Table S3 for annotation of mutational signatures in all samples. Indicated clones () share the majority of mutations.
Figure S4
Figure S4
Episodic APOBEC Mutagenesis Is Likely Mediated by APOBEC3A, but It Does Not Depend on Proliferation Rates or Expression of APOBEC Genes in Examined Cell Lines, Related to Figures 3 and 4 (A) Cell divisions were measured for 26 daughter and granddaughter clones from the indicated cell lines and compared to the genome-wide burdens of the indicated signatures acquired during the examined in vitro time frames (Period 3, Figure 2). The best fit, as well the adjusted R2, are indicated in plots where sufficient data points were generated for a statistical comparison. p < 0.05. (B) RNA-sequencing derived transcription levels (FPKM = Fragments Per Kilobase of transcript per Million mapped reads) of APOBEC family members with documented deaminase activity on DNA and preference to induce mutations at TCN context were examined in clones from color-coded cell lines, where RNA-sequencing data was generated (Table S2). Only those clones were considered where sufficient data was generated to accurately derive point estimate expressions of examined genes (STAR Methods). Expression was standardized relative to TATA-binding protein (TBP). Top panel: expression of APOBEC genes in clones from four indicated cell lines. Horizontal bars indicate the median expression level. Bottom panels: Expression of APOBEC genes was compared to the total burden of SBS2 and SBS13 mutations acquired genome-wide in vitro, in daughter and granddaughter clones from indicated cell lines. Robust regression was applied to derive the best estimates for the slopes of the indicated signatures (black lines), 95% confidence intervals (gray shading) and indicated P values, all of which were above the Bonferroni threshold corresponding to significance at the 0.05 level, p = 0.002 (corresponding to 0.05/23, where 23 is the number of successful tests). In some cases, insufficient data points were generated for a statistical comparison (p = NA). (C) Each panel represents enrichment of genome-wide C>T and C>G mutations in indicated clones, at SBS2 and SBS13-specific sequence contexts (TCN, TCA) and at motifs associated with APOBEC3A or APOBEC3B-indeced mutagenesis (YTCN/YTCA and RTCN/RTCA, respectively). N is any base, R is any purine and Y any pyrimidine base. A and B are parent clones, others are daughter and granddaughter clones from the related lineages.
Figure 5
Figure 5
Genome-wide and Localized Foci of APOBEC-Associated Mutations, Kataegis, Are Generated In Vitro (A) Circos plots depict mutations acquired in vitro in exemplar daughter or granddaughter clones. Color-coded base substitutions are plotted as dots in rainfall plots (log intermutation distance), and their total numbers are indicated. Short green lines, short insertions; short red lines, short deletions. Arrows point to examples of kataegis. Central lines indicate rearrangements, color coded and quantified in the bar charts at the bottom. BRCA, breast carcinoma; LYMP, lymphoma B cell. (B) Bars display frequencies of in vitro-acquired kataegis foci and the total burden of genome-wide APOBEC-associated signatures (SBS2 and SBS13) across 100 whole-genome-sequenced daughter and granddaughter clones from indicated cell lines. For durations of the examined in vitro time frames related to the samples displayed in (A) and (B), see Table S2.
Figure S5
Figure S5
Significant Relationships between Somatic Retrotransposition and Mutational Signatures in Cell Lines and Primary Cancers, Related to Figures 3 and 4 (A and B) The upper plots in both panels show the dependence of the observed numbers of mutations assigned to the indicated signatures (dots), and fitted values (lines) estimated using the GLMM Poisson regression model (STAR Methods), on the L1 insertion rate in cell line clones (panel A) and primary cancer samples (panel B). P values which fall below the Bonferroni thresholds corresponding to significance at the 0.05, 0.01, and 0.001 levels are indicated as , ∗∗ and ∗∗∗, respectively. The bottom plots show the estimated effects of cell line (panel A) or primary cancer (panel B) types on the slope of the regression line, in ranked order, against the normal quantiles. For each tumor type, the fitted value is accompanied by a 95% confidence interval. See Table S5 for cell line and primary cancer samples considered in analyses.
Figure 6
Figure 6
Mutational Signatures in Single Cells Indicate Commonly Continuing APOBEC-Associated Mutagenesis (A) Bars represent the numbers of base substitutions (left) and mutational signatures (right) in whole-genome-sequenced stock cell lines and their single cells (cancer type abbreviations in Table S2). Mutations presenting at <50% VAF (variant allele fraction) were excluded from mutational catalogs from single cells, as they mostly formed patterns of signatures scE and scF, likely introduced during the process of the single-cell DNA preparation (STAR Methods; see Figure S6A for mutational signatures annotation using complete catalogs). (B) Mutational signatures extracted from the complete mutational catalogs from 36 whole-genome-sequenced single cells. Each signature is displayed according to the 96-substitution classification on horizontal axis, defined by the six color-coded substitution types and sequence context immediately 5′ and 3′ to the mutated base. Vertical axes show the percentage of mutations attributed to specific mutation types.
Figure S6
Figure S6
Signatures of False-Positive Somatic Mutations Are Present in DNA Prepared from Single Cells, Related to Figure 6 (A) Top two panels: bars represent the percentage of base substitutions attributed to color-coded signatures in complete (rather than filtered, see Figure 6A) mutational catalogs from whole-genome sequenced stock cell lines from the denoted cancer classes (abbreviations in Table S2) and their single cells. The bottom panel represents the color-coded fractions of minor alleles at examined heterozygous SNP loci, in indicated single cells, which were (i) lost due to WGA-associated locus dropouts, (ii) lost due to WGA-associated allele dropouts or (iii) fall under the detection threshold for identification of base substitutions due to WGA-associated imbalanced amplification. (B) Spectra of mutations identified genome-wide in two exemplar stock cell lines (top panels) and in their corresponding single cells (bottom panels), genome-wide or within haploid regions at the indicated variant allele fractions (VAF). Each panel is displayed according to the 96-substitution classification on the horizontal axis defined by the six color-coded substitution types and sequence context immediately 5′ and 3′ to the mutated base. Order of the sequence context follows the standard alphabetical representation (see Figure 6B). Total number of base substitutions is indicated on the top of each panel. C>T variants at NCG contexts and T>C mutations at ATN contexts in stock cell lines largely represent germline variation due to the non-availability for most cancer cell lines of normal DNAs from the same individuals.
Figure S7
Figure S7
Variant Allele Fraction Distribution Plots for Cell Line Clones, Related to Figure 3, Figure 4, Figure 5 (A and B) Distribution plots showing frequencies of the variant alleles fractions (VAFs) of mutations that remain after the filtering steps (STAR Methods) in indicated clones analyzed by whole-exome (panel A) or whole-genome sequencing (panel B). VAF peaks often deviate from 50%, expected for clonal heterozygous somatic mutations in a diploid genome, because cancer cell lines are often polyploid and heterozygous copy number changes across the genome can further modulate the distribution of the VAF. Bimodal distributions and subclonal peaks can arise from mixed effects of mutations being acquired on different copy number states of the genome and/or subclonally. Minor proportion of mutations presenting at 100% of the reads in some clones can reflect loss of heterozygosity at the loci of the newly acquired mutations or residual germline variants, mainly in parent clones that were compared against the unmatched normal human genome (STAR Methods).

Comment in

Similar articles

Cited by

References

    1. Alexandrov L.B., Jones P.H., Wedge D.C., Sale J.E., Campbell P.J., Nik-Zainal S., Stratton M.R. Clock-like mutational processes in human somatic cells. Nat. Genet. 2015;47:1402–1407. - PMC - PubMed
    1. Alexandrov L.B., Kim J., Haradhvala N.J., Huang M.N., Ng A.W.T., Boot A., Covington K.R., Gordenin D.A., Bergstrom E., Lopez-Bigas N. The Repertoire of Mutational Signatures in Human Cancer. bioRxiv. 2018
    1. Alexandrov L.B., Nik-Zainal S., Wedge D.C., Aparicio S.A., Behjati S., Biankin A.V., Bignell G.R., Bolli N., Borg A., Børresen-Dale A.L., Australian Pancreatic Cancer Genome Initiative. ICGC Breast Cancer Consortium. ICGC MMML-Seq Consortium. ICGC PedBrain Signatures of mutational processes in human cancer. Nature. 2013;500:415–421. - PMC - PubMed
    1. Alexandrov L.B., Nik-Zainal S., Wedge D.C., Campbell P.J., Stratton M.R. Deciphering signatures of mutational processes operative in human cancer. Cell Rep. 2013;3:246–259. - PMC - PubMed
    1. Auer P.L., Doerge R.W. Statistical design and analysis of RNA sequencing data. Genetics. 2010;185:405–416. - PMC - PubMed

Publication types