. 2019 Mar 8;17(1):22.
doi: 10.1186/s12915-019-0631-y.

Mesencephalic origin of the inferior lobe in zebrafish

Affiliations

Mesencephalic origin of the inferior lobe in zebrafish

Solal Bloch et al. BMC Biol. .

Abstract

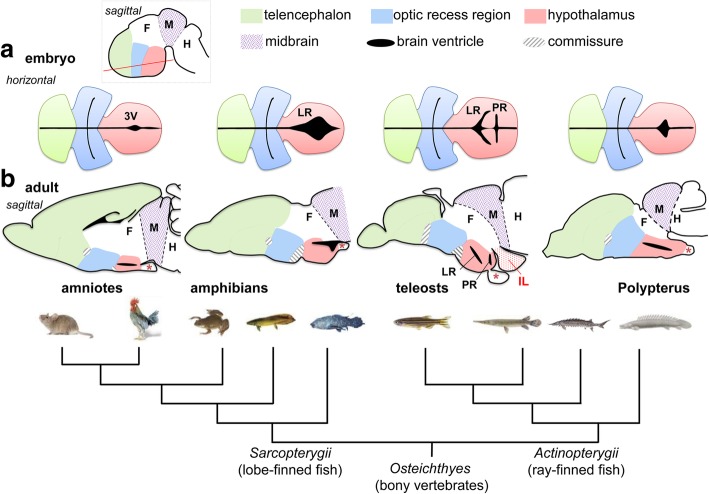
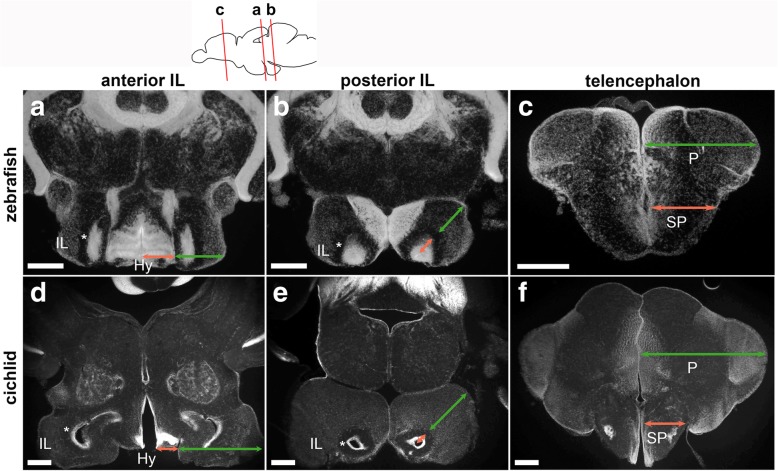
Background: Although the overall brain organization is shared in vertebrates, there are significant differences within subregions among different groups, notably between Sarcopterygii (lobe-finned fish) and Actinopterygii (ray-finned fish). Recent comparative studies focusing on the ventricular morphology have revealed a large diversity of the hypothalamus. Here, we study the development of the inferior lobe (IL), a prominent structure forming a bump on the ventral surface of the teleost brain. Based on its position, IL has been thought to be part of the hypothalamus (therefore forebrain).

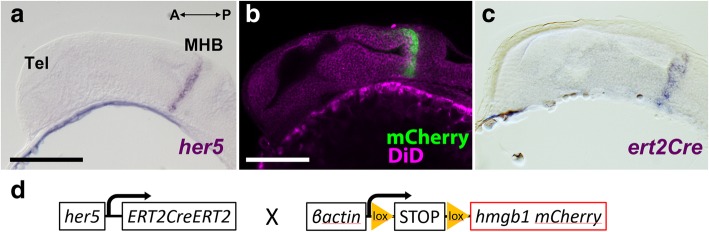
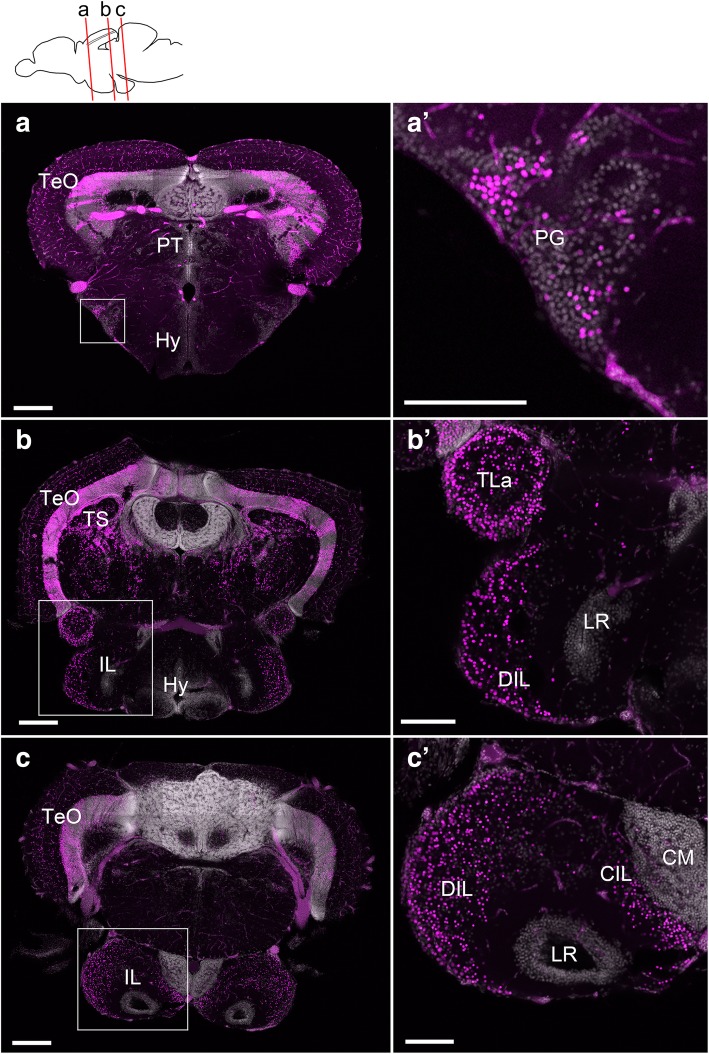
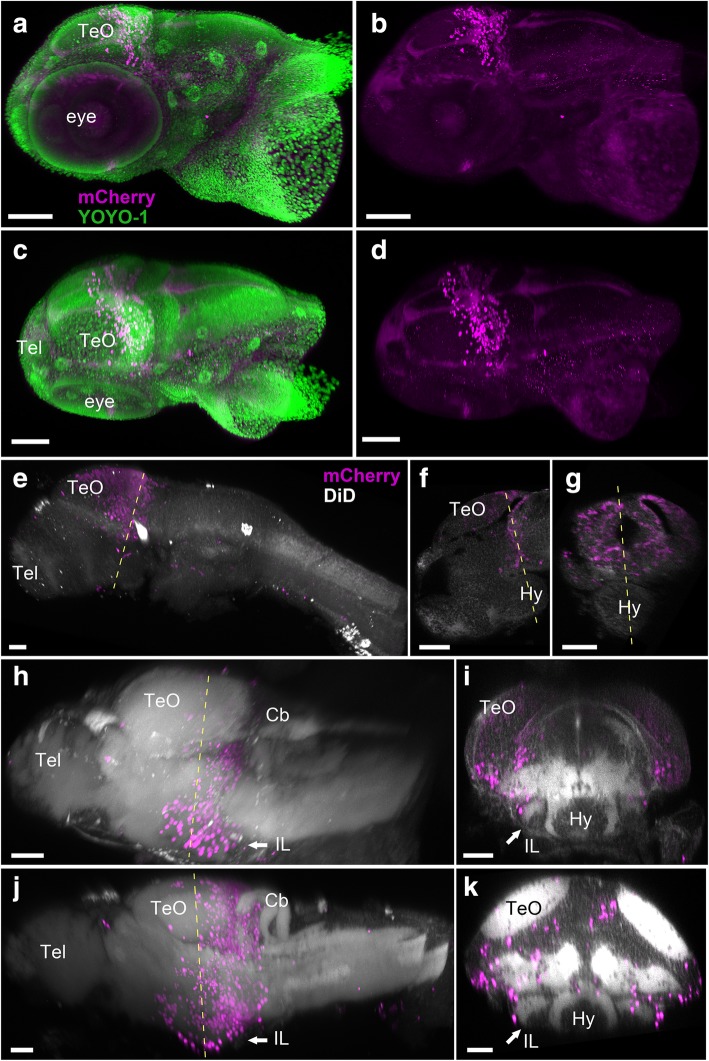
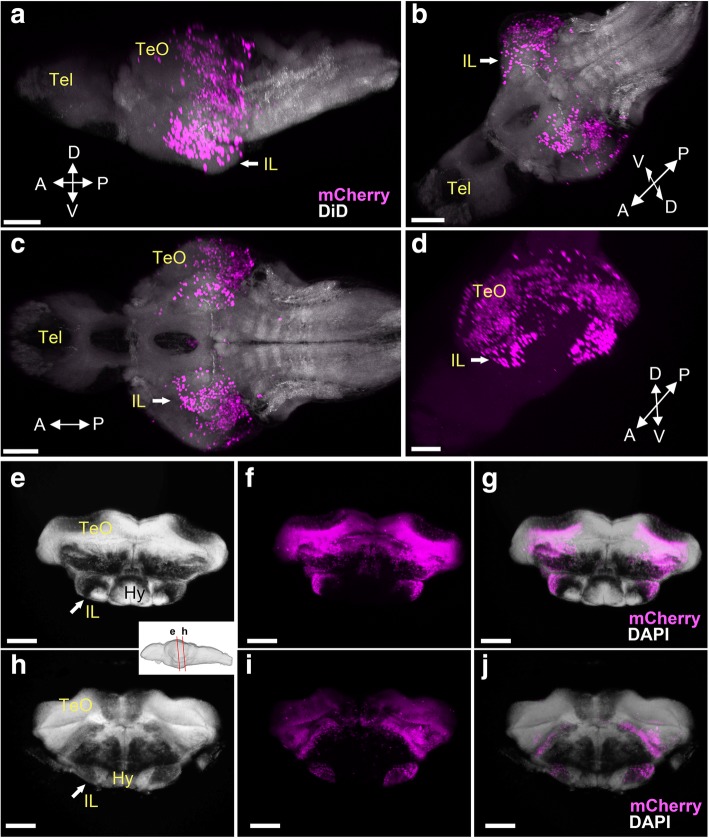
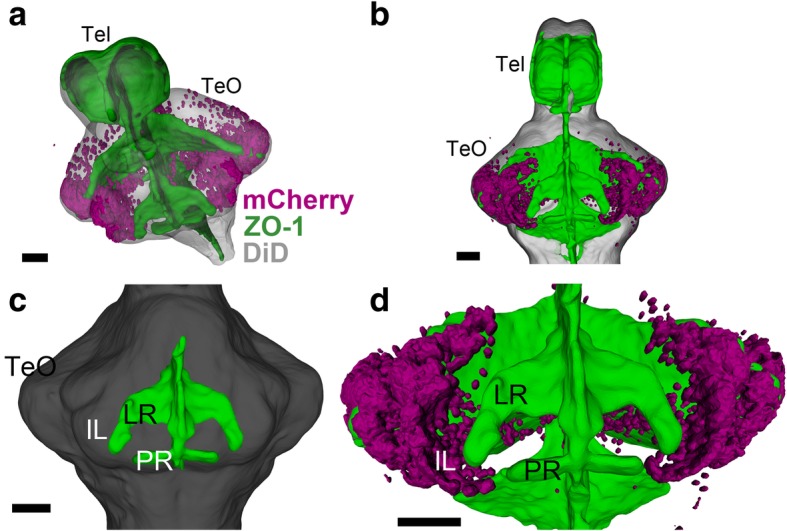
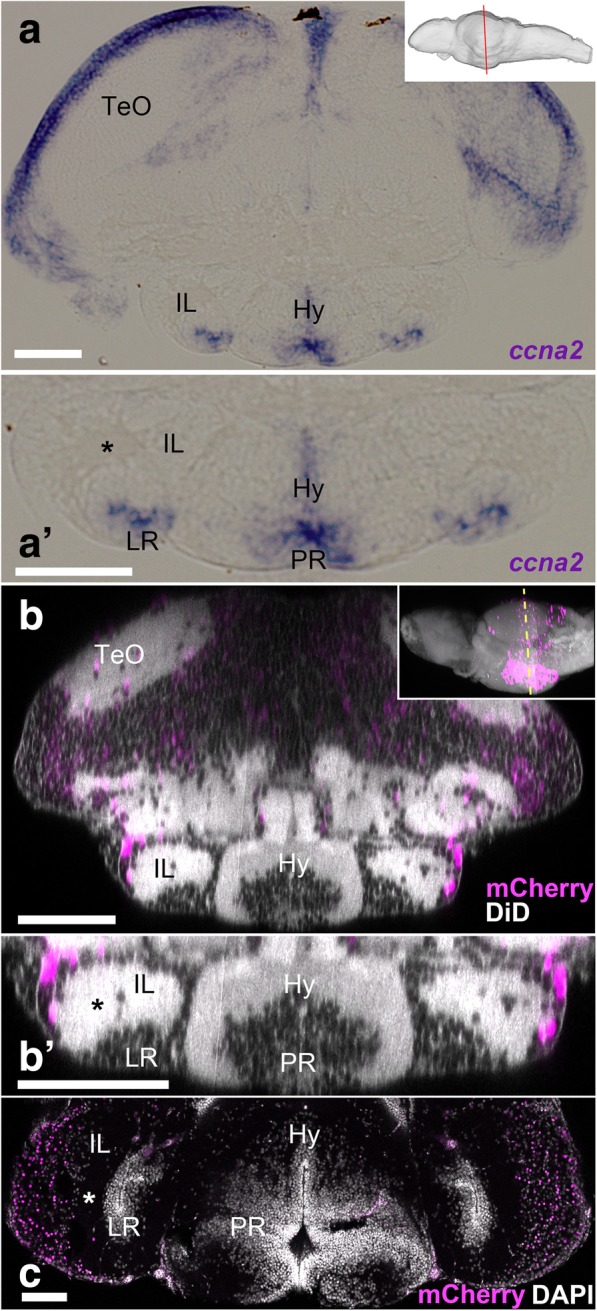
Results: Taking advantage of genetic lineage-tracing techniques in zebrafish, we reveal that cells originating from her5-expressing progenitors in the midbrain-hindbrain boundary (MHB) participate in the formation of a large part of the IL. 3D visualization demonstrated how IL develops in relation to the ventricular system. We found that IL is constituted by two developmental components: the periventricular zone of hypothalamic origin and the external zone of mesencephalic origin. The mesencephalic external zone grows progressively until adulthood by adding new cells throughout development.

Conclusion: Our results disprove a homology between the IL and the mammalian lateral hypothalamus. We suggest that the IL is likely to be involved in multimodal sensory integration rather than feeding motivation. The teleost brain is not a simpler version of the mammalian brain, and our study highlights the evolutionary plasticity of the brain which gives rise to novel structures.

Keywords: Cell lineage; Comparative neuroanatomy; Development; Evolution; Forebrain; Homology; Midbrain; Teleost; Ventricle; Vertebrate.


Conflict of interest statement

Ethics approval

All experimental protocols and care of laboratory animals were conducted in compliance with the official regulatory standards and approval of the French Government (reference document n°APAFIS#1286- 2015062616102603 v5).

Consent for publication

Not applicable.

Competing interests

The authors declare that they have no competing interests.

Publisher’s Note

Springer Nature remains neutral with regard to jurisdictional claims in published maps and institutional affiliations.

Figures

Fig. 1
Fig. 1
Evolution of the hypothalamic ventricles in bony vertebrates. Schematic drawing of embryonic (a) and adult (b) brains of rodent, frog, zebrafish, and Polypterus is shown above a phylogenetic tree of the Osteichthyes (bony vertebrates). a Horizontal view of embryonic brains through the anterior forebrain, highlighting the morphological diversity of the hypothalamic recesses (ventricular zones are shown in black). The horizontal section level (red line) is displayed in the top left panel (dotted square) with in a schematic embryonic brain. b Sagittal sections of adult brains. The inferior lobe (IL) is a brain structure present in teleosts but not in tetrapods or in Polypterus. The asterisks indicate hypophysis in each animal. Abbreviations: 3 V third ventricle, F forebrain, H hindbrain, IL inferior lobe, LR lateral recess, M midbrain, PR posterior recess
Fig. 2
Fig. 2
Verification of the expression profile of the zebrafish transgenic line used in this study. ac Sagittal sections of 24 hpf embryos showing that expression of her5 and ert2Cre is restricted to the MHB. The anterior part of the embryo is on the left. a In situ hybridization (ISH) of her5 confirms its specific expression in the MHB (purple). b Expression of mCherry (green) in a transgenic line Tg(her5:mCherry), which is identical to the her5 ISH pattern. The morphology is shown with DiD fiber labeling (magenta). c The expression pattern of ert2Cre is also identical to the her5 ISH (a) and mCherry in Tg(her5:mCherry) (b). d A simplified schema of the constructs of Tg(her5:ERT2CreERT2) and Tg(βact:lox-stop-lox-hmgb1:mCherry) which were used in this cell lineage study. Scale bars, 100 μm. Abbreviations: MHB midbrain-hindbrain boundary, Tel telencephalon
Fig. 3
Fig. 3
Localization of the mCherry-positive cells in the adult brain of Tg(her5:ERT2CreERT2;βact:lox-stop-lox-hmgb1:mCherry) zebrafish treated with tamoxifen at 24 hpf. ac Confocal images of frontal sections showing global views of the mCherry distribution (Z-projection, 5 μm for a and 10 μm for b and c). The mCherry-positive cells are shown in magenta, and DAPI nuclear labeling is shown in gray. The plane of each section is indicated in the schematic drawing on the top. a’c’ Higher magnifications of the areas squared in ac, showing the preglomecular nucleus (PG; a’) and the inferior lobe (IL; b’, c’). Abbreviations: CM corpus mamillare, CIL central nucleus of the inferior lobe, DIL diffuse nucleus of the inferior lobe, Hy hypothalamus, IL inferior lobe, LR lateral recess, PG preglomerular nucleus, PT pretectum, TeO optic tectum, TLa torus lateralis, TS torus semicircularis. Scale bars: ac, 200 μm; a’c’, 100 μm
Fig. 4
Fig. 4
Localization of the mCherry-positive cells in young larval brains of Tg(her5:ERT2CreERT2;βact:lox-stop-lox-hmgb1:mCherry) zebrafish treated with tamoxifen at 24 hpf. Anterior to the left for ad, e, h, and j. ad 3D reconstruction from confocal images of a whole head of 3 dpf larva. mCherry-positive cells are shown in magenta, and YOYO-1, a nuclear marker, is shown in green. a, b Side view of the larval head with (a) and without (b) YOYO-1 labeling. c, d Top view of the larval head with (c) and without (d) YOYO-1 labeling. The mCherry-positive cells are still close to the MHB at this stage. Some cells are starting to migrate anteriorly, but there are no mCherry-positive cells in the forebrain or in other brain areas. ek 3D reconstruction from confocal images of dissected brains of 3 dpf (eg), 5 dpf (h, i), and 7 dpf (j, k) larvae. mCherry-positive cells are shown in magenta, and DiD fiber labeling is shown in gray. e A whole brain at 3 dpf is shown in lateral view. f A sagittal section through the same specimen. g A frontal section. The hypothalamus (Hy) is extending in ventral position below the midbrain and is devoid of mCherry-positive cells. h A whole brain at 5 dpf is shown in lateral view. i A frontal section from the same brain showing the first appearance of the inferior lobe (IL; arrow), with a few mCherry-positive cells at the periphery of the structure. j A whole brain at 7 dpf is shown in lateral view. k A frontal section from the same brain showing the growing IL (arrow), with more mCherry-positive cells added laterally. Abbreviations: Cb cerebellum, Hy hypothalamus, IL inferior lobe, TeO optic tectum, Tel telencephalon. Scale bars: ad, 100 μm. ek, 50 μm
Fig. 5
Fig. 5
Localization of the mCherry-positive cells in late larval brains of Tg(her5:ERT2CreERT2;βact:lox-stop-lox-hmgb1:mCherry) zebrafish treated with tamoxifen at 24 hpf. ad 3D reconstruction from confocal images of a 14 dpf brain, showing mCherry-positive cells in magenta (ad) and DiD fiber labeling in gray (ac). Four different views are presented: lateral (a), ventral (c), and two different obliques (b, d). Arrows point at the IL on one hemisphere. The IL bulging can be seen in a and b, while d displays the continuity of the mCherry-positive cells in the IL with other midbrain structures. ej Frontal sections of a 19 dpf brain, showing mCherry-positive cells in magenta and DAPI nuclear labeling in gray. IL is clearly visible in frontal sections (arrows), at two different antero-posterior levels (indicated in sagittal view in the white box). Anteriorly (eg) the mCherry-positive cells are on the lateral part of IL that appears continuous with more dorsal midbrain structures, while posteriorly (hj) a cluster of the mCherry-positive cells is seemingly detached from the dorsal midbrain structures. At the posterior IL, most of the IL is mCherry positive. Scale bars, 80 μm. Abbreviations: Hy hypothalamus, IL inferior lobe, TeO optic tectum, Tel telencephalon
Fig. 6
Fig. 6
Developing IL in relation to the ventricular morphology. 3D reconstruction of image segmentation from confocal images of a 14 dpf zebrafish brain. ZO-1 (ventricular labeling) is shown in green (ad), mCherry-positive cells are shown in magenta (a, b, d), and DiD fiber labeling is shown in gray (ac). a, b Oblique (a) and ventral (b) views of the brain, showing the general distribution of the mCherry-positive cells in relation to the ventricular organization. c A ventral view highlighting the lateral recess (LR) and the posterior recess (PR) (anterior of the brain to the top). d A higher magnification of b focusing on the mCherry cells in relation to the LR. The mCherry cells are continuous from the tectal region, but they are devoid of proximity of the ventricular zone. Scale bars, 50 μm. Abbreviations: IL inferior lobe, LR lateral recess, PR posterior recess, Tel telencephalon, TeO optic tectum. The interactive version of this figure can be found at https://zenodo.org/record/2556246
Fig. 7
Fig. 7
Comparison of juvenile and adult IL in zebrafish. a, a’ Frontal section of the 14 dpf brain showing the transcripts of ccna2. The plane of the section is indicated in sagittal view in the right upper corner. a’ A higher magnification of the ventral part of a containing IL. The expression of ccna2 is found around LR. b, c Brains of Tg(her5:ERT2CreERT2;βact:lox-stop-lox-hmgb1:mCherry) zebrafish treated with tamoxifen at 24 hpf.  b, b’ Frontal view of the 14 dpf brain which was obtained from 3D reconstruction of confocal images, showing mCherry-positive cells in magenta and DiD fiber labeling in gray. The plane of the section is indicated in sagittal view in the right upper corner. b’ A higher magnification of the ventral part of b containing IL. c Frontal section of the adult IL showing mCherry-positive cells in magenta and DAPI nuclear labeling in gray. Note that the gray represents DiD fiber labeling in b and b’, while it corresponds to DAPI nuclear labeling in c. The asterisks indicate the cell-free fiber zone that separates the mCherry-positive external zone and the ventricular zone (around LR). The mCherry-positive cells are much abundant in the adult IL than in the larval IL. Scale bar, 90 μm. Abbreviations: Hy hypothalamus, IL inferior lobe, LR lateral recess, PR posterior recess, TeO optic tectum
Fig. 8
Fig. 8
Localization of her5 progenies following the induction at juvenile stages. ai The brains of Tg(her5:mCherry) zebrafish to indicate the her5 expression at late larval to juvenile stages. jo The brains of Tg(her5:ERT2CreERT2;βact:lox-stop-lox-hmgb1:mCherry) to indicate their progenies in the adult (3 mpf) brains. ac 3D reconstruction from confocal images of a 14 dpf brain, showing mCherry (representing her5 expression) in green and DiD fiber labeling in magenta. Yellow arrows indicate the anterior her5-expressing domain, while blue arrows indicate the posterior her5-expressing domain. a The whole brain in lateral view, b in ventral view, and c in a frontal section from the same 3D visualization. di Frontal sections of juvenile brains of Tg(her5:mCherry) (d, e at 4 wpf, f, g at 6 wpf, and h, i at 8 wpf), showing mCherry (representing her5 expression) in magenta and DAPI nuclear labeling in gray. The right half of the brain is demonstrated without DAPI to better visualize the mCherry signals. d, f, h The sections containing the anterior her5-expressing domain (yellow arrows). e, g, i The sections containing the posterior her5-expressing domain (blue arrows). jo Frontal sections of 3 mpf brains of Tg(her5:ERT2CreERT2;βact:lox-stop-lox-hmgb1:mCherry), after tamoxifen induction at the corresponding juvenile stages (j, k are the brain induced at 4 wpf, l, m at 6 wpf, and n, o at 8 wpf). j, l, n The sections showing the anterior IL. k, m, o The posterior IL. Note that the mCherry labelings (magenta) in these sections represent progenies of the cells shown in di. Scale bar: ac, 50 μm; dg 100 μm; h, i 200 μm; jo, 350 μm. Abbreviations: Cb cerebellum, Hy hypothalamus, IL inferior lobe, Tel telencephalon, TeO optic tectum
Fig. 9
Fig. 9
Comparison of the zebrafish and cichlid brains. Frontal sections of the brains of zebrafish (ac) and cichlid (df), showing DAPI nuclear labeling in gray. The plane of the zebrafish sections is indicated in the schematic drawing on the top, and comparable level of the cichlid brain is shown below each zebrafish section. a, d Anterior IL. b, e The posterior IL. c, f The telencephalon. The relative size of the cichlid IL (d, e) is much larger than that of the zebrafish IL (a, b). It is prominent in comparison with the size of the hypothalamus (Hy; the size indicated in red arrows in a and d) that is located medial to the IL (the size indicated in green arrows in a and d). Also, the relative size of the external zone (the size indicated in green arrows in b and e) in comparison with the internal ventricular zone (the size indicated in red arrows in b and e) is much larger in cichlid. The asterisks (*) in a, b, d, and e indicate a cell-free fiber zone separating the external and internal zones. The relative size of the pallium (P; the size indicated in green arrows in c and f) in comparison with the subpallium (SP; the size indicated in red arrows in c and f) is much larger in cichlid than in zebrafish. Scale bar: a-c, 200 μm; df, 350 μm. Abbreviations: Hy hypothalamus, IL inferior lobe, P pallium, SP subpallium
Fig. 10
Fig. 10
Schematic drawing summarizing development of IL. a Horizontal views of the zebrafish anterior brain, highlighting the development of the lateral recess (LR). LR elongates caudolaterally and covers the posterior recess (PR), forming IL. The ventricular zone of IL around the LR is hypothalamic (pink), while the external zone of IL is formed by cells migrating from the midbrain (purple dots). b Frontal views of IL showing maturation of the external zone of IL during juvenile stages. The external zone grows by insertion of cells originated from the midbrain. The red, blue, and yellow circles represent mesencephalic cells added at different time points during development

References

    1. Echevarría D, Vieira C, Gimeno L, Martínez S. Neuroepithelial secondary organizers and cell fate specification in the developing brain. Brain Res Brain Res Rev. 2003;43:179–191. doi: 10.1016/j.brainresrev.2003.08.002. - DOI - PubMed
    1. Kiecker C, Lumsden A. Compartments and their boundaries in vertebrate brain development. Nat Rev Neurosci. 2005;6:553–564. doi: 10.1038/nrn1702. - DOI - PubMed
    1. Puelles L, Harrison M, Paxinos G, Watson C. A developmental ontology for the mammalian brain based on the prosomeric model. Trends Neurosci. 2013;36:570–578. doi: 10.1016/j.tins.2013.06.004. - DOI - PubMed
    1. Affaticati P, Yamamoto K, Rizzi B, Bureau C, Peyrieras N, Pasqualini C, et al. Identification of the optic recess region as a morphogenetic entity in the zebrafish forebrain. Sci Rep. 2015;5:8738. doi: 10.1038/srep08738. - DOI - PMC - PubMed
    1. Yamamoto K, Bloch S, Vernier P. New perspective on the regionalization of the anterior forebrain in Osteichthyes. Develop Growth Differ. 2017;59:175–187. doi: 10.1111/dgd.12348. - DOI - PMC - PubMed

Publication types

LinkOut - more resources