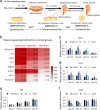
Differentiation roadmap of embryonic Sertoli cells derived from mouse embryonic stem cells
- PMID: 30850007
- PMCID: PMC6408820
- DOI: 10.1186/s13287-019-1180-6
Differentiation roadmap of embryonic Sertoli cells derived from mouse embryonic stem cells
Abstract
Background: Embryonic Sertoli cells (eSCs) play an important role in sex determination and in male gonad development which makes them a very useful cell type for therapeutic applications. However, the deriving mechanism of Sertoli cells has been unclear and challenging to create a large number of quality eSCs. Therefore, this study aimed to create the eSCs induced from mouse embryonic stem (mES) cells by regulating defined factors and to explore the relevant regulatory mechanism.
Methods: Six inducing factors, Sry, Sox9, SF1, WT1, GATA4, and Dmrt1, were respectively transduced into mES cells by lentiviral infection according to the experimental design. The test groups were identified by development stage-specific markers, AMH, Emx2, SF1, and FasL, using flow cytometry. Induced eSCs were determined by FasL and AMH biomarkers under immunofluorescence, immunocytochemistry, and flow cytometry. Moreover, the pluripotency markers, gonad development-related markers, epithelial markers and mesenchymal markers in test groups were transcriptionally determined by qPCR.
Results: In this study, the co-overexpression of all the six factors effectively produced a large population of eSCs from mES cells in 35 days of culturing. These eSCs were capable of forming tubular-like and ring-like structures with functional performance. The results of flow cytometry indicated that the upregulation of GATA4 and WT1 contributed to the growth of somatic cells in the coelomic epithelium regarded as the main progenitor cells of eSCs. Whereas, SF1 facilitated the development of eSC precursor cells, and Sry and Sox9 promoted the determination of male development. Moreover, the overexpression of Dmrt1 was essential for the maintenance of eSCs and some of their specific surface biomarkers such as FasL. The cellular morphology, biomarker identification, and transcriptomic analysis aided in exploring the regulatory mechanism of deriving eSCs from mES cells.
Conclusion: Conclusively, we have elucidated a differentiation roadmap of eSCs derived from mES cells with a relevant regulatory mechanism. Through co-overexpression of all these six factors, a large population of eSCs was successfully induced occupying 24% of the whole cell population (1 × 10⁵ cells/cm2). By adopting this approach, a mass of embryonic Sertoli cells can be generated for the purpose of co-culture technique, organ transplantation, gonadal developmental and sex determination researches.
Keywords: Embryonic Sertoli cells; Embryonic stem cells; Gonadogenesis; Lentiviral transduction; Male determinant factors; Molecular mechanism.
Conflict of interest statement
Ethics approval and consent to participate
The authors declare that this is not a study involving human participants and reporting health related outcomes.
Consent for publication
Not applicable.
Competing interests
The authors declare that they have no competing interests.
Publisher’s Note
Springer Nature remains neutral with regard to jurisdictional claims in published maps and institutional affiliations.
Figures


Similar articles
-
Inducing Non-genetically Modified Induced Embryonic Sertoli Cells Derived From Embryonic Stem Cells With Recombinant Protein Factors.Front Cell Dev Biol. 2021 Jan 25;8:533543. doi: 10.3389/fcell.2020.533543. eCollection 2020. Front Cell Dev Biol. 2021. PMID: 33585437 Free PMC article.
-
Mapping molecular pathways for embryonic Sertoli cells derivation based on differentiation model of mouse embryonic stem cells.Stem Cell Res Ther. 2020 Feb 26;11(1):85. doi: 10.1186/s13287-020-01600-2. Stem Cell Res Ther. 2020. PMID: 32102677 Free PMC article.
-
In Vitro Derivation of Functional Sertoli-Like Cells from Mouse Embryonic Stem Cells.Cell Transplant. 2018 Oct;27(10):1523-1534. doi: 10.1177/0963689718797053. Epub 2018 Sep 14. Cell Transplant. 2018. PMID: 30215278 Free PMC article.
-
Unveiling the roles of Sertoli cells lineage differentiation in reproductive development and disorders: a review.Front Endocrinol (Lausanne). 2024 Apr 18;15:1357594. doi: 10.3389/fendo.2024.1357594. eCollection 2024. Front Endocrinol (Lausanne). 2024. PMID: 38699384 Free PMC article. Review.
-
Sex-determining genes in mice: building pathways.Novartis Found Symp. 2002;244:4-18; discussion 18-22, 35-42, 253-7. Novartis Found Symp. 2002. PMID: 11990796 Review.
Cited by
-
Testicular somatic cell-like cells derived from embryonic stem cells induce differentiation of epiblasts into germ cells.Commun Biol. 2021 Jun 28;4(1):802. doi: 10.1038/s42003-021-02322-8. Commun Biol. 2021. PMID: 34183774 Free PMC article.
-
Inducing Non-genetically Modified Induced Embryonic Sertoli Cells Derived From Embryonic Stem Cells With Recombinant Protein Factors.Front Cell Dev Biol. 2021 Jan 25;8:533543. doi: 10.3389/fcell.2020.533543. eCollection 2020. Front Cell Dev Biol. 2021. PMID: 33585437 Free PMC article.
-
Mapping molecular pathways for embryonic Sertoli cells derivation based on differentiation model of mouse embryonic stem cells.Stem Cell Res Ther. 2020 Feb 26;11(1):85. doi: 10.1186/s13287-020-01600-2. Stem Cell Res Ther. 2020. PMID: 32102677 Free PMC article.
-
The conditional deletion of steroidogenic factor 1 (Nr5a1) in Sox9-Cre mice compromises testis differentiation.Sci Rep. 2021 Feb 24;11(1):4486. doi: 10.1038/s41598-021-84095-y. Sci Rep. 2021. PMID: 33627800 Free PMC article.
-
Insights Into the Roles of GATA Factors in Mammalian Testis Development and the Control of Fetal Testis Gene Expression.Front Endocrinol (Lausanne). 2022 May 26;13:902198. doi: 10.3389/fendo.2022.902198. eCollection 2022. Front Endocrinol (Lausanne). 2022. PMID: 35692407 Free PMC article. Review.
References
-
- Skinner MK, Griswold MD. Sertoli Cell Biology. Amsterdam: Boston Elsevier Academic Press; 2005.
Publication types
MeSH terms
Substances
LinkOut - more resources
Full Text Sources
Other Literature Sources
Research Materials
Miscellaneous

