. 2019 Mar 8;10(1):82.
doi: 10.1186/s13287-019-1191-3.

In vitro expansion affects the response of human bone marrow stromal cells to irradiation

Affiliations

In vitro expansion affects the response of human bone marrow stromal cells to irradiation

Yang Xiang et al. Stem Cell Res Ther. .

Abstract

Background: Bone marrow stromal cells (BMSCs) are extensively used in regeneration therapy and cytology experiments simulate how BMSCs respond to radiation. Due to the small number and the heterogeneity of primary isolated BMSCs, extensive in vitro expansion is usually required before application, which affects the cellular characteristics and gene expression of BMSCs. However, whether the radiation response of BMSCs changes during in vitro expansion is unclear.

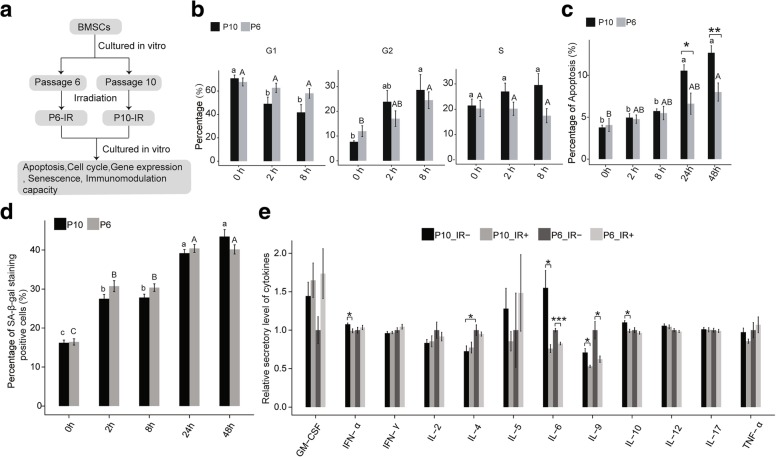
Methods: In this study, BMSCs were passaged in vitro and irradiated at passage 6 (P6) and passage 10 (P10). Then, apoptosis, the cell cycle, senescence, the cytokine secretion and the gene expression profile were analysed for the P6, P10, and non-irradiated (control) BMSCs at different post-irradiation time points.

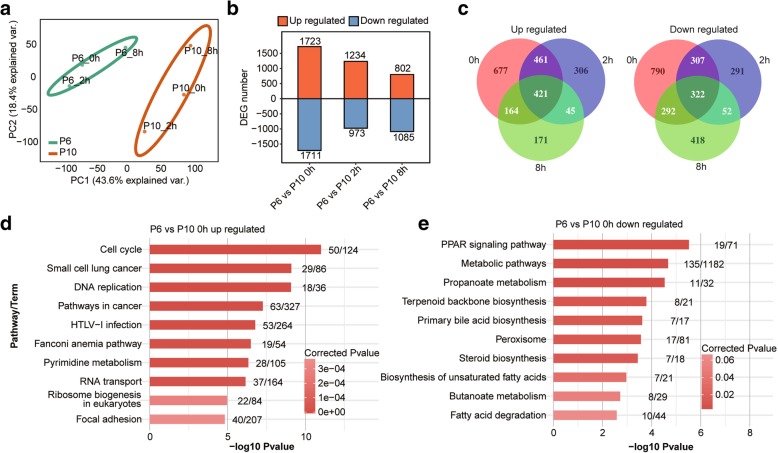
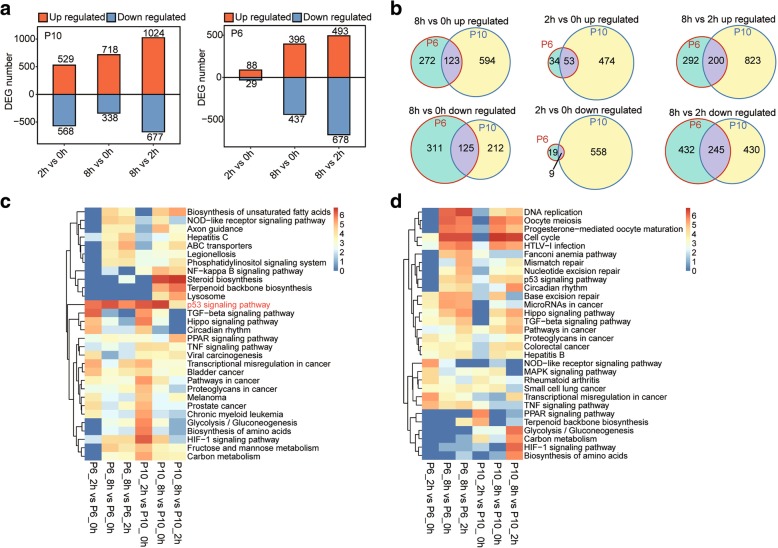
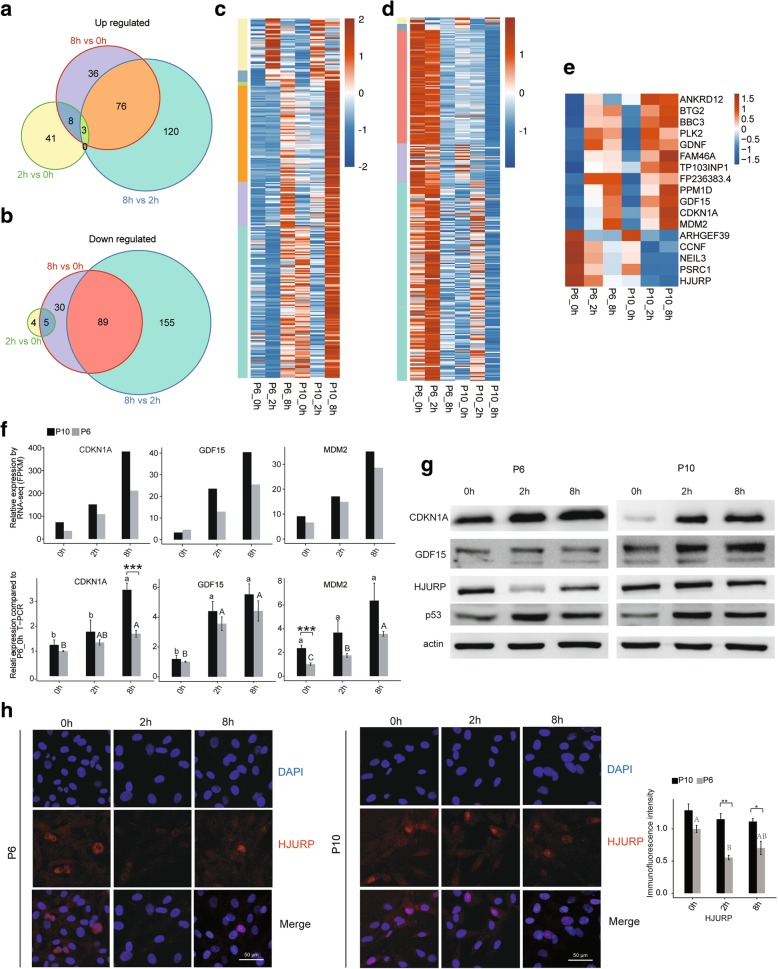
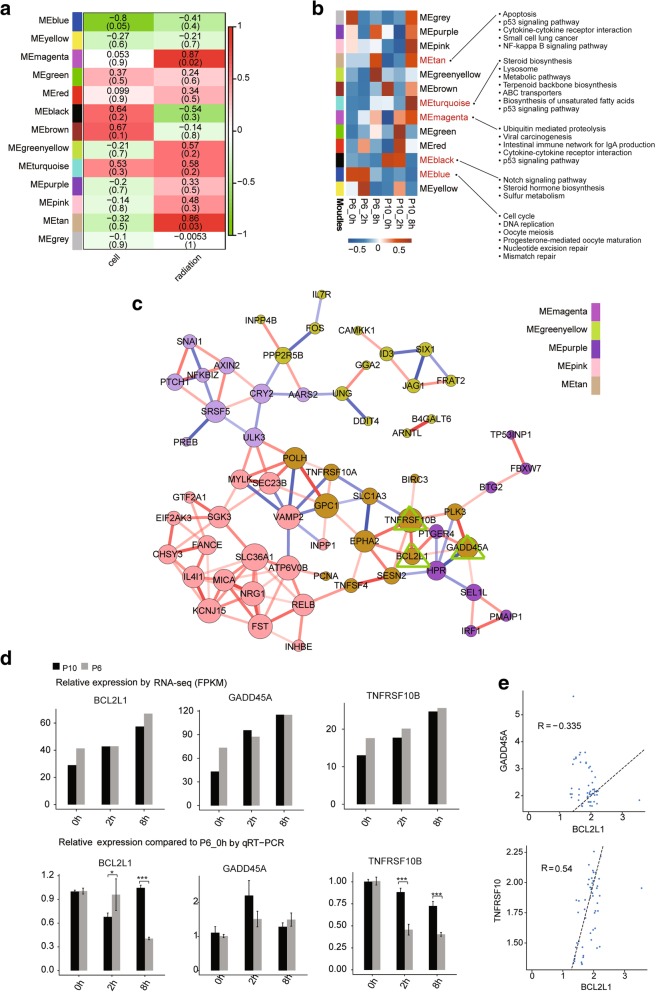
Results: The P6 BMSCs had a lower percentage of apoptotic cells than the P10 BMSCs at 24 and 48 h post-irradiation but not compared to that of the controls at 2 and 8 h post-irradiation. The P6 BMSCs had a lower percentage of cells in S phase and a higher percentage in G1 phase than the P10 BMSCs at 2 and 8 h post-irradiation. The radiation had similar effects on the senescent cell level and impaired immunomodulation capacity of the P6 and P10 BMSCs. Regardless of whether they were irradiated, the P6 and P10 BMSCs always expressed a distinctive set of genes. The upregulated genes were enriched in pathways including the cell cycle, DNA replication and oocyte meiosis. Then, a subset of conserved irradiation response genes across the BMSCs was identified, comprising 12 differentially upregulated genes and 5 differentially downregulated genes. These genes were especially associated with the p53 signaling pathway, DNA damage and DNA repair. Furthermore, validation experiments revealed that the mRNA and protein levels of these conserved genes were different between the P6 and P10 BMSCs after irradiation. Weighted gene co-expression network analysis supported these findings and further revealed the effects of cell passage on the irradiation response in BMSCs.

Conclusion: The results indicated that cell passage in vitro affected the irradiation response of BMSCs via molecular mechanisms that mediated differences in apoptosis, the cell cycle, senescence and the cytokine secretion. Thus, accurate cell passage information is not only important for transplantation therapy but also for future studies on the radiation response in BMSCs.

Keywords: BMSCs; Cell passage; Irradiation; Transcriptome.


Conflict of interest statement

Ethics approval and consent to participate

The study was approved by the Army Medical University Institutional Ethics Committee.

Consent for publication

Not applicable.

Competing interests

The authors declare that they have no competing interests.

Publisher’s Note

Springer Nature remains neutral with regard to jurisdictional claims in published maps and institutional affiliations.

Figures

Fig. 1
Fig. 1
Cellular characteristics of BMSCs. a Pipeline of this work. b Cell cycle analysis of BMSCs from passages 6 and 10 of in vitro expansion. c Apoptosis analysis of BMSCs from passages 6 and 10 of in vitro expansion. d Senescence of BMSCs from passages 6 and 10 of in vitro expansion. e Cytokine secretory level of BMSCs from passages 6 and 10 of in vitro expansion with (IR+) or without (IR−) irradiation. Data are represented as the mean ± SEM. Student’s t test was performed to compare P6 and P10 BMSCs with significance set at a P value of less than 0.05. *P < 0.05, **P < 0.01. The same letter (lowercase for P10 and uppercase for P6, respectively) indicates no significant difference among different post-irradiation time (Tukey HSD, P < 0.05)
Fig. 2
Fig. 2
BMSC gene expression profiles. a PCA showing clustering by passage, with strong separation of the P6 and P10 BMSCs. b Bar plot illustrating up- and downregulated gene numbers from the P6 versus the P10 data sets. c Venn diagrams for up-(left) and downregulated (right) genes between the P6 and P10 BMSCs that were, both shared and had unique DEG numbers at the three time points. The top10 enriched KEGG pathways for up- (d) and downregulated (e) genes from the P6 versus P10 data sets at 0 h. The numbers after each bar indicate the detected genes (left) and the total background genes involved in the pathway
Fig. 3
Fig. 3
Molecular response of BMSCs to irradiation. a Bar plots representing up- and downregulated gene numbers between the different time points for the P6 (left) and P10 (right) BMSCs. b Venn diagrams of differentially expressed genes between the different time points illustrate shared and unique genes between the P6 and P10 BMSCs. The top 10 most enriched KEGG pathways were illustrated for genes that were up- (c) and downregulated (d) after irradiation. The colour scale shows the significance (P value) of the pathways
Fig. 4
Fig. 4
Expression patterns of conserved irradiation response genes in BMSCs. Venn diagrams for up- (a) and downregulated (b) genes shared by the P6 and P10 BMSCs according to the DEG analysis. c The expression pattern of the upregulated genes: each cluster of genes was distinguished accordingly by colour. d Expression patterns of the downregulated genes: each cluster of genes was distinguished accordingly by colour. e Expression pattern of genes that were either upregulated or downregulated at both 8 h and 2 h after irradiation relative to 0 h. f Relative expression levels of GDF15, CDKN1A and MDM2 measured by RNA-seq (FPKM) (up) and qRT-PCR (down). For qPCR, actin was used as the reference gene, and non-irradiated P6 BMSCs were used as the control groups. g Western blotting to evaluate CDKN1A, GDF15, HUJRP and p53 expression. All western blots are representative of three independent experiments. h Representative immunofluorescence staining in BMSCs. DAPI (blue), HJURP (red), merged images and quantification of immunofluorescence intensity (right) were shown. The photos were selected randomly. Scale bar 50 μm. Data are represented as the mean ± SEM. Student’s t test was performed to compare P6 and P10 BMSCs with significance set at a P value of less than 0.05. *P < 0.05, **P < 0.01. The same letter (lowercase for P10 and uppercase for P6, respectively) indicates no significant difference among different post-irradiation time (Tukey HSD, P < 0.05)
Fig. 5
Fig. 5
Weighted gene co-expression correlation network analysis of the differential expression genes. a Heat map showing the correlations of gene co-expressions modules (colour names) with the cell passage and radiation status. Numbers overlaying the heat map denote Pearson correlation coefficients (top number) and P values (lower number in brackets). Positive (negative) correlations indicate correlation with cell passages or the radiation treatment time background. b Heat map showing eigengene patterns of gene co-expression modules for six samples. The KEGG pathways on the right were significantly enriched for the genes assigned to the corresponding modules. c Sub-network of genes from five different gene co-expression modules. The node size indicates the correlation number. The red line represents positive correlations. The blue line represents negative correlation. d Relative expression levels of BCL2L1, TNFRSF10B and GADD45A measured by RNA-seq (FPKM) (up) and qRT-PCR (down). For qPCR, actin was used as the reference gene, and non-irradiated P6 BMSCs were used as the control groups; e Validation of expression correlations between two genes by qPCR. Data are represented as the mean ± SEM. Student’s t test was performed to compare P6 and P10 BMSCs with significance set at a P value of less than 0.05. *P < 0.05, **P < 0.01

References

    1. Nickoloff EL, Alderson PO. Radiation exposures to patients from CT: reality, public perception, and policy. Am J Roentgenol. 2001;177(2):285–287. - PubMed
    1. Steel GG. Basic clinical radiobiology. 3rd ed. Berlin: Edward Arnold; 1993.
    1. Xue X, Han X, Li Y, Chu X, Miao W, Zhang J, Fan S. Astaxanthin attenuates total body irradiation-induced hematopoietic system injury in mice via inhibition of oxidative stress and apoptosis. Stem Cell Res Ther. 2017;8(1):Article 7. - PMC - PubMed
    1. Rich JN. Cancer stem cells in radiation resistance. Cancer Res. 2007;67(19):8980–8984. - PubMed
    1. Nicolay NH, Lopez Perez R, Debus J, Huber PE. Mesenchymal stem cells - a new hope for radiotherapy-induced tissue damage? Cancer Lett. 2015;366(2):133–140. - PubMed

Publication types

MeSH terms