. 2019 Mar 19;50(3):723-737.e7.
doi: 10.1016/j.immuni.2019.02.007. Epub 2019 Mar 5.

Microglial Function Is Distinct in Different Anatomical Locations during Retinal Homeostasis and Degeneration

Affiliations

Microglial Function Is Distinct in Different Anatomical Locations during Retinal Homeostasis and Degeneration

Emily G O'Koren et al. Immunity. .

Abstract

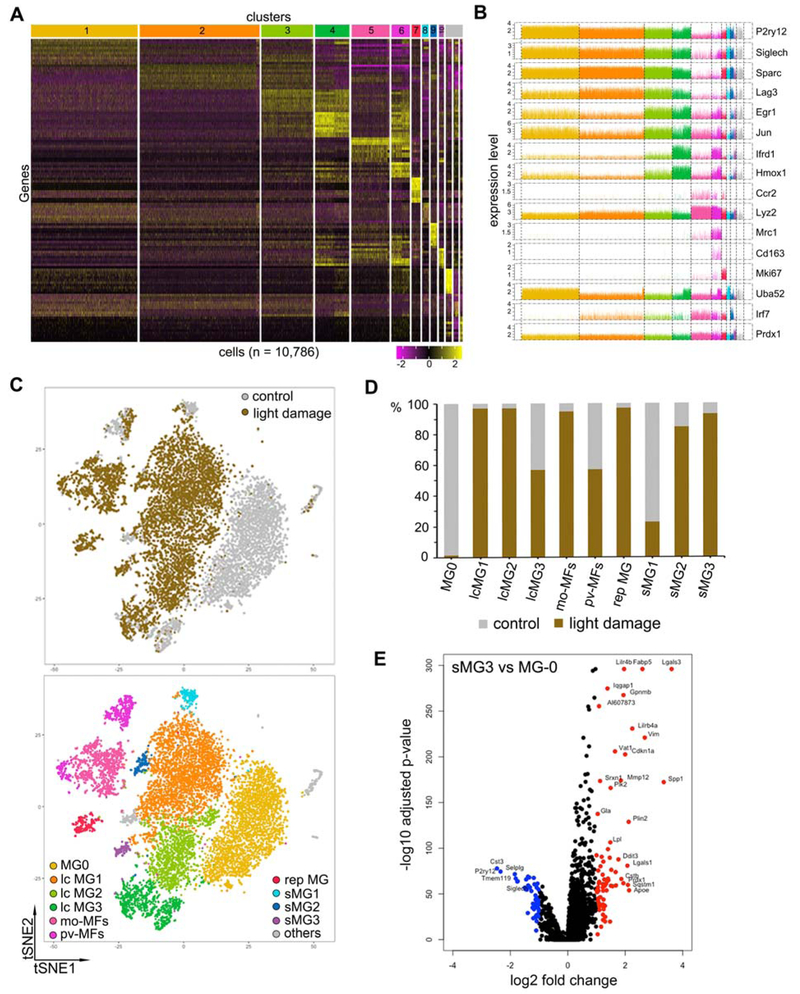
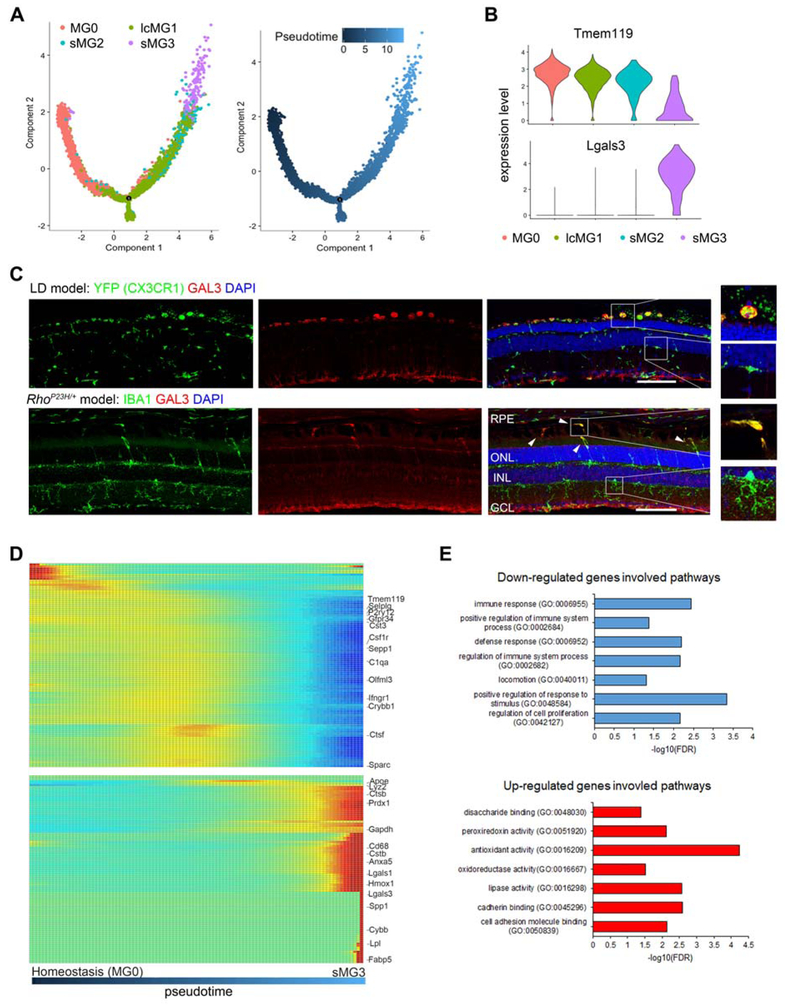
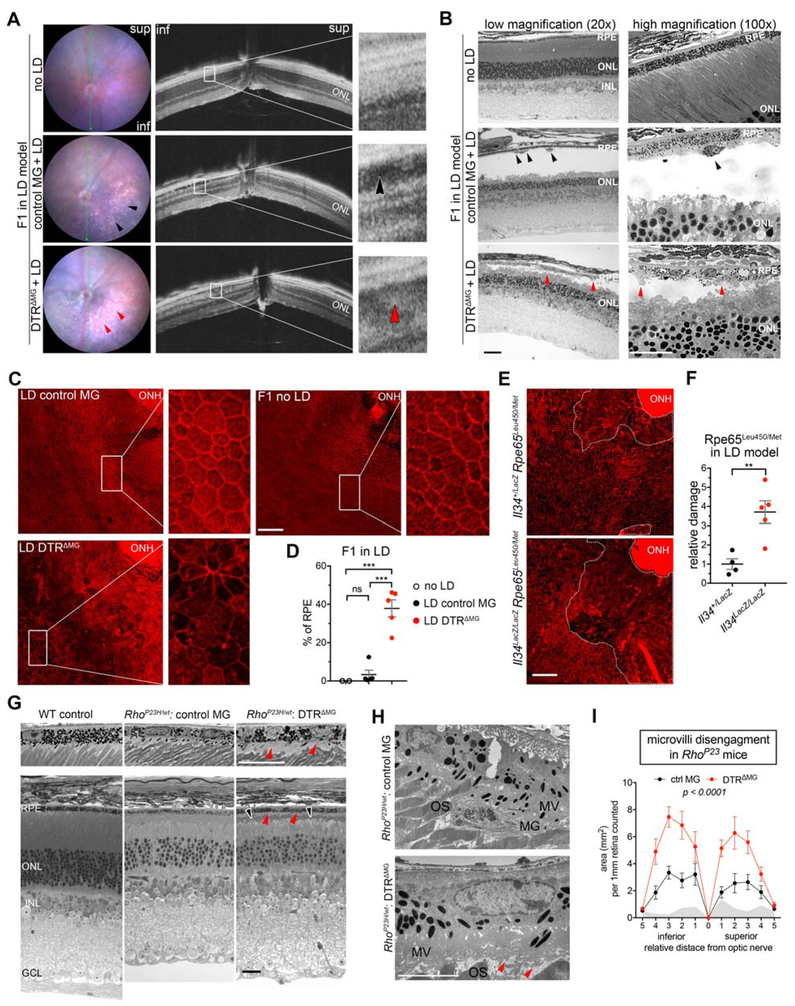
Microglia from different nervous system regions are molecularly and anatomically distinct, but whether they also have different functions is unknown. We combined lineage tracing, single-cell transcriptomics, and electrophysiology of the mouse retina and showed that adult retinal microglia shared a common developmental lineage and were long-lived but resided in two distinct niches. Microglia in these niches differed in their interleukin-34 dependency and functional contribution to visual-information processing. During certain retinal-degeneration models, microglia from both pools relocated to the subretinal space, an inducible disease-associated niche that was poorly accessible to monocyte-derived cells. This microglial transition involved transcriptional reprogramming of microglia, characterized by reduced expression of homeostatic checkpoint genes and upregulation of injury-responsive genes. This transition was associated with protection of the retinal pigmented epithelium from damage caused by disease. Together, our data demonstrate that microglial function varies by retinal niche, thereby shedding light on the significance of microglia heterogeneity.

Keywords: IL-34; macrophages; microglia; microglial heterogeneity; phagocytes; retinal degeneration; retinitis pigmentosa.


Conflict of interest statement

DECLARATION OF INTERESTS

The authors declare no competing interest.

Figures

Figure 1.
Figure 1.. Fate Mapping Reveals Ontogeny, Longevity and Phenotype of Retinal Microglia.
(A) Schematic showing the anatomy of the eye. (B) Flow cytometry plots depict yolk-sac derived microglia in retina. Pregnant Runx1MCreM; RosaR26R-eYFP mice received tamoxifen 4’OHT at E7.5 days. Tissues were collected from 8 wk old progeny for flow cytometry. (C) Dot plots (mean ± SEM) summarize the percentage of Runx1-YFP+ microglia shown in (B) from 2 independent experiments. Each dot represents one mouse (n = 4 to 6 per group). (D) Representative images show distribution of short-lived (fGFP) and long-lived (fGFP+) macrophages. Adult Cx3cr1Cre-ER; RosaR26R-fGFP mice received tamoxifen and collected 1 yr later. (outer and inner nuclei layer, ONL and INL; outer and inner plexiform layer, OPL and IPL; ganglion cell layer, GCL; ciliary body, CB; Optic N, nerve). Choroid layer boundary is delineated (white lines). Scale bars, 100 μm. (E, F) Adult Cx3cr1Cre-ER; RosaP26R-fGFP mice received tamoxifen and tissues collected at 48 hrs (baseline) and 1 yr. Representative flow cytometry plots of macrophages at 1-yr post or control (E). Representative dot plots compare the percentage of fGFP+ macrophages between 48-hr and 1-yr (F) from 2 independent experiments. Grey areas (mean ± SD) show the percentage of control (n=9 eye tissues). Each dot represents one mouse (n = 6 per group). (G, H) tSNE clustering of long- and short-lived macrophages (G) and tissue specificity of long-lived macrophages (H). See also Figure S1.
Figure 2.
Figure 2.. IL-34 Dependent Microglia Niche is Located at the IPL and These Microglia Functionally Contribute to Cone Bipolar Cell Output.
(A) Bar graphs (mean ± SEM) compare Il34 mRNA levels relative to Csf1 in skin (n=6), retina (n=6), and lymph node (n=4) from 2 independent experiments. GAPDH was used as a loading control. Level of Il34 in lymph node is set as 1. (B) Dot plots (mean ± SEM) depict the percentage of microglia compared to total viable singlets in Il34 mutant mice analyzed by flow cytometry. Each dot represents one mouse. (C, D) Representative images of microglia (IBA1, grey; DAPI, blue) from cross-sections (C) and retina flatmounts (D) compare the microglia distribution in OPL and IPL of Il34 mutant mice. Data were collected from 3 independent experiments. Scale bars, 100 μm. (E) Dot plots (mean ± SEM) depict microglia density shown in (D) from 4 independent experiments. Each dot represents one mouse (n = 6 or 10 per group). (F, G) Images show specific localization of Il34 promoter guided β-gal (green) in RGC layer (Brn3a, red; DAPI, blue). Scale bars, 50 μm. (H) RNAScope of Il34 in Atoh7 mutant mice (Il34, yellow; DAPI, blue). Scale bar, 50 μm. (I, J) ERG recordings of scotopic b-wave and photopic flicker response shown in (I) and (J), respectively. Scotopic b-waves are shown as rod driven and cone drive components (I). Data (Il34+/LacZ, n = 6; Il34LacZ/LacZ n = 10) were from 2 independent experiments. See also Figure S2.
Figure 3.
Figure 3.. The SRS is a Microglia-Dominant Immune Cell Niche in Models of Photoreceptor Degeneration.
(A) Representative images from cross sections (Cx3cr1YFP cells, green; DTR, red) show microglia in SRS of F1-iDTR mice in LD. See Fig.S3A for details. DAPI, blue. Scale bar,100 μm. (B) Dot plots show the percentage of DTR+ cells among Cx3cr1+ cells in undamaged and damaged areas of F1-iDTR mice from 2 independent experiments. Each dot represents one mouse (n = 5). (C) Representative images (YFP, green; DTR, red) from RPE flatmounts show the attachment of microglia onto the RPE in LD. Scale bar, 100 μm. (D) Dot plots (mean ± SEM) depict microglia depletion efficiency in LD shown in (C). Each dot represents one mouse (n = 5 per group). (E) Immunofluorescence images show SRS phagocytes (IBA1, magenta) in RhoP23H/wt retinas. DAPI, blue. Scale bar, 50 μm. (F) RPE flatmounts show DTR+ microglia (YFP, green; DTR, red) on the RPE of P23H-iDTR mice at P30. Tissues were collected 3 wks post last tamoxifen. Scale bar, 100 μm. (G) Images of RPE flatmounts show depletion of microglia (IBA1, grey) in female P23H-iDTR mice at P60. See Fig.S3A for details. Scale bar, 100 μm. (H) Dot plots (mean ± SEM) depict microglia depletion efficiency shown in (G) from 3 independent experiments. Each dot represents one mouse (n = 3 or 6 per group). See also Figure S3.
Figure 4.
Figure 4.. Single-Cell RNA-Seq Uncovers A Distinct Microglia Type Associated with Retinal Degeneration.
(A) Heatmap of unsupervised clustering analysis featuring top 10 discriminative genes per cluster. Expression level is scaled based on z-score distribution. Data were collected from FACS-sorted live Cx3cr1YFP+ cells from pooled neuroretinas of normal (n=5) and LD (n=8) mice. (B) Expression level of selected marker genes for clusters in (A) is shown. (C) tSNE plots of scRNA-seq show unsupervised clusters. Top, control and LD; bottom, 10 major clusters. (D) Bar graphs show sample components of each cluster in (C). (E) Volcano plot shows the fold change of genes (log2 scale) and significance (−log 10 scale) between sMG3 and MG0. Upregulated genes, red; downregulated genes, blue. P-values adjusted based on Bonferroni correction. See also Figure S4 and Table S1.
Figure 5.
Figure 5.. Microglia that Occupy the SRS in Photoreceptor Degeneration Undergo Transcriptional Reprograming.
(A) Trajectory analysis suggests transition of different microglia subtypes (left) along pseudotime (right). Pseudotime of MG0 cluster is set as 0. Top 1000 variably expressed genes from clustering analysis are used. (B) Violin plots depict expression changes of marker genes across clusters as indicated. (C) Representative images show GAL3+ (red) srMG in LD (top: YFP, green) and RhoP23H (bottom: IBA1, green). Images were acquired in three independent experiments from 6 and 4 mice, respectively. See Table S2 for details. Scale bars, 100 μm. (D) Heatmap illustrates dynamic transition from MG0 to sMG3 along pseudotime: top, downregulated genes; bottom, upregulated genes. Genes are clustered and ordered based on expression profile. Values beyond the scale range are set to minimum or maximum. (E) Bar graphs show top ranked pathways by fold enrichment and significance (−log 10 scale) from GO-term pathway enrichment analysis. Top, downregulated genes (blue); bottom, upregulated (red). Top 100 downregulated and 100 upregulated genes in between sMG3 and MG0 are used for the analysis. See also Figure S5 and Table S2.
Figure 6.
Figure 6.. SrMG Functionally Contribute to Protection of RPE Structural Integrity in Photoreceptor Degeneration.
(A) In vivo retinal imaging of live CBF1 mice (left: fundus microscopy; right: OCT) shows morphological changes in LD. Black and red arrow indicate hypo- and hyper-reflectivity of outer retina, respectively. (B) Histology reveals accumulation of subretinal debris in LD described in (A). Scale bar, 100 μm (left) and 50 μm (right). Black arrows indicate SRS phagocytes; red arrows indicate photoreceptor debris. (C) Representative images of RPE flatmounts show F-actin (phalloidin, red) change of the RPE in LD. ONH, optical nerve head. Scale bar, 100 μm. (D) Dot plots (mean ± SEM) depict the percentage of dysmorphological RPE in (C) from 3 independent experiments. Each dot represents one mouse. (E) Images of RPE flat mounts show loss of distinguishable RPE around the ONH of Il34 deficient mice (Rpe65Leu450/Met450) upon LD. Dashed circles indicate the damaged area. Scale bar, 100 μm. (F) Dot plots (mean ± SEM) depict the relative fold change of damaged area in (E). Each dot represents one mouse (n = 4 or 5 per group). (G) Histological images shows outer segment shrinking in DTRΔMG retina of RhoP23H/wt mice at P60. Two magnifications are shown. Scale bars, 100 μm. Black arrows indicate shortened outer segments, and red arrows indicate RPE microvilli disengagement from outer segments. (H) Images of TEM show disorganized apical microvilli of RPE in RhoP23H/wt: DTRΔMG retina as described in (E). MG, microglia; MV, microvilli; OS, outer segments. Scale bar, 5 μm. (I) The plots (mean ± SEM) quantify the area between outer segment tips and apical side of the RPE cell body described in (E) from 3 independent experiments. Grey areas show one WT control. Control MG, n = 8; DTRΔMG, n = 10. See also Figure S6.

Comment in

References

    1. Ajami B, Bennett JL, Krieger C, Tetzlaff W, and Rossi FM (2007). Local self-renewal can sustain CNS microglia maintenance and function throughout adult life. Nat Neurosci 10, 1538–1543. - PubMed
    1. Bennett ML, Bennett FC, Liddelow SA, Ajami B, Zamanian JL, Fernhoff NB, Mulinyawe SB, Bohlen CJ, Adil A, Tucker A, et al. (2016). New tools for studying microglia in the mouse and human CNS. Proc Natl Acad Sci U S A 113, E1738–1746. - PMC - PubMed
    1. Blanton SH, Heckenlively JR, Cottingham AW, Friedman J, Sadler LA, Wagner M, Friedman LH, and Daiger SP (1991). Linkage mapping of autosomal dominant retinitis pigmentosa (RP1) to the pericentric region of human chromosome 8. Genomics 11, 857–869. - PubMed
    1. Brown NL, Patel S, Brzezinski J, and Glaser T (2001). Math5 is required for retinal ganglion cell and optic nerve formation. Development 128, 2497–2508. - PMC - PubMed
    1. Buch T, Heppner FL, Tertilt C, Heinen TJ, Kremer M, Wunderlich FT, Jung S, and Waisman A (2005). A Cre-inducible diphtheria toxin receptor mediates cell lineage ablation after toxin administration. Nat Methods 2, 419–426. - PubMed

Publication types