. 2019 Mar 8;4(33):eaav5581.
doi: 10.1126/sciimmunol.aav5581.

Generation and persistence of human tissue-resident memory T cells in lung transplantation

Affiliations

Generation and persistence of human tissue-resident memory T cells in lung transplantation

Mark E Snyder et al. Sci Immunol. .

Abstract

Tissue-resident memory T cells (TRM) maintain immunity in diverse sites as determined in mouse models, whereas their establishment and role in human tissues have been difficult to assess. Here, we investigated human lung TRM generation, maintenance, and function in airway samples obtained longitudinally from human leukocyte antigen (HLA)-disparate lung transplant recipients, where donor and recipient T cells could be localized and tracked over time. Donor T cells persist specifically in the lungs (and not blood) of transplant recipients and express high levels of TRM signature markers including CD69, CD103, and CD49a, whereas lung-infiltrating recipient T cells gradually acquire TRM phenotypes over months in vivo. Single-cell transcriptome profiling of airway T cells reveals that donor T cells comprise two TRM-like subsets with varying levels of expression of TRM-associated genes, whereas recipient T cells comprised non-TRM and similar TRM-like subpopulations, suggesting de novo TRM generation. Transplant recipients exhibiting higher frequencies of persisting donor TRM experienced fewer adverse clinical events such as primary graft dysfunction and acute cellular rejection compared with recipients with low donor TRM persistence, suggesting that monitoring TRM dynamics could be clinically informative. Together, our results provide spatial and temporal insights into how human TRM develop, function, persist, and affect tissue integrity within the complexities of lung transplantation.


Conflict of interest statement

Competing interests: The authors declare that they have no competing interests with regard to this work.

Figures

Figure 1:
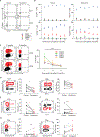
Figure 1:. Donor derived memory T cells persist specifically within the lung allograft.
Donor and recipient-derived T cells were evaluated in blood and BAL samples of lung transplant recipients by flow cytometry based on HLA class I disparities (see methods). (A) Schematic of experimental design to follow how donor- and recipient-derived T cells would interact in lung transplant recipients. (B) Representative flow cytometry plots of donor versus recipient CD4+ (left) and CD8+ (right) T cells derived from peripheral blood. (C) Representative flow cytometry plots show CD4+ (middle) and CD8+ (right) T cell frequency and donor/recipient origin from a representative BAL sample. (D) Left: Graphs show percent CD4+ (top) and CD8+ (bottom) T cells of donor origin (relative to total CD4+ or CD8+T cells) in peripheral blood over time post-transplantation in individual patients (n=14 patients with > 3 samples over time). Right: Absolute cell counts of donor CD4+ (right top), and CD8+ T cells (right, bottom) in peripheral blood in the same patients, with dotted line representing average recipient T cell count over time. (E) Graphs show percent CD4+ (top) and CD8+ (bottom) T cells of donor origin (relative to total CD4+ or CD8+T cells) in BAL samples post-transplantation, showing individual curves for each of 20 patients. Symbols for each individual patient are designated in the legend at right. (F) CD4:CD8 T cell content in the BAL of transplant recipients (total T cell content from donor and recipient) at indicated times post-transplantation. Results shown for 19 patients; significance indicated as *** (p <0.01), all other comparisons non-significant.
Figure 2:
Figure 2:. Bronchoalveolar (BAL) of human lungs samples T cells from both the lung parenchyma and airways.
(A) Schematic diagram (left) highlighting the lateral basilar segment of the lower lobe which is where the BAL was performed and where control lung and airway segments were procured, and photograph (right) of one study lung included in the analysis. (B) Representative flow cytometry plots showing CD4 and CD8 ratio across locations. Significance indicated by *** (p = 0.0008). (C) T cell subset composition in the BAL, airway and lung parenchyma showing effector-memory (TEM, CCR7-CD45RA-), terminally differentiated effector cells (TEMRA, CCR7-CD45RA+), central memory T cells (TCM, CCR7+CD45RA-), and naïve T cells (CCR7+CD45RA+) in representative flow cytometry plots (left) and compiled frequencies (mean±SEM) from 15 control lungs. Significance indicated by ** (p = 0.006). (D) Cell surface expression of tissue residency markers CD69 and CD103 by CD4+ and CD8+ T cells across locations shown as representative flow cytometry plots (top) and compiled frequencies (bottom)from 15 donors; significance indicated by *** (p = 0.0002) and **** (p < 0.0001).
Figure 3:
Figure 3:. Donor and recipient BAL T cells are phenotypically and functionally memory T cells.
(A) Subset composition of donor and recipient CD4+ and CD8+ T cells in representative patient BAL based on CD45RA and CCR7 expression as in Fig. 2 showing frequency of TEM (red), TEMRA (blue), TCM (purple) and naïve (green). (B) Compiled data (mean±SEM) of donor (left) and recipient (right) T cell subset composition over time post-transplantation for CD4+ (top) and CD8+T cell (right) lineages. Results compiled from 20 patients with one sample per patient per time point. (C) HLA-DR expression by donor and recipient T cells in patient BAL at indicated times post-transplantation shown as representative flow cytometry plots (left) and compiled frequencies from 23 samples derived from 11 patients (right). For (D) through (F), T cells from patient BAL samples were stimulated with PMA/ionomycin and cytokine production determined by intracellular staining after 5 hrs. (D) IFN-γ production by donor (black) and recipient (red) CD4+TEM (left) and CD8+TEM (right) in representative flow cytometry plots and graphs showing paired frequencies (based on percent cytokine+ of donor or recipient T cells) in patient BAL samples (n=8) 1–9 months post-transplantation (right). Significance indicated by * (p = 0.04) for CD4+ TEM and * (p = 0.01) for CD8+TEM. (E) IL-17 production by donor (black) and recipient (red) CD4+ TEM in representative flow cytometry plot (left) and graph (right) showing paired frequencies in patient BAL samples (n = 7) 1–9 months post-transplantation. Significance indicated by * (p = 0.05). (F) IL-2 production by donor (black) and recipient (red) CD4+ TEM in representative flow cytometry plot (left) and graph showing paired frequencies in patient BAL samples (right, n = 8); n.s., not significant. (G) Granzyme B (GzB) expression by CD4+ TEM (left) and CD8+ TEM (right) from BAL samples obtained >2 months post-transplantation in representative flow cytometry plots (left) and cumulative paired data (right) from 6 transplant recipients of donor (black) and recipient (red), significance indicated by * (p = 0.04, right).
Figure 4:
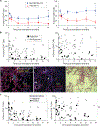
Figure 4:. Differential expression of TRM markers by donor and recipient-derived T cells with time.
(A) Expression of CD69 and CD103 by CD4+ (top two rows) and CD8+T cells (third and fourth rows) of donor or recipient origin as indicated, over time post-transplantation for one representative patient, P5. (B) Graphs show mean frequency (± SEM) of CD69 expression (left) or CD69/CD103 co-expression (right) by CD4+TEM (top) or CD8+TEM (bottom) cells in patient BAL at indicated times post-transplantation, compiled from 20 patients. T cell origin designated as donor (blue), recipient (red) based on HLA disparities (see Figure 1); grey shaded rectangles denote one standard deviation around the average frequency of CD69+/−CD103 expression by control BAL T cells compiled from Fig. 2D. (C) Expression of CD49a (left), PD-1(middle) and CD101(right) by BAL, airways and parenchyma obtained from control lungs shown as representative flow cytometry plots and mean frequencies ( SEM) compiled from 14 lungs. Significance indicated by * (p = 0.02); CD49a (bottom left), significance indicated by * (p<0.05) and ** (p = 0.004); and PD1 (right), ns = non-significant. (D) CD49a expression by donor (black) and recipient (red) CD4+ TEM (top) and CD8+ TEM (bottom) cells in patient BAL samples shown as representative flow cytometry plots (left) and in graphs showing paired frequencies from individual patient BAL samples (n=6) at >1 month post-transplantation. Significance indicated as *** (p = 0.0003) and * (p = 0.007). (F) PD-1 expression by donor (black) and recipient (red) CD4+ TEM (top) and CD8+ TEM (bottom) cells in patient BAL shown as representative flow cytometry plots (left) and graphs showing paired frequencies in patient BAL samples (n = 14) >6 months post-transplant. Significance indicated as *** (p = 0.0001); n.s., not significant. (G) CD101 expression by donor (black) and recipient (red) CD4+TEM (top) and CD8+TEM (bottom) cells in representative flow cytometry plots (left) and paired frequencies in patient BAL samples (n=15) at >1month post-transplantation. Significance indicated as * (p = 0.02); n.s., not significant.
Figure 5:
Figure 5:. Single cell transcriptome profiling of BAL T cells reveal three distinct subsets with differential expression of TRM-associated genes.
(A) Representative flow cytometry plots from the BAL of P29 11 months post-transplantation showing gating strategy to identify cell populations sorted into 96 well plates for single cell RNA sequencing (scRNA-seq); *** indicates the population sorted: live, CD3+, lymphocytes, pan-HLA+. (B) Representative flow cytometry plot from influx sorter identifying cell surface markers indexed to individual wells. (C) Principal component clustering identifying three distinct clusters demarcated by color and t-distributed stochastic neighbor embedding (tSNE) plots visualizing cluster differentiation (see methods); indexed cell surface markers identifying cell origin (donor v recipient) and protein surface expression for CD4, CD8, CD69, and CD103 are indicated within each cluster in separate tSNE plots. (D) Heatmap illustrating single-cell analysis for top differentially expressed genes along with select genes of interest, arranged by cluster. Heatmap of z-scored expression values are defined as log1+nUMIijmediannUMIjnUMIj where nUMIij is the number of UMI counts for gene i in cell j and nUMIj is the total number of UMI counts in cell j.
Figure 6:
Figure 6:. TRM-like subsets exhibit quantitative gene expression differences in donor and recipient T cells and are consistent between patients.
(A) Heatmap of the z-scored mean expression values (as defined in Fig. 5D) of select genes based on differential expression analysis in each cluster, with cluster 1 designated as “mature TRM”; cluster 2 designated as “TEM”, and cluster 3 designated as “TRM-like”. (B) Volcano plots showing differential gene expression in donor compared to recipient T cells in each cluster. (C) Principal component clustering from scRNA-seq analysis of CD3+ T cells obtained from the BAL of P19 13 months post-transplantation identifies two distinct clusters, demarcated by color; tSNE plots visualizing cluster differentiation. (D) Pearson correlation analysis comparing gene expression within clusters 0,1,2 from patient P29 to gene expression within clusters 0,1 from patient P19.
Figure 7:
Figure 7:. Donor and Recipient-derived T cells cluster near airways.
Immunofluorescence imaging of trans-bronchial biopsies (TBBx) obtained from three transplant recipients (P12, P20, P23); for P12 and P20, the recipient is HLA-A2+ and donor HLA-A2-, for P23, the recipient is HLA-A2- and donor HLA-A2+. Short yellow arrows point to recipient derived T cells and long green arrows point to donor-derived T cells. (A,D,G) H&E stained samples showing small airway with cluster of lymphocytes. (B,E,H) Images show expression of E cadherin (purple), DAPI (blue), CD4 (green), and HLA-A2 (red); (C,F,I) Images show expression of E cadherin (purple), DAPI (blue), CD8 (green), and HLA- A2 (red).
Figure 8:
Figure 8:. Donor TRM persistence is associated with reduced clinical complications.
Patient records were examined for clinical complications including primary graft dysfunction (PGD) and episodes of acute cellular rejection (ACR) at all timepoints of BAL acquisition (see methods). (A) Graphs show percentage (mean ± SEM) of donor CD4+ (left) or CD8+ (right) T cells in the BAL over indicated times following transplantation in patients (n = 20) stratified based on those who experienced PGD (red) or did not (blue). Significance indicated by ** (left, p = 0.003) and ** (right, p = 0.002); cumulative data across all timepoints showed increased proportion of donor CD8+ (p = 0.008) and trends in increased donor CD4+ (p = 0.06) T cells in those participants without PGD (B) Donor CD4+ (left) and CD8+ (right) T cells frequencies over indicated times following transplantation in patients (n = 20 total patients; n = 7 patients with 10 discrete episodes of acute cellular rejection at any time) based on presence (filled square) or absence (empty circle) of acute cellular rejection. Significance indicated by *** (p < 0.01). (C, D, E) Serial sections of a TBBx from one patient (P29) who experienced acute cellular rejection at one month following lung transplant (grade 1); donor is HLA-A2+, recipient is HLA-A2-. Immunofluorescence imaging stained for E cadherin (purple), CD4 (green), HLA-A2 (red), and DAPI. Yellow arrows indicate donor cells, green arrows indicate recipient cells, *identifies a blood vessel (E) H&E stain, *identifies blood vessel (*BV). (F) Frequency of donor-origin CD4 (left) and CD8 (right) T cells in the BAL stratified based on the presence or absence of a positive bacterial culture. * indicates p-value < 0.05; n.s.: not significant.

References

    1. Watanabe R, Gehad A, Yang C, Scott LL, Teague JE, Schlapbach C, Elco CP, Huang V, Matos TR, Kupper TS, Clark RA, Human skin is protected by four functionally and phenotypically discrete populations of resident and recirculating memory T cells. Sci Transl Med 7, 279ra239 (2015). - PMC - PubMed
    1. Schenkel JM, Fraser KA, Beura LK, Pauken KE, Vezys V, Masopust D, T cell memory. Resident memory CD8 T cells trigger protective innate and adaptive immune responses. Science 346, 98–101 (2014). - PMC - PubMed
    1. Mueller SN, Mackay LK, Tissue-resident memory T cells: local specialists in immune defence. Nat Rev Immunol 16, 79–89 (2016). - PubMed
    1. Teijaro JR, Turner D, Pham Q, Wherry EJ, Lefrancois L, Farber DL, Cutting edge: tissue-retentive lung memory CD4 T cells mediate optimal protection to respiratory virus infection. J Immunol 187, 5510–5514 (2011). - PMC - PubMed
    1. Turner DL, Farber DL, Mucosal resident memory CD4 T cells in protection and immunopathology. Front Immunol 5, 331 (2014). - PMC - PubMed

Publication types